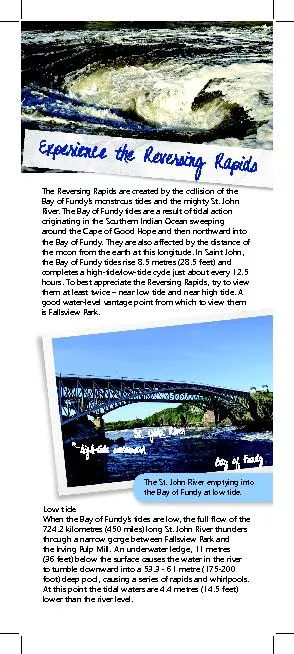
/
Bay of Fundy at low tide Bay of Fundy at low tide

Bay of Fundy at low tide - PowerPoint Presentation

medshair
medshair . @medshair
Follow
383 views
Uploaded On 2020-08-27

Bay of Fundy at low tide - PPT Presentation

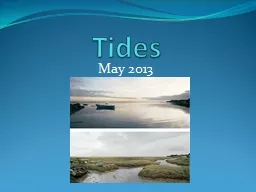
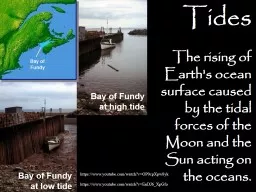
Tides Bay of Fundy at high tide The rising of Earths ocean surface caused by the tidal forces of the Moon and the Sun acting on the oceans httpswwwyoutubecomwatchvOP0cpXpw8yk httpswwwyoutubecomwatchvEnDJ6XpGfo ID: 805877

tidal tides water tide tides tidal tide water cycle high level moon range sea feet repeated earth force www

Share:

Link:

Embed:

Download Presentation from below link

Download The PPT/PDF document "Bay of Fundy at low tide" is the property of its rightful owner. Permission is granted to download and print the materials on this web site for personal, non-commercial use only, and to display it on your personal computer provided you do not modify the materials and that you retain all copyright notices contained in the materials. By downloading content from our website, you accept the terms of this agreement.


Presentation Transcript

Slide1

Bay of Fundy at low tide

Tides

Bay of Fundy at high tide

The rising of Earth's ocean surface caused by the tidal forces of the Moon and the Sun acting on the oceans.

https://www.youtube.com/watch?v=OP0cpXpw8yk

https://www.youtube.com/watch?v=EnDJ6_XpGfo

Slide2

A tide is a repeated cycle of sea level changes in the following stages:

1st step

Over several hours the water rises or advances up a beach in the flood tide.

Tidal Cycle

Slide3

A tide is a repeated cycle of sea level changes in the following stages:

2nd step

Water reaches its highest level, stops at high water. Tidal currents cease. Called slack water or slack tide. Tide reverses direction and is said to be turning.

Tidal Cycle

Slide4

A tide is a repeated cycle of sea level changes in the following stages:

3rd Step

The sea level lowers or falls over several hours during the ebb tide.

Tidal Cycle

Slide5

A tide is a repeated cycle of sea level changes in the following stages:

4th Step

The level stops falling at low water. This point is also described as slack tide or turning.

Tidal Cycle

Slide6

A tide is a repeated cycle of

sea level changes

Tidal Cycle

A tide is a repeated cycle of sea level changes

Slide7

Tides

As the Earth rotates, the moon’s gravity pulls water toward the point on the Earth’s surface closest to the moon.

http://www.onr.navy.mil/Focus/ocean/motion/tides1.htm

Slide8

Spring Tides

During new moon and full moon, the sun, moon, and Earth are almost in alignment.

The combined gravity causes higher than normal high tides and lower than normal low tides

Slide9

Neap Tides

1st and 3rd quarter moon is at right angles to sun and Earth.

The sun’s pull is at right angle to the Earth, causing lowest height difference between tides

Slide10

3

rd

Quarter Moon1st Quarter Moon

Slide11

Slide12

Slide13

Slide14

Slide15

Slide16

Slide17

Slide18

Slide19

Slide20

Slide21

Slide22

Slide23

Slide24

Tidal force

- secondary effect of the force of gravity, responsible for the tides.

The side nearest to the second body experiences a greater force, while the opposite side experiences a lesser force.

Use the Force, Luke..

It occurs because the gravitational force exerted on one body by a second body is not constant across its diameter.

http://www.gly.uga.edu/railsback/Tides/TideHammer01.html

http://www.pbs.org/wgbh/nova/venice/tides.html

Slide25

Once a day

Diurnal Tides

- In parts of the northern Gulf of Mexico and Southeast Asia, tides have one high and one low water per tidal day

Slide26

Semi-diurnal tides

- two high and two low waters per tidal day. They are common on the Atlantic coasts of the United States and Europe.

Twice a day

Slide27

Mixed tides

- where successive high-water and low-water levels change a great deal. In these tides, we have a higher high water and lower high water as well as higher low water and lower low water. The tides around west coast of Canada and the United States are of this type.

Can’t Decide!

Slide28

Where on Earth?

Slide29

Graphing Tides

Slide30

Slide31

To calculate a tidal range, subtract the low tide from the high tide.

Minimum Tidal Range = 4.7 feet – 0.6 feet = 4.1 feet

4.7 feet

0.6 feetThe tidal range shown above is the minimum tidal range for this time period. What is the name given to tides such as these?What phases of the moon cause these tides?

Slide32

To calculate a tidal range, subtract the low tide from the high tide.

Maximum Tidal Range = 6.1 feet –

(-1.1 foot) = 7.2 feetThe tidal range shown above is the maximum tidal range for this time period. What

is the name given to tides such as these?What phases of the moon cause these tides?6.1 feet- 1.1 feet

Slide33

Day

Time

Height (meters) above mean sea levelMonday

6:00 AM1.5 2:00 PM

6.7 10:30 PM1.7

   Tuesday

7:30 AM

6.5


5:00 PM

1.9


Wednesday

3:00 AM

6.3


1:30 PM

2.1


Thursday

12:30 AM

6.1


12:30 PM

2.3


12:00 AM

5.9

When do we dock

?

One example of the importance of tides

Channel = 15 meters

Dockside depth = 15 meters

Draft of ship = 12.5 meters

Slide34

Wave characteristics

Wavelength

(L): distance between crests

Wave Height

(H) : vertical distance between crest and troughWave Period (T): time for successive waves to pass a fixed point

Slide35

Slide36

Kiawah

Island

Slide37

Slide38

Ebb-Tidal Delta

Slide39

Slide40

Slide41

Morris Island

Lighthouse

Coast Guard Station

Slide42