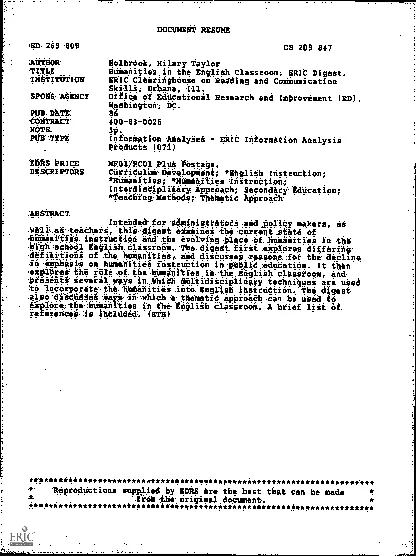
/
DOCUMENT RESUMEED 209 206SP 019 022TITLEiroaoting HealthPreventing Di DOCUMENT RESUMEED 209 206SP 019 022TITLEiroaoting HealthPreventing Di

DOCUMENT RESUMEED 209 206SP 019 022TITLEiroaoting HealthPreventing Di - PDF document

megan
megan . @megan
Follow
342 views
Uploaded On 2021-09-28

DOCUMENT RESUMEED 209 206SP 019 022TITLEiroaoting HealthPreventing Di - PPT Presentation

a41PROMOTINGHEALTHPREVENTINGDISEASEOBJECTIVES FOR THE NATIONet4Fall 1980DEPARTMENT OF EDUCTIONNATIONAL INSTITUTE OF EDUCATIONEDUCATIONAL RESOURCES INFORMATIONCENTER ERICThts document has been reprodu ID: 889133

percent health disease 1990 health percent 1990 disease data national 000 public state measures control dhhs high diseases programs

Share:

Link:

Embed:

Download Presentation from below link

Download Pdf The PPT/PDF document "DOCUMENT RESUMEED 209 206SP 019 022TITLE..." is the property of its rightful owner. Permission is granted to download and print the materials on this web site for personal, non-commercial use only, and to display it on your personal computer provided you do not modify the materials and that you retain all copyright notices contained in the materials. By downloading content from our website, you accept the terms of this agreement.


Presentation Transcript

1 DOCUMENT RESUMEED 209; 206SP 019 022TITL
DOCUMENT RESUMEED 209; 206SP 019 022TITLEi'roaoting Health/Preventing Disease. Objectives forithre Nation.,,INSTf1OTIONPublic Health Service (DHHS),..20ekville, ad.PUB DATE.80,.,NOTE,,98p.EBBS PRICE,dE01/PC04 Plus Postage.DESCPTORSOccident Prevention; Dental Health; *Di4ease Control;Drug Abuse; lasily Planning; *Health Education; Heart1.Disorders; Immunization Programs; *Long RangeiPlanning: *National Programs; Rut-tit-ion; OccupationalDiseases; Physical Fitness;"VOisoni.ng; Pregnancy;*Prevention; *Public Health; *smoking;' Venereal,....:,i,Diseases; ViolenceABSTACTA).Broad national goals ,express d as reductions inoveraydeath rates or days of,disability, have been estaol'shea asbeegt -related fields. These goals were established thr1guide imes for private and public sector policy makets ingh the workof various agencies, organization*/ and individuals par icipating in.a Department of Health. and-Human Services et /Art. Health priorityareas have been set for five major'litestagesNynfanalrchildhood,Adolescence, adulthood, and old age. this volume'ine out. specificand quantifiable objectives for the attainment of these goals.Objectives are established for controlling and.Proaoting'understanding of:(1)high blood pressure:0(2) familyplaaa.ing;(3)pregnancy and infant health;(4) immunization;(5) sexual4tranelitted diseases: (6):fluo4dation and dental health; 47)Surveillance and control of infectious diseases; (B) smokIng;(9),misuse.of.alcohol and drugs:(10)physical. fitness and exercise;(11)control of stress and violent beha4lor: (12) toxic agents; (13)occupational safety and health; wir accident prevention and injury;and (15) nutrition. In discussing each of these subjects, the natureand status of the problem is set forth. Prevention and controlmeasures.and specific objectives for 1990 are con idered, andItheLaiprincipal assumptions'that-lunderlietthe framing -0the objectives areoutlined. TNe data, necessary for tracking Kogreat t'he national..I.'and local levels are listed. (JD)./.1..4f,**30,030******************************************100**************#*Reproductions supplied by EDRS a;Ke the best that can be made'**.from Oe ogiginal dociment..***********4**************0******************************************** a41,)PROMOTINGHEALTH/PREVENTINGDISEASEOBJECTIVES FOR THE NATIONet4.Fall 1980DEPARTMENT OF EDUCTIONNATIONAL INSTITUTE OF EDUCATIONEDUCATIONAL RESOURCES INFORMATIONCENTER (ERIC)Thts document has been reproduced asreceived from the person or organizationIngmating itMinor changes have been made to improvereproduction cioalityPoints of view or opinions stated in this document do nut necessarily represenr officra, UEposition or policyLrI4DEPARTMEtIT OF HEALTH AND HUMAN SERVICES_Public Health ServiceU.SpVr.4441, *z.tDepartment of Health and Human ServicesPatricia Roberts Harris, SecretaryPublic Health ServiceJulius B. Richmond, M.D., Assistarit Secretaryfor Health and Surgeon GeneralOffice of Disease Prevention and Health PromotionJ. Michael McGanis, M.D., Deputy Assistant Secretary`for HealthCenter foi Disease ControlWilliam H. Foege, M.D., DirectorHealth Resources AdministrationlHenry A. Foley, Ph.D., Administrator,//Is./For futie by the Superintendent of Documents, U ii GovernmentPrinting OfficeWashington, D C 20402,3/1 ,DEPARTMENT OF HEALTH & HUMAN SERVICESPublic Health ServiceOffice of the Assistant Secretaryfor HealthWashington DC 20201I am pleased to share with you Promoting Health/Preventing Disease:Objectives for the Nation., Qur national strategy for achieving furtherimprovements in the healthP'of Americans was established in Healthy Peozle,a document that notes our accomplishments in prevention, identifies the'major health problems, and

2 sets national goals, for reducing death
sets national goals, for reducing death anddisability. ''This volume sets out sp6cific and measurable objectives forfifteen priority areas that are key to achieving our national healthaspirations.We appreciate the work of so many pedple to define quantifiableobjectives against Which we cdn assess the effectiveness of our efforts.--NAchievement of these objectives by 1990 is a'shared responsibility, requiringa concerted effort not only by the health community, but also by leadersin education, industry, labor, .community organizations and many others.These challenges for the eighties demand creative approaches andloy workingtogether we can realize our aspirations and really make a difference..weuljus B. Richmond,.D.Assistant Secretary fy Healthand Surgeon General JCONTENTS-apageINTRODUCTION AND OVERVIEW .1PREVENTIVE HEALTH SERVICESHIGH BLOOD PRESSURE CONTROL/5Specific 'ObjectivesFAMILY PLANNING71Specific Objectives13PREGNANCY AND INFANT HEALTH15Specific Objectives17IMMUNIZATION..21Specific Objectives ....22SEXUALLY TRANSMITTED DISEASES25Specific Objectives26HEALTH PROTECTION.TOXIC AGENT CONTROL31Specific Objectives14OCCUPATIONAL SAFETY ANDHEALTH39Specific Objectives41ACCIDENT PREVENTION ANDINJURY CONTROL45Specific Objectives47,.r.oh'I4.5NpageFLUORIDATION AND DENTALHEALTH/5tSpecific Objectives54SURVEILLANCE AND CONTROL OFINFECTIOUS DISEASES57Specific Objectives58HEALTH PROMOTIONSMOKING AND HEALTH.Specific Objectivet.,/6163MISUSE OF ALCOHOL AND DRUGS67Specific Objectives69NUTRITION73Specific Objectives75PHYSICAL FITNESS AND EXERCISE79Specific Objectives'80CONTROL OF STRESS AND VIOLENTBEHAVIORr ,83Specific Objectives\85ACKNOWLEDGEMENTS87(I/ v."INTRODUCTION AND OVERVIEWThe Purpose and the ProcessIn4.1979 the first Surgeon General's Report on HealthPromotion and Disease Prevention, Healthy People, wasissued. That report chronicled a century of dramatic gainsin the health' of the American people, revieWed presentpreventable threats to health, and identified fifteeti priorityareas in which, with appropriateactions, further gains cam11e expected over the decade..The report establishedbroad'National goalsexpressed as reductions in overall deathrates or days of disabilityfor theimprovement of thehealth of Americans at the five major life stages. Specifi-cally, the goals established were:To continue to improve infant health, and, by 1990,to reduce infant mortality by at.least35 percent, iofewer than nine deaths per 1,000 live births.To improve child health, foster optimal childhooddevelopment, and, by 1990, reduce deaths amongchildren ages one to 14 years by at leak 20 percent,to fewer than 34 per 100,000.To improve the health and health habits ofadoles,cents and young, adults, and, by1910,,,,,to reducedeaths among people ages 15 to 24' Ty at least20percent, to fewer than 93 per100,000.To improve the health of adults, and, by 1990, toreduce deaths among people ages 25 to 64 by atleast25 percent, to fewer than 400 per 100,000.To improve the health and quality of life forolderadults and, by 1990, to reduce the averageannualnumber of days df 4egtrieted, activity due to acuteand chionic conditions by 20 percent, tofewer than30 days per year for people aged 65 and older.This volume, Promoting Health/PreventingDiseasesetsout some specific and quantifiableobjectives necessary forthe attainment of these broad goals..Objectivesare-estab-lished for each of the 15 priority areas identified in theSurgeon General's report: high blood pressurecontrol;faniily planning; pregnancy and infant health;immuniza-tion; sexually transmitted diseases; toxic agentcontrol;occupational safety and health; accident preventionandinjury control; fluoridation and dental health;surveillancea

3 nd control of infectious diseases; smoki
nd control of infectious diseases; smokingand health;misuse of alcohol and drugs; physical fitnessand exercise;and control of stress and violent behavior.A number ofdifferent objectives are specified for each ofthe 15 areas.Taken together thetargets establishedin PromotingHealth/Preventing Disease, when attained, shouldpermitthe realization of the overall National goals setdown in theSurgeon General's report.The objectives are the result of a year long effort involv-ing more than 500 individuals and organizations from boththe private anti governmental sectors. First drafts weredrawn up by 167 invited experts at a conference held inAtlanta, Georgia, on June 13 and 14, 1979, sponsored bythethen tlepartment of Health, Education, and Welfare.The conference, organized into work groups for the 15subject areas, was a joint effort of the Center for DiseaseControl and the Health Resources Administration, coordi-nated by the Office of Disease Prevention andealth Pro-motion of the Office of the Assistant Secretary for Health.An invitation for public comment on these draftspublished in the Federal Register and the volume conting them was also circulated widely tlpeople and agencies.concerned with the various. subjectlf During the fall of1979 the objectives and reports were revised according tothe suggestions received. In early 1980 the revised objec-tives were circulated within the Department of Health andHuman Services, to other relevant Federal agencies, andto Atlanta conference work group chairpersons to elicitfurther com ent. Final revisions were made in the springof 1980.Because t the process received such a substantial con-tribution from the 1979 Atlanta conference,itmeritsspecial note. The conference participants and invited ob-servers were all knowledgeable about some aspect of riskreducing actions that can improve the opportunities for'''health. The chaiipersons and members of each of the 15work groups were expressly selected tooprovide a mix ofbackgrounds. which coup bring to the task not only tech-nical expertise andItonsumer and professional viewpoints,but also practical experience with planning and programimplementation. Thus, participants were drawn -.tom avariety of affiliationsproviders, academic centers,and local health agencies, voluntary health associations,and many others.To facilitate the discussions, each work group memberreceived .a draft background paper, prepared by staff ofan I-ItW office with ptogram responsibility in therelevantprevention activity. OtherHEW activities in setting goalsand standards for prevention were taken into account bothin the background papers and in work group discussions,paiticularly the National Health Planning Goals called forby Section 1501 of P.L. 93 -641, presently under develop-. went by the HealthResources Administration, and theModel Standards, for Community Preventive Health Serv-ices ,Called for by Stxtion 314 of P.L., 95-83, whose1 development was coordinated by the Center for DiseaseControl.'While theofijectiveswere developed under PublicHealth Service iponsorship, and are consistent with Fed-eral policies, they are far wider in purpose and scope. Theyare intended to be Nationalnot Federalobjectives.Torealize the potential for reducing the rates of prematuredeath and disab4ity to the levels set forth here requiresa truly National commitment, including, but going farbeyond, that of government.To achieve these objectives demands actions'by Ameri-cans in all walks of life, in their roles as concerned indi-viduals, parents, and as citizens of their Nation and ofStates and local communities. Sustained interest and actionis required not only by physicians and other health pro-fessionals, but also by in

4 dustry and labor, by voluntaryhealthasso
dustry and labor, by voluntaryhealthassociations,schools,churches,and consumergroups, by health planners, and by legislators and publicofficials in health departments and in other agencies oflocal and State governments and at the Federal level.While the diagnosis and treatment of disease are theprimary responsibility of health professionals and healthorganizations, actions to reduce the risks of disease orinjury extend far beyond health services per se. The rangeof preventive activities is broad. Included are key preven-tiveservices, such as immunization, delivered to indi-viduals by physicians, nurses, other health professionals,and trained allied health workers. Also important arestandards, volunlary agreements, laws and regulations,such as engineering standards, safety regulations and toxicagent conr; to protect people from haiards to health intheir living, travel and workirig environments. In addition,'and perhaps most important for today's health threats,there are activities that individuals may take voluntarilyto promote healthier habits of living and activities thatemployers and communities may take to encourage them.This document is designed for the use of leadership inthe wide range of private and public sector organization'swith important roles in these various areas. At a time inthe Station's history when budgets become ever tighter,legislators, public officials and governing boards of indus-try, foundations, universities and voluntary agencies arebeginning to re-examine their traditional bases for allo-cating their limited health-related resources. It is antici-pated that in the years to come policy makers will be ableto use the objectives in this volume to track the Nation'ssuccesses or failures in prevention.The ReportsEach of the reports focuses on one of the 15 preventionareas and is presented in a standard tbrmat allowing areview of:the nature and extent of the problem, includinghealth implications, status and trends;*Readers who want to place disease prevention priorities in theperspective of overall national ,health policy should refer to thedraft Nattonal Health Planning Goals, forthcoming from theHealth Resources Administration which address broad healthstatus and health system considerations Readers who want morespecifics on how to put prevention measures to work are referredto Model Standards for Community Preventive Health' Services,issuedin1979- by the Center for Disease Control.prevention/promotion' measures illustrativeof ap-proacheseducation and information, services,technology, legislation and regulation, and economicincentive's, followed by observations on the relativestrength of these measures;specific national objectives for:improved health statusreduted riskfactorsimproved public/professional awarenessimproved services/protectionimproved surveillance/eValuation;the principal assumptions that underlie the fr' of the objectives;the data necessary for tracking progress.LingDiscussion of the objectives is limited to some extent bythe need to distill often comprehensive and complex issuesinto a short outline form as well as by limitations in theknowledge base. In some instances, for example, it is notpossible to relate the magnitude of a targefed-problem toa specific disease incidencee.g., the prevalence of a par-ticular carcinogen in the environment to an identifiablelevel of cancer incidence. Also,.the discussions of thevarious intervention *measures are offered principally aschecklists rather than as detailed blueprints with appro-'priate sequencing carefullyestablished 'and presented.They do nefnecessany reflect Federal policyrather theyrepresent a broader range_.of possible measures availablethroughout the public

5 and private sectors.But these limitation
and private sectors.But these limitations are dictated by the character of theexisting data, as well as the necessity to tailor efforts tolocal conditions. Given these considerations, the discus-sions provide a concise review of the central issues rele-vant to each area.,With respecttotheobjectivesthemselves,certainpremises are inherent. First, the stated objectives shouldreflect a careful balancing of potentials for benefits andharm to the individuals or populations concerned. Second,specific actions suggested should be in line with profes-sional consensus on likely efficacy of the action. Third,confinued.biomedical, epidemiological and behavioral sci-ence research, and systematic evaluation will resultinimproved judgments.The objectives food on interactions and supports de-signed primarily for well people; to reduce their risks ofbecoming ill or injured at some future date. Thus, few ofthe 'objectives deal with secondary prevention. Objectivesrelating to the frequency and content of physical exami-nations and other means of 'detecting early conditibns(such as cervical, breast and colon cancer, diabetes, visionand hearing problems and dental caries) were deliberatelyexcluded from consideration, despite their obviousim-portance in signaling needs for intervention.Finally, an attempt has been made to confine objectivesto what might feasibly be attained during the comingdecade, assuming neither major breakthroughs in preven-tion technology, ,nor massive infusions of new ,Federalspending. For example, the goal for irifint health is toreduce the infant mortality rate to no more than19 deathsper 1,000 live births. In thaory the Nation should be ableto do much better. Several areas in western Europe, andcertain political jurisdictions within the United States244 I alteady have achieved rates'ofi5 ,p;r 1,000. Yet, the sizeof the gaps that presently exist between the risks experi-enced by pregnant women in different age, ethnic andincome groups of the population, and the limited resourcesthat now appear likely to become available to narrow thosegaps make 9 per 1,000 a more realistic objective.la sum, the objectives were framed in the context ofcurrent knowledge and the current aggregate level of pub-lic and-,private resources for the15 prevention areas.While this parameter was not adhered to in every instance,it promoted a greater measure of restraintor realismon the process.No effort has been made to establish priorities amongthe 15 areas, or even among the various objectives withinanygiyen area. Gjven the nature of our pluralistic societyand the diversity of regional and local needS'and capabil-ities, boticthe setting of priorities and the choice of pro-gram direction are bestleftto those responsible forplanning,coordinating,andimplementingpreventionstrategiesnamely State and local health agencies, Statehealth planning and development agencies, health systemagencies, afia-governing boards of the wide range of pri-vate sector organizations involved.It is important to note that some themes can be identi-fied which group the activities of the 15 areas into sub-categories with common elements. "Substanceabuse," forexample, links the areas of smoking and health and misuseof alcohol and drugs Common elements in these areas11.include questions of addictive properies, neurochemicalaction, long-term gequelae, age-relatedvulnerability, ef-fectiveness of primary and secondary prevention measures,and ethical issues attendant to behavior dhange. Each ofthese issues should 'be considered not only on its ownmerit, btit also for its lesso'ns for, and commonalities with,the other abusive behaviors. Another example is the themeof "reproductive health." Family planning,

6 pregnancy andinfant health, and sexually
pregnancy andinfant health, and sexually transmitted diseases are,ofcourse, all concerned with reproductive health,but ele-ments are also found in the discgssions ofsmoking andhealth, misuse 'of alcohol and drugs, nutrijidn, toxic agentcontro1,2ccupational safety and health, and immunization.Approghes to ensuring positive results of human repro-ductive processes compel consideration of issues of sexualattitudes and behavior, understanding of fertility and infer-'tility, decisions about pregnancy, activities and exposuresring pregnancy, 'obstetrical services, and follow-up careof mother and infant. All are important factors in repro-duction; central concerns of mueh of reproductivelife.Considering the spectrum of issues in ffiFiggregate, ratherthan a series of isolated events, has substantial merit.,.Because such collective themes can be important to theimplementation of measures to address the identified ob-jectives, program directors designing- such measures andsetting priorities should search for the common elementsparticularly germane to their program needs and resources.Crosscutting IssuesA number of issues are common to most or all ofthereports: the problem of developing objectivesin the laceof economic uncertainties, a rapidly changing scienceVase,the needs for more research and data, unpredictableshifts3in popular interests and values, trade-offs, between healthand other societal interests, and ethical considerations inattempts to influence changes in people's customary habits.Two are discussed below: data requirements and researchneeds.Data requirements--The most salient common fea-ture across the 15 areas is the need for better databoth to profile current status and to track progresstowards the established objectives. Statistical analyses,"derived from reliable data, continuously reported andcoded according to universally accepted definitionsand conventions, are the sine qua non for establish-ing thte true nature of the problems preventive meas-sures ,should address, as well as for charting trendstowards achieving the objectives. There is currentlygreat variability in the depth and reliability of dataavailable among the 15 areas. While statistical reportsrelevant to the problem of smoking are quite com-plete, virtually no data exist to estimate the problemof unmanaged stress in the population, and its asso-ciation with mental illness, cardiovascular disease orvioleht behavior.In some cases, the availability of baseline data andability to track progress have been relalively moreprominent than overall importance to health in shap-ing the nature of objectives, The paucity -of data isparticularly handicapping for State and local organi-zations and agencies seeking to set and track progresstoward their own local priorities and objectives forprevention. For the most part, birth and death sta-tistics and local hospital discharge abstract analysesremain their only guides. Results from the continu-ing National surveys, such as the Health InterviewSurvey (HIS) ai2d the Health and Nutrition Exami-nation Survey (HANES), while essential for trackingchange' in the United States population as a whole,are based on samples too small to permit analysisapplicable to small areas.Surveillance systems developed to monitor the'oc-currence of infectious diseases provide models fbrmany of the specific objectives relating to the pre-vention of other types of diseases and injuries. Theydepend on systems through which the occurrence ofthe particular condition or action will be reportedwithin some ascertainable limits of accuracy andcompleteness. Whatever the source of the necessarydataphysicians, hospitals, highway patrols, or in-surance claim-systemsimportant issu

7 es concerningthe quality of the data mus
es concerningthe quality of the data must be addressed. Using datafrom surveillance systems which are not based onprobability sample designs, or which are based onvoluntary reporting, carries risks in making Nationalestimates for trackingbjectives. 1 he level of volun-tary reporting may dir markedly from one localarea to another and fluuates unpredictably at dif-ferent points in time.Scientific evaluation of l e impact of risk reduc-tion on trends in health status or in reduction of riskfactors is difficult methodologically and collection ofthe data requiredis expensive. To obtain valid results,test and control populations of considerable size must beiollowed over Considerable periods of time, and amultiplicity of variables must be systematically takeninto _accou n tWe anticipate considerable improvements will bemade in our data capabilities over the next decade.New methods now .being developed will help Saehealth planning agencies, health systen1 agencies andhealth departments use existing data more effectivelyto establish base lines orpreventicrnneedi'and oppor-tunities. New efforts are underway to target newsubjects for National data collecticin efforts. By 1990the Nation should have a considerably improved datacollection network and therefore be able to assessthe progress with greater reliability as well as toestablish new priorities based on new knowledge.Research needsThe development of realistic objec-tives for risk reduction obviously must take placewithin the framewlrk of whatever scientific knowl-edge is currently available. Since for most areas thestate of the artis constantly changing, developingobjectives for a point in time ten years down the roadoften means shooting at a moving target. For ex-ample, when the initial section on high blood pressurewas drafted in June '1979, uncertainty about theefficacy of unervention in cases where blood pressurewassonly slightly elevated (90 to 104 mm Hg diastolicblood pressure without complications) led the workgroup to caution that in such cases: "..interven-tion..is not yet of clearly proven benefit." Tenmonths later, based on the results of a National studysponsored by the National Heurt, \ Lung and BloodInstitute, the statement was revised to read: "Basedon 1979 research results, intervention seems war-ranted in a large proportion of this population."If the objectives developed are to be refined ?hadimproved, the continuing need for basic- biomedicalresearch in most of the 15 subject areas of preven-tion is clear. Were our understanding of biologicalprocesses sufficient to develop vaccines to protectindividuals against the most prevalent sexually trans-mitted diseases, tremendous opportunities for preven-tion would unfold and the task would become mucheasier.Similarly,epidemiologicaland biomedicalresearch to identify major health risks from exposuresto toxic agents is fundamentally important. We neednew technologies to aid prevention in many- areasthe development of acceptable, reversible, male con-traceptives, for instancW/lany of these issues havebeen addressed in the process of establishing Nationalresearch principles, directed by the National Insti-tutes of Health.Additionally, behavioral research is needed to learnthe basis for such addictions as smoking, overeating,and dependence on alcohol and drugs. Research. atthe interface between biomedical 'and behavioralmethodologies is' required to advance our knowledgeof the effects bf stress on health, and of how tocontrol them.Social science research is needed to find more effec-tive ways to communicate to vulnerable and inac-cessible populations, such prevention techniques as4lifestyle change measures to reduce their percentageof low birth we

8 ight, high risk infants; Health services
ight, high risk infants; Health servicesresearch is required to learn how to maintain adher.ence to health promotion measures Aver long, timeperiods, such as high blood pressure contr2I regimensand maintaining a balanee between energf input fromfood and output from exercise. Cost activenessstudies, too, could identify preferred measures insome areas of prevention, despite the difficulties al-ready noted in defining the associated costs :audbenefi4 that limit the applicability ofsucrh analysisto many prevention activities.Finally, legal and public policy research is'Oalledfor in many areas of prevention, so that questichis ofindMdual and collective rights and 'responsibilities,and of trade-offs between economic and healthvalues, and of short run versus long run benefits canbe systematically introduced into public debates..ImplementationImplementation of the objectives for each of _the 15areas requirei a pluralistic prOcess involving public andprivate participants from many sectors and backgrounds.Health officials and health providers must.be joined byemployerl, labor unions, community leaders, school teach-ers, communications executives, architects and engineers,and many others in efforts to prevent disease and prothdlehealth. It is important to emphasize that,. while the FederalGovernment must bear responsibility for leading, catalyz-ing and providing strategic support for these activities,theeffort must be collective and it"must have local roots.Accordingly, the objectives contained in this volumemust be viewed dynamically. They ought not to be con-sidered rigid-obligations, but as, useful National guidepoststo be altered to fit local conditions, or as our Vvel ofunderstanding of the problems at hand changes. There willbe controversy. Issues often .raised in connection with theadvocacy and adoption of prevention measures include:the appropriate role of government in fostering personalbehavior change; the philosophy and psycliplogy of throw-ing responsibility for serious health problems baek to thevictim; the role of husiness and industrig prcfesies inhealth and disease; the prefereptial treatment- of certaincategories of people for insurance purposes; the role ofgovernment in regulating health privection measures..Despite such questions, the objectives presented in Pro-moting Health/Preventing Disease represent an importantcomponent of a focused Nvional prevention strategy.Substantial gains to the health of Americans can be at-,tained if we have the Will to applvyha we know. Fromthe Federal. perspective; work is already under way toapply the, capabilities of FederAlly sponsored programs tothe agenda set forth. If -similar efforts are undertaken atthe State and local leyels to delgign measures for imple-menting locally-based objectives, progress can be greatlyfacilitated. To draw upon the last line of Healthy People,"If the commitment is made at every Tevel, we ought toattain the goals established in this report, and Americanswho might otherwise have suffered disease and disabilityfill instead behlithypeople." 4HIGH BLOOD PRESSURE CONTROL.-?qgc)1. Nature and Extent of the problemHighlood pressure is perhaps the most potent of therisk factor's for coonary heart disease and strokeand contributes as well to diseases of the kidney andeyes. Because it is asymptomatic, a large number ofpeople are unam,NIPre of their condition. High bloodpressure is, however, only one of several risk factorsfor heart disease and stroke. Other prominent factorsfor heart disease include cigarette smoking, elevatedblood cholesterol levels, diabetes and obesity. It isessential to recognize the multiple nature of these risksand their proved or suspected interaction. Correspo

9 nd-ingly, both health prOfessionals and
nd-ingly, both health prOfessionals and the public need toknow moret approaches for dealing compre-hensively witse multiple risk factors and how toact on the baof this knowledge. Control of highblood prdssare requires patients to adhere to regimensover their lifetime. These may include variouscombi-nations of pharmaceutical interventions and changes indiet, exercise and stress management practices. (SeeSmoking and HeaJ, Niztriti n, Physical Fitness andExercise, and Cont761 of-Stres and Violent Behavior.)a.Health implications/Heart disease, the leading cause of death in theU.S.population,wasresponsibleforover700,000 deaths in 1977; stroke led to 183,000deaths in that year. Survivors 'are often severelyhandicapped.About 60 million people have elevated bloodpressures (above 140/90) and are at increased.risk for death and illness.Of these, about 35 million people (15 percentof the U.S. population) have high blood pressureat, or above 160/95, which is the World HealthOrganization definite determination of hyper-tension. These people face excess risk of deathor illness from heart attack, heartfailure, stroke,and kidney failure, and are the primary targets-for c ntrol efforts.Much of this excess risk is attributable to mildhigh blood pressure (90 to 104 mm Hg diastolicblood pressure without complications). Basedon 1979 researchresults, inierv.ention seemswarranted in a large proportion of this popu-lation.).Other important risk groups are: persons with,diastolic blood pressure over 104 (for whomdrugs have been proven beneficial); populationshaving a high prevalence (e.g., blacks and elder-.,5Ncy); pe'rsons with limited, access to, or use of,edical care such as young men and the poor.Among special issues are the growing proportionof elderly in the popula 'on, their high preva-lence, of high blood pressuuncertainty aboutthe benefit of treating isolatsystolic bloodpressure and the sometimes u predictable sideeffects of drugs used to eontroligh blood pres-sure in older people.Children present an opportunity,since pre-cursors ofhigh blood pressure may be identifiedin them, but also present a dilemma as thebenefit of early intervention in this population isnot known and' a firm consensus on defininghigh blood, pressure in yOungsters has not yetbeen reached. Changes in habitual diet mayprove useful in prevention.b.Status and trendsAlthough blood pressure can be controlled, thespecific cause of 90 to 95 percent of high bloodpressure is not knowrhus, while short-tormemphasis must45e placed on control, increasedunderstanding of the causes of hypertensionmust be pursued to enable prevention of highblood pressure in the long run.High salt intake is associated with high bloodpressure in susceptible people; reduced salt in-take is one measure for reducing high bloodpressure.Many successful approaches to detection -andcontrol(e.g.; use of allied health personnel,wolksite care, patient tracking systems) are notyet widely adopted or integrated into main-stream care.Although prevalence data indicate a problem ofgreat magnitude, incidence data for high bloodpressure and its complications do not exist toaid improved planning of intervention strategiesfor both primary and secondary prevention.,leen are only half as likely as women to havetheir high blood pressure controlled.Rural (non-SMSA) areas and urban inner cityareas have Made less progress in high bloodpressure control in recent years than hav4etro-politan areas.Many health professionals are inattentivetoregimen adherence issues and lack skills to dealwith adhererice.School hehlth education rarely addressesrisk- factor control and lifestyle impact on health ina satisfactory way.-The proportion of the population with h

10 ighblood pressure who are aware of their
ighblood pressure who are aware of their condition.and are successfully controlling itappears tohave ,doubled in the la I 5 years, while the pro-portion of this popula on who are unaware of4 their condition has'sharply decreased. However,the proportion who are aware of their condition,but "whose high blood pressure remains un,treated or uncontrolled, appears to have stayedconstant.,4.2. Prevention/Promotion Measures,a.Potential measuresEducation and information measures include:continuing current efforts to heighten pro-fessional and public awareness of possibil-ities for blood pressure control, with mes-sages ttrgeted to groups at special risk, suchas black males, the elderly and users of oralcontraceptives;informing the public that daily intake of over5 grams of total salt (2 grams sodium) isnot essential for good health and may con-tribute to the :development of high bloodpressure in some people;.developing and distributing palatable recipesfor low sodium diets;raisingpublic awarenessthatoverweightpredisposestohigh blood pressure andweight control often assists blood pressurecontrol; avoidance of juvenileobesityisespecially important;encouraging increased physical activity andunderstanding that maintaining an appropri-ate balance between the energy individualsexpend in their daily physical activity andthe amount of energy they consume throughthe food they eat deteipines their success incontrolling weight;increasing public awareness of the fa& thatstress' reduction and exercise may be usefuljuncts for some persons to provide aealthy lifestyle and lessen the risk of hyper-te sion;,-,4increasing public awareness of multiple. riskfactors and the interaction of risk factors;alerting physicians on value of monitoringthe children of hypertensives wilh`attentionto weight control and low salt intake;increasing professional schooltraining inbehavioral/motivation skills;-involving specialists in behavioral medicinein teaching programs and assisting in patientadherence to regimens;..encouraging introduction/inclusionofhealth-related content into the curricula ofpublic/private institutions which train food.preparation/processing personnel;fo.more active nutrition education in schoolhealth and lunch programs fdr school chil-dren and for the elderly;influencing industry to take active steps topromote high blood pressure control/pre-vention among its employees and throughoutthe Nation by changes in both products(primarily reduced sodium content of proc-essed foods) and marketing approaches;increasing awareness by employers and thepublic of the potential for insurance prem-ium cast savingi associated with blood pres--sure control, not smoking and weight controlamong individual and group policy pur-chasers.Service measures include:providing blood pressure checks routinely at,contact with health providers (e g., physi-cians,dentists,nursepractitioners)andthrough programs staffed by suitably trainednon-professionals (e.g., firemen);providing high blood pressure .detectlon'and'treatment servicesat the worksite with wsystematic program for follow -up;giving health providers instruction in tech-.niques to improve patientadherencetoblood pressure control rekimens.Technologic measures include:increasing use of systems/policyanalysismethods iikrogram planning at all levels;reducing fat. content (caloric density) andsodium content of snack and highly proc-essed foods;developing practical means to supply lowsodium content water to populations living.in "hard" water areas.Legislative and regulatory measures include:promoting knsumer choice through labelingof foods for sodium and caloric content;seeking' unifdrm National guidelines andFederalagency(NationalInstitutesofHeal

11 th, Department ofAgriculture,andFobd and
th, Department ofAgriculture,andFobd and Drug Administration) policies fornutrition(e.g., sodium consumption, tbtaldietary fat content);modifying State practice acts to provide forexpanded roles of allied health professionalsin the management/cOntrol of high bloodpressure.Economic measures include:providing free or low cost access to bloodpressure checks during intervals betweenphysician examinations;reducing economic barriers (e.g., reimburse-ment, training 'costs) to use of allied healthpersonnel;providing industry with tax incentives to en-6X1.1 courage development, of lower calorie, fat,sodium-containing foodstuffs;reducingeconomicbarriers , tocontrolthrough reimbursement for antihypertensionprescription- drugs.b.Relative strength of the measures,,,Education and information measures:established impact; low technology imple-mentation possiblei wide acceptance of_thisapproach now exists; excellent cost/effectivepotential.Service measures:effective with potential for significant impact.1Technologic measures:we of systems analysis approach, toplanningto facilitate more comprehensive/objectiveprobleth analysis resulting in more effectiveplans;food content changes to allow greater con-sumer choice; may influence a major sourceof calorie self-abuse, and could be especiallyrelevant to school children among whomadverse eating patterns have lasting effects.Legislative and regulatory measures:not well evaluated as a behavioraltool,slow to achieve results.Economic measures:.difficult to achieve but usually effective whenaccomplished.3. Specific Objectives for 1990 orEarlierImproved health statusBy-1990, at least 60 perceht of the estimatedpopulation having definite high blobd pressureAO'(160/95) should have attained successful longterm blood pressure control, i.e., a. blood pres-sure at or below 140/90 for two or moreyears.(High blood pressure control rates vary amongcommunities and States, with the range generallybeing from 25 to 6b percent based on currentdata.)Reduced risk factorsb. By 1990, the average daily sodiumingestion (asmeasured by excretion) for adults. shouldbereduced at least to the 3 to 6 gram range.(In1979, estimates ranged between averages of 4to 10 grams sodium. One gram saltprovides ap-proximately..4 grams sodium.)By 1990, the prevalence of significant over-weight (120 percent of "desired" weight) among.the U.S. adult population should bedecreasedto 10 percent of men and 17 percentof women,without nutritional impairment. (In 1971-74,14 percent of adult men and 24 percentofwomen were more than 120 percentof "de-sired" weight.).NOTE: Same objectives as for Nutrition.12Increased public/professional. awarenessd.By 1990, at least 50 percent of adqlts should beabletostatetheprincipal riskfactors- forcoronary heart disease and stroke,i.e., highbloodpressure,cigarettesmoking,elevatech-blood cholesterol levels, diabitel (13aseline dataunavailable.)e.By 1990, at least 90 percent of adultsshould beAble to state whether their ,current blood pres-sure is normal (below 140/90) orelevated,based on a reading taken at the most recent visitto a medical qr -dental professional orother.trained reader. (In 1971-74, 55 percent ofpeople with high blood pressure greater than160/95 were not aware of their condition.) 4Improved services/protectionf.By 1990, no geopoliticalStates should be without angram td identify persons wsure and to follow up on theiline deta'unavailable.)By 1985, at least 50 percentsold in grocery stores should' form the consumer of sodiug.rea of the Unitedffective Public pro-high blood pres-treatment. (Base-f processed foodbe labeled to in-and caloric con-tent,. employing understandable,standardized,quantitative terms, (In 1979, labeling f

12 or sodiumwas rare; 'the ,extent of calor
or sodiumwas rare; 'the ,extent of calorielabeling wasabout 50 percent in the market place.)See Nutrition...Improved surveillance /evaluation systemsh.By 1985, a system shOuld be developed to de-termine,the incidence of high blood pressure,coronary heart di ease, congestiveheart failureand hemorrhagic and occlusive strokes. Afterdemonstrated feasibility, by 1990 ongoing setsof these data should be developed.i.Bx 1985, a methodology should,be developed toassess categories of high blood pressure control,and a National baseline study of thisstatusshould be completed. Five categories are sug-gested:(1) Unaware; (2) Aware, not undercare; (3) Aware,- under care, nocontrolled;(4) Aware, under care, controlled; and (5)Aware,monitored without therapy.4? Principal AssumptionsThe etiology of high blood pressure is multifactorialand .no research breakthrough will' eliminate it as apublic health problem in the next decade.The basic components of successful control pro-grams willto be ,detection, evaluation,treatment and/or changes in lifestyle, andfollow-up.While. there are still some uncertainties about tquantitative relationship between sodium ingest'and high blood pressure, itis importanti, to beginmoving in the direction suggested by, the data.While there is not yet 4 true con,sensus as to whatconstitutes dangerous levels of .overweight Tor thepopulation as a Whole, the stated targets provide thepattern for a productive trend.o 4),cA,Governinental efforts to control high blood pressurewill be contrived and expanded."Voluntary and private sector efforts'to control highbrood pressure will be continued and extlitiideil..--Hetilt14Systems Agencies will give high priority tohigh blOod, pressure detectlt?p, treatment and con-'trol.Implementation of the smokiiig, nutrition, and phys-ica activity recommendations (see appropriate_set-tis) will impact favorably on the prevention andOntrol of high blOod pressure.,.Data Sources',a.To National level onlyHealthandNutritionExaminationSuryey(HANES). Prevalence of hypertension by de-mographic characteristics; blood pressure distri-butions; some .data on awareness and controlstatus. DHHS-National Center for Health Sans-"'tics (NCHS). NCHSVital and Health Sta-tistics, Series11, selected reports, especiakr No.203, andAdvance Data from Vital and HealthStatistics,selected.reports.Periodic Nationalsurveys, obtaining data Irom physicar examina-tions, clinical and laboratory tests and relatedmeasurement procechges on National probabil-ity sample of thenoninstitiltronal-ized population. Data on adults currently Evan-able from the 1960-1962 Health ExaminationSurvey and the 1971-1974 HANES. 1971-1975data are expected during 1980,1976-190 datanot yet available.Health' Interview Survey (HIS). Interviewetire-ported data on prevalence of hypertension bydemographic characteristics, disability days as-sociated with high blood pressure therapy andregimen adherence, and other related topics.DHHS-NCHS, NCHSVital and Health Statis-.tics, Series 10, selected 'reports, especially No.121,and Advance Data from Vital and HealthStatistics. Continuinghousehold interview healthsurvey; National probability samples of the U.S.civilian noninstitutionalized population. Specialsurvey on hypertension conductedlin 1974. Dataon hypertension available from the 1972 and1978 HIS will be publisharin the 1979 and1980 survey reports.National Ambulatory Medical CareSUrvey(NAMCS). Patient visits to office -based privatepractice physicians in the U.S. by patient andphysician characteristi6s, diagnosis(inclUding.high blood'pressure and_ its sequelae), patient'sreasonforthevisit,andservices provided.,DHHS-NCHS. NCHSVital and Health Statis-tics,Series .13, selected repo

13 rts andAdvanceData from Vital and gealti
rts andAdvanceData from Vital and gealtit Statistics. Continu-ingsurvey, since1973; National probabilitysample of office-based physicians.Hospital Discharge Survey(HDS).Patient slaysin short-teini hospitals, by patient characteris-e4,tics, diagnosis (including high blood pressureand its sequelae), survey and other procedures.DHR NCHS. NCHSVital and Health Statis-tics,eries 13, selected reports. Continuing sur-vey,_si ce 1965; data from discharge recordg ofsamples of patients in a National probabilitysample of general and special short stay* hos-pitajs.NationseandTherapeutic; Index(NDTatievisits to office-based privatepractice phySici nsiii -the United States bypatient and ph sician characteristics, type ofvisit, diagnosis (including high blood pressureaoeits sequelae), whether blood pressure Wasmeasured and actual measurement and'prescrib-ing behavior of the physician. IMS America4Ltd., Ambler, Peikniylvania. Regular 'reportsfrom IMS, pia' specially requested computertabulations.- Continuing survey from a repre--sentative sample panel of physicians in privatepractice. Blood pressure measurements availableonly since 1976.National Prescription'Audit (NPA).:Drttg-sales(inclurding hypertensive drugs), sourof pre-scription, payment status and _prescriber type.IMS America, Ltd., Ambler, Pennsylvania. IMSreports. Continuing audit of pharmacies on IMSpanel.Physician response to high' blood pressure diag-nosis. Physicians' knowledge, attitudes and be-havior toward high blood pressure; perceivedimportance of high blood pressure diagnosis and-tventmentpraOcesSurveysconductedforDHHS-Food and Drug Administration (FDA)and the National High Blood Pressure Educa-tionProgram (NHBPEP), National' Heart,,Lung, and Blood Institute (NHLBI), National "Institutes of Health.. DHHS Publication No.(NIH) 79-1056,Diagnosis and Management ofHypertension: A Nationwide, Survey of PhysiI,clans' Knowledge, Attitudes'and Reported 1 e-,havior. National survey 1977; follow-up santicipated.The public's view of high blood pressure., Publicknowledge, attitudes and reporte&behavior to-wards high blood pressure. ,Surveys conductedfor NHBPEP-NHLBI, .NationalInstitutesofHealth. DHHS Publication No. (NIH) 91-356(1973 survey),The Public and High BloodPressure: 4 Survey. 1979 surveyto be pub-lished. Periodic surveys; National probabilitysample of the U.S.adult population._Hypertension Detection and Follow Up Pro-gram. State of knowledge among persons ofrisk of 'coronary and vascular diseases.- DHHS-NHLBI. NHLBI', (NIH)Hypertension TaskForce Reports,Nos. 8 and 9. One time survey.b. To State and/or local leiel,1National Vital Registration SystemMortality. Deaths by cause, including hyper- tension and hypertension-related sequelae,by age, a[ and race. DHHS-NCHS. NCHStVital Statistics *the United States, Vol. II,and NCHS Monthly Vital Statistics ,Reports'WContinuing reporting. from States; National'full count. (Many States issue earlier re-ports.)Hospitalized illness discharge abstract systemsProfessional -Activities Study (PAS). Pa- ittients in short stay hospitals; patient charac-teristics,diagnosesofhypertensionandhypertension,- relatedsequelae,proceduresperformed, length of stays. Commission onryProfessional and Hospital Activities, AnnArbor, Michigan. Annual reports and tapes.Continuous reporting from 1900 CPHAmember hospitals. Not a probability sample;extent of hospital participation varies byState.Medicare hospital patient reporting system0Cl".91O(MEDPAR). Characteristics of Medicarepatients, diagnosis, procedures by hospitals,HSA Areas. DHHS- Health Care FinancingAdministration, Office of Research, Demon-stration and Statistics (ORDS). Periodicreports 19.75, 1976, 1977. Continiiing re-.po

14 rting from hospital claim data, 20 perce
rting from hospital claim data, 20 percentsample.Other hospital discharge systems as locallyavailable.Selected health data. DHHS-NCHS. NCHS Sta-tistical-Notes for Health Planners. Compilationand analysis of data to State level.Area ResourceFile(ARF). Demographic,health facility and manpower data at State andcountylevelfrom various sources. DHHS-;Health Resources Administration, Area Re-source File. A Manpower Planning and Re-search Tool, DHHSHRA-80-4, Oct 79. Onetime compilation..1r FAMILY PLANNINGiisture and Extent of theProbleois..4Family planning is based on' the voluntary decisionsand actions c4 individuals. Its purpose is to enableindividualsto,'ake their .'own decisions regardingreproduction and to implement theirodecisions. Familyplanning incles me sures both to preventunintendedfertility and to ounintended infertility.Health icatiens,Family planning is at, preventive health measurewhich supports:,tmaternal and infatit health;the emotional and social health of indi-viduals and the family.Pregnancies among teenagers, among womenWho are pnmarried, among women over the ageof 34. and among high parity women are all asso-ciated with higher than average rates of ma-ternand/or infant morbidity and mortality.Ther are also more likely than other pregnanciesto be .unintended and unwanted.Compared to pregnandies carried by Women inthe most favorable childbearing years, teenageOregnancies are aSsociatid with markedly in-creased risks of maternarrinorbidity andmortal--ity and of.premature and other low birthweightinfants whoThave reduced chances of survivinginfancy and high rates of serious neurologicalimpairmentsAdolescent motherhood is assoeiatetd with great-, errisk of lowered educational and occupationalattainment, reduced income(and increased like-lihood of welfare dependency.Unwanted pregnancies impose psychological and-social costs that often continuethroughoutzte%\"lifetimes of the mother and the cliff*.b. Stabi and treadsIn 1978, about 545,000 babies were born tounmarried American wemen, almost half ofwhcb were teenagers.'. Although fertility ratesfor teenagers are declin-ing in the United States,, the rates continue toexceed those in more than a dozendevelopedcountries. Both, the birth ,rate andthe numberof births for unmarried women areincreasing;unmarried, mothers are m_ose likely to havebe-gun prenatal care lateinpregnancy and tohave made fewer 'prenatal visitsthan married349-256 0 - S-II1110.a- mothers; infantsborn to single mothers are more- likely to have a low birthweight.Ten percent of babies born to married Americanwomen between 19734976 resultedfrom con-ceptions the mothers wished had never hap-1)ened. Ary additional- 25 percent resulted frompregnancies which the mothers wanted to havesome time in the future but which-occurred tooearly in their lives.-Certain su'bgroups of our population 'have dis-proportionately high risks 'of unintended, preg-nancyand childbearing. Examples include:wunplannet births are almost twice as fre-quent in poor as compared to nonpoor fami-lies (52 percent of births that occurred dur-ing the previous five years were unplanned asreported in 1976 by women with fatnily ip-comes below the poverty 'level, compared. to 29.2 percent for women with ,family' in-comes of 150 p.ercetilheoverty level orhigher);reports of black women in a 1973 surveythat one of every four of their births hadbeen unintended, versus reports by white.women that only one of every 10 oftheirbirths hie theen unintended;high rates of unintended pregnancy amongteenagers, women with language barriersand/or illegal immigration status,' womenliving in rural areas on on Indian reserva-tions and members of some religious groups:More than a million

15 American women havepregnancies terminate
American women havepregnancies terminated by abortion every year.The teenage population accounts for ap'roxi-mately one-third, of these abortions:The risk of ;death associated with temporarymethods of contraceptions)sterilization andlegal abortion isless than the risk of deathfrop childbearing, alth'ough the absolute num-bers of deaths are about equal.Marry deaths associated with mePods of con-traception are preventable, including those asso-dated with:smoking by women who use oral contracep-tives;.oral contraceptives with unnecessarilyhighestrogen content;legal abortions performed after the firsttrimester of ptegnancy; illegal abortion.4 The psychologicaland biologic bases and underf(.lying causes of a large proportion of infertilitycases are not understood and/or are not e-mediable by medical treatment. Those treat-ments which are available technically are costlyand are largely inaccessible to the poor.2. Preientism/PromotiodMeasuresa.Potential measuresdEducatiou and information measures incltiae;providing content on human sexuality, re-production, family planning and parentingin the curricula of schools which train per-sonnel for delivery of human servicesprofessionalschoolsforsocial :workers,clergy, nurses, nurse practitioners, teachers,counselors, pharmacists and -physicians);pyviding content on human sexuality,, re=production and contraception within Con-tinuing education programs for graduatelevel professionals involved in human serv-ices;incorporatingintoelementaryandhighschool educational programs a family lifecurriculum which include human sekuality,',reproduction, contraception and parentingas well as approaches to decision-makingandvaluesclarification"offeringparentsopportunities to participate in parallel pro-grams;4.!Pusing a variety of approaches , to informteenagers about prescription and nonfie-scription contraceptives, including hove theywork, their relative effectiveness, how/to usethem effectively, their availability and host;educating parents to provide effective andaccurate sex education to their children;,encouraging and assisting the public mediato educatethepublic,especially parentsand young people, about the realities andpossible problems of unwanted pregnancies,and to.present appropriate role rnadels forteenagers;"using the public media as appropriate foradvertisements explaining the use, cost andbenefits of certain over-the-counter, contra-.ceptives;111751131 g the knowledge of family plan-ning clinicians regarding the relative risksand effectivenessofallfamilyplanning,.methodsandoflifestylecharacteristid. which may place certainindividuals at in-creasedriskmorecomplicationsassociatedmwith one orore specific methods, such assmoking by users of oral contrfeption;upgrading the .counseling skills of individ-uals who work in health care settings whichr.b.f.serve adolescents taking care to avoid co-ercive implications;.rimproving knowledge withinthegiineralpublic.(both males and females) of there,la-fivesafety,and effectiveness of availablefamily planning methods;preparing and expecting family planningcounselors and clinicians to include concernfor protection of future fertility and preven-tion of sexually transmitted diseases whenthey counsel family planning clients regard-ing selection of a family planning method;improving knowledge and skills of familyplanning educators, counselors and clini-cians regarding "natural" family planningmethods which require periodic abstinence;increasingawarenessoffamTlyplanningproblems among health care planners,;informing HSAs how to interpret local datarelevant to family plaliwing.Service measures include:making all- forms of contraception accessi-ble and acrtrptable to people who find th

16 ecurrently available services either ina
ecurrently available services either inaccessi-ble or unacceptable;encouraging wider nd more varied distribu-tion of effectivenprescriptcon contracep-tives (in mand other settings);providing, opportunities for teenage boysand girls to attend' family planning educa-tional and counseling sessionsint environ-ments not identified specifically for familyplanning and in which they do not feel pres-sure to make a decision regarding use ofcontraception;providing family planning education, coun-seling and services to sexually active malesas well as females;reducing the waiting time required for thesocial, educational and medical assessmentof clients in family planning clinics-,ensuring that family planning is part of rou-tine perinatal serviceif a woman is breast-feeding, preference should be given to con-traceptive methods Which do not interferewith normal lactation).Technologic measures include:edevelopment of more reliable,acceptablecontraceptive methods for men and women.Relative strength of the-measuresBy1976, 68 percent of minified U.S. coupleswere using Contraception:oalmost 80 percent of married users wereemploying methods which are at least 95percent effectivein preventing conception(male or female surgical sterilization, oralcontraception Or an intrauterine device);most of the 32 percent non-users were try- ing to conceive, were pregnant, post partum,subfecund or sterile because of sur 'gery per-&formed for a non - contraceptive reason;ewer than 8 percent, of maYried coupleswere not Using contraception for some otherreason, including lack of access to services.Some forms of infertility are related to sexuallytransmitted diseases and to other known causes.However, in a high proportion of cases, basicknowledge fof plevention and treatment is notyet available.3. Specific Objectives for 1990 or EarlierImproved health status\ Avoiding the personal orsocial burdens of un-\intended pregnancy (or infertility) is an impor:tant health status objective, though not easilyquantifiable. However, family planning is a keycomponent of efforts to reduce infant and mater -nal mortality.----See Pregnancy and Infant Health.Reduced risk factors*a.By 1990, there should be virtually no unintendedbirths to girls 14 years' old or younger. FulfillingtUs objective would probably reduCe births inas age group to near zero. (In 1978, there-\were less than 10,800 births in'this age group.)b.By 1990, the'fertility rate for 15-year-old girlsshould be reduced to 10 per.1,000. (In 1978,.°there were 14.2 births per 1,000 for this agegrqup.)c.By 1990. the fertility rate for 16-year-old girlsshould be reduced to 25 per 1,000. ,(In 1978,.there were 31.8 births per 1,000 for this agegroup.)d.By 1990, the fertility rate. for 17-year-old `girlsshould be reduced to 45 'per 1,000. (In -108,there were 52.1 births per 1,000 for this agegtoup.)e.By 1990, reductions in unintended births amongsingle AVan women (15 to 44 ytars of age)should redu18 per 1,000.per 1,000 unmanage. )f.By 1990, the propoin the second trimes;educed to 6 perccent of athe fertility rate in this group ton 1978, there were 26.2 birthstied women 15 to 44 years ofion of abortions performedet; of pregnancy should bet(in 1976, about 11 per-ere performed in the second,trimester), thereby reducing the death -to -caserate for legal abortions in the United States to0.5per .100,000. (In1977,it was 1.4 per100,000.)kg.By 1990, the availability of family planning in-formation and methods (education, counselingand mediqal services) to all women and menshould have sufficiently increased to reduce by$0 percent the disparity between Americans ofdifferent economic levels in their.ability to avoidunplanned births. (In 1976, 52 percent of bi

17 rths17that occurred during the previous
rths17that occurred during the previous five yearsreported by evermarned wonien with family in-comes below the poverty level were unplanned,compared to 29.2 percent for women with fennyincomes of 150 _percent of poverty level orhigher.)*NOTE: Objectives a. to e. specify reductions inthe fertility rate to reduce unintended birthsfor, specific age and marital status groups ofwomen. Some births to women in these groupsare planned. However, unintended births. ac-count for a very large proportion of births towomen in these groups.Thus, reductions in un-intended births would allow the target objec-tives to be met without affecting the numbersof planned births.Increased public/professional aw arenessh: By 1990, at least 75 percent of men and womenover the age of 14 should be. able to describeaccurately the various contraceptive lnethods,including the relative safety and effectiveness ofone method versus the others. (Baseline data un-available.)improved services/protectioni.By 1985, sales of oral contraceptives contain-ing more than 58 micrograms of estrogen shouldhave been reduced to 15 percent of 'total sales.(In 1978, atNig27 1percent of preparation%sold wee at this level.)j.By 1985, 100 percent of Federally funded fam-elanning programs should have an estab-,lish d routine for providing an initial infertilityasssment, either directly or through referral.(Baseline data unavailalle.)4. Principal AssumptionsThere will continue to be no policy on populationgrowth in the United States. Therefore, the goalsand objectives of family planning are, predicatedsolely on individual choice, social responsibility andconcern for health.Stable families promote the physical, emotional andsocial health of the family members, community,and society. The ability of couples to plan the-num-ber and timing of the births of their children sup-ports the stability of families.,Religious convictions will\be respected int the devel-opment of fertility control'policiesand programs.Federal support of family planning services will in-crease as evidence grows on the ability, of familyplanning dollarg to effect savings in dollars ex-pended to address problemsinotherpublicly-financed health, social and welfare programs.The mechanisms for funding clinical family plah-ning servioes will remain the same./Legal, socioeconomic and institutional barriers tocontraception wilt be removed.Federal support of population and family planningresearch will continue.Although the overall U.S. abortion rate may decline13at ,,at by 1990, the incidence of abortion among.....iertain high risk groups will not decrease signifi-antly.ere will be no major breakthroughs in contracep-te technology available to the public during the,1980s.,Education can result in behavioral change.I.Few, adolescents younger than age 18 are adequatelyprepared for the responsibilities of parenthood.The current trend of an incieaeing proportion ofadolescents who are sexually active will continue.However, many teenagers are not ready for sexualrelationships which include intercdurse, and themajority of adolescents under 18 will continue to-defer sexual activity..In the 1980s, industry will not invest :heavily inresearch and development of new -contraceptivemethods,5. Data Sourcesa. To National level onlyNational Survey of Family Growth (NSFG).Proportion of women sexually active by age,race and marital status, and a wide range ofsocioeconomic characteristics; *fertility experi-ence (pregnancy histories) of the sexually ac-tive poulation, including sterility and subfecun-dity;, planning status of each. pregnancy accord-'ing to whether contraception had been used andwhether the birth' had been wanted, mistimed(wanted but as a later date)

18 , or unwanted atthe time of conception;
, or unwanted atthe time of conception; pregnancy outcome-andsurvival of tlz newborn; family planning serv-ices received;lkources of contraceptive supplies,including over-the-counter methods; contracep-tive methods'being used, usqkffeotiveness ofmethods; switching of methods and reasons forswitching, side effects of contraception. DHHS-NCHS. NCHS Vital and Health Statistics; Series23, selectectreports. Interview survey of/10,000women in National probability sample repre-senting Americas yomen 15-44 years of age.Surveys in 1973 and 1976 limited to womenwho were or had been married, or single witho'offspring in the household. In later surveys, allwomen 15-44 years of age will be represented., The National. Prescription Audit (NPA). Dis-tribution of contraceptive prescriptions writtenbyphysicians,by hormonal potency. IMSAmerica Ltd., Ambler, Pennsylvania. Selectedreports. Continuing survey; pharmacies on MSpanel.National Reporting System for Family Plan-ning,Services (NRSFPS). Visits to family plan-ning clinics. DHHS-NCHS. Annual reports.Continuous sample survey since June 1977; con-_tinuops full count reporting from 1972 to June1977.b. To State and/or lical levelAbortion Surveillance. Number and characteris-tics of women who have legally induced abor-tions in the United States, abortion related mor-bidity and mortality. DHHS-Center for DiseaseControl (CDC). Annual reports since 1972.Continuous reporting of abortions from centralhealth agencies in 40 States and from hospitalSand/or other facilities in the remaining juris-dictions. Abortion related deaths reported fromthe vital statistics sectipn of State health depart-ments, abortion related morbidity reported fromthe Joint Program for the Study of Abortion.National Vital Registration SystemNatality. Births and birth rates by place ofoccurren* and by the mother's place Ofresidence, age, race and parity. D'HHS-NCHS. NCHS Vital and Health Statistics,Series 21, selected reports, and MonthlyVital Statistics Report. Continuous report-ing by States; full count of birth certificates38States;50' percent sample remainingStates. State health agencies, derived fromcertificates of live blahs to U.S. residents.Birth rates calculated on the basis of Ile4.number of women 14-49 years 6f age re-siding in the respective areas, enumeratedin census \years, and estimated for inter-census years.1 cJ)14-k PREGN4NCY AND INFANTHEALTHS1. Nature and Eittent of the Problem.Assuring all -infants a healthy start in life and enhanc-ing the health of their mothers are amoiig the highestpriorities in preventing disease and promoting health.The principal threats to infan hpalth are problemsassociated with low 'firth weight anc112.11 defectswhich an lead to lifelong handicapping conditions. Ofparticular concern are the disparities in the health ofmothers and infants that exist between different popu-lation groups in this country. These differences areassociated with a variety of factors, including thoserelated to the health of the mother before and duringpregnaricy as well as parental socioeconomic status andlifestyle charactdistics. Although the precise relation-ship betwetn specific health services and the healthstatus of pregnant women and their infantsis notcertain, the piovision of high quality prenatal, 'ob-stetrical, and neonatal care, and preventive servicesduring the first year of life, can 'reduce a ne'born'srisk of illness and death. Of particular concern areadolescent's, whose infants experience a high degreeof low birth weight and whose health problems shouldbe addressed in a broad context taking into considera-tion social and psychological implications.a.Health implicationsMaternal and infant mortality, and morbidityrec

19 ords show striking demographic-variation
ords show striking demographic-variations:an overall rate of maternalinoitalityof 9.6per 100,000 live births in1978, but with arate Tor blacks almost 'four times that forwhites;an infant mVality rate of 13.8 per1,000live births m 1978, but with the infantmortality rate fqr black babies 92 percenthigher than for iihites;,infant mortality rates for individual Statesranged from 10.4 to 18.7 in 1978;infant' mortality rates in 1977 for 26 tnajorcities(withpopulationsgreaterthan500,000) ranged from 10.6. to 27.4; 22 ofthe 26 major cities had highir rates than theNational average of 14.1 in 1977.The greatest single problem associated withinfant mortality is low birth weight; nearly two-thirds of the infants who die are low birthweight.Maternal factors associated with a high riskr151toof low birth weight bablts are: age (17 andunder, and 35 and over), minority status, highparity,previous unfavorable pregnancy out-come, low education level, lceyi socioeconomicstatus,inter-pregnancyintervalleisl-than6months, inadequate weight gain during preg-nancy,poornutrition,,smoking,misuseofalcohol and drugs and 'lack of prenatal care.High quality early 4pd continuous prenatalbirth and .postnatal care can decrease a new-bOrn'sflisk of death or handicap from pregnancycompliCations, low birth weight, maternal infec-tionfromsexuallytransmitteddisease anddevelopmental problems,both physical andpsychological.After the neonatal period the causes of infantmortality and morbidity, many of which ritay bepreventable, are: disorders related to a high,riskbirth,infectiousdiseases,congenitalanomalies, accidents, lack of health care'sandabuse.b.Status andJds\19Although the overall rate has been graduallyimproving since 1965, an excessive -number of'infants born in the United States are of less thanoptimalbirtp weight forsurvival and goodhealth. This includes:approximately 7 pert of all babies are oflow birth weight,ttis, 2,500 grams orless; the rate is altnost twice as high forblacks; other industrialized nations experi-enced substantially lower rates during theperiod 1970-1976; for example in Japan5.3percent of births were low birth,,weight.and in Sweden 4.1;approximately. another 17all,7 percent of anewborns in The United States in 1978 hadbirth weights fallidg between 2,501, and3,000 grams.Many children in the United States are 'Wornto women who have an increased risk of having'a low birth weight infant co other health prOb-lems, particulaily:the 25 percent of women giving birth in1978 who made no prenatal visit during thefirst trimester and the 5 percent who had noprenatal care during either of the first twotrimesters;tah the pregnant teenagers (at higher 'risk forlow birth weight babies) who accounted for17percent of the infants born in1978;the two-thirds of pregnant teenagers in1976whose pregnancies were not intended whenthey occurred;the births to single women(26.2births per.1,000 single women in1978)for whom the4data indicate specialrisk of poor healthoutcomes for mother and infant.2. Orevention/PromoiionMeasures -a.Potential measuresEducation and information measures include:developing, implementing and evaluating thequality and quantity of health educationcurricula in schools and oommunities; withemphasis on lifestyle risk factors (poor nu-trition and use of alcohol, cigarettes anddrus),aswell as family life and parenting;deteloping,implementing and evaluatingpreventive educhional strategiand ma-tenais for use in private and pubprenatalcare;increasing the use of mass media toncour-age more healthfullifestyles; deloningtelevision and radio programs that supporthealthful lifestyles;making prosppctive patentS at high risk of( impaired fetres aware of genetic diagnosisand cou

20 nseling services so that those af-fected
nseling services so that those af-fected can make informecipdecisions con-.sistent with their personal ethiCal and re-ligious values;promoting, educating and supporting breast-feeding where possible.Service measures include:family planning services which optimize thetiming of pregnancies;prenatal care which routinely includes edu-cation on avoidable iskrer6:1, maternal andfetal halth. during pregnancy;assuring that all populations are served byorganized medical care 'systems that includeproviders (physicians, nurse practitioners,nurse midwives,nutritionists and others)who are trained to deliver prenatal, post-natal and infant care on site (requires pertsonnel strategies and economic and pro-fessional incentives);developing local, easily accessible prenatalservices for all, including access to amniocen-tesis for high risk pregnant women;regionalizing prenatal and perinatal servicesso thatall women and newborns receive,diagnostic and therapeutic care appropriateto their assessed needs;assuring adequate linkages, including trans-portation, to regional centers for high riskexpectant mothers and newborns;outreach perinatal and infant care servicesfor currently underserved populations, suchas teenage expectant mothers;evaluating the quality of perinatal and in-fant care being received and relating pro-gram activitiesto pregnancy andinfanthealth outcomes;identifying and tracking infants and familieswithmedical,congenital,psychological,social, and/or environmental problems;reducing the number of low birth weightinfants by reducing teenage and other highrisk pregnancies, reducing damaging effectsfrom alcohol*,cigarettes and othertoxicsubstances, improving nutrition, andassur-ingparticipationincomprehensive pre-conceptional, inter-conceptional and earlyand continuing prenatal care;eliminating unnecessary radiation exposureto pregnkt.,women and babies;assuring tWt all programs of primary caresupport and contribute to the fulfillment ofobjectives related to maternal and ,infanthealth;encouraging parent support groups, hotlines,and counseling for parents of big risk in-fants and supports for lowering stress levelsin troubled parents who may, have potentialfor child abuse.See Family ,Planning, Immunization, andSexually Tra5smitted Diseases.Legislative and regulatory measures include:requiring that all Federally funded programsfor delivering perinatal care assure adequatehealth and prenatal education, screening forpregnancy risks and patient plans for careduring labor and delivery appropriate todiscovered risks, and for infant follow-upand care through the first year of life;requiring fiscal and pregnancy outcome ac-countability in puhlicly funded prenatal' andperinatal programs;reducing exposures wr toxic agents that maycontribute tb physical handicips or cogni-tive impairment of babies.Economic measures include:reviewing all programs that finance orpro-vide health services for aft:others and childrenin order to:assure inclusion of health prornotOit andpreventive `services;optimize their effect by reducing overlaps,pocketsofneglectandcontradictoryobjectives;adequate 'public financing for outreach, early.and continuous prenatalcare,deliveries,support services, intensive care when neededand continuing care of infants;11620M am/consideration of direct Federal financingtied to uniform standards of performancewhere public health departments show po-tentialfor expanding maternal and childhealth services to wopulations. eft need.b.Relative strength of the measuresThe relative effectivenessollivaridus interven-tions to improve pregnancy outcome and infanthealth is not without controversy. The recordsOf many demonstration projects, both domesticand foreign, amply confi

21 rm thataramatic im-prov*ments can be mad
rm thataramatic im-prov*ments can be made in the indicators ofmaternal and infantealth..For .example, thein ft mortality rateor American Indians wasduced by 74 wee t between 1955-1977 andmaternal mortalitycreased from,2.times thetotal U S. rate in 1958, to below ftfe total U.Srare. by 197.5-76. Unfortunately, studies havenot generallyeen designed to yield firmly de-fensible datan therelative contribution ofprograms. Ho ever, the evidence indicates thatemphasis be placed on family planing whichoptimizes the timing of pregnancies, early identi-fication of pregnancy and routine involvementof ail pregnant women in prenatal care, There-fore, the fhowing priorities are strongly sug-gested:.systems of care that reach everyone withbasicservices,,emphasizing advantageouspersonal health behavior and including out-reach, education, and easy access to com-munity-based services without social, eco-nomic, ethnic or time or distance barriers;"measures whichprevent unwantedpreg-riaacies and which optimize'the mostfavor-.able maternal age for childbearing, Includingsex education, contraception, easy access topregnancy testing, genetic counseling, pre-natal diagnosis and' associated counseling;early and continuing prenatal care, particu-larly for those at greatest riskpoor, poorlyeducated women, those near the beginniagor the end of their reproductive age,thosewith previous piegnancy loss and those with"recent pregnancy; ,7nutrition education and food supplementa-tion as rfeededx as well as parent educationon impoitance of good infant nutrition, pre-ventive measures essential to avoid child-hood disease and accidents and parentingconducive to sound emotional development;cessationofsmoking duringpregnancy(which may contribute much more to theimprovement of birth weight and to favor-able pregnancy outcome than is now fullydocumented);regionalized programs of care with referralsystem Which assure access to levels of careappropriate to special risks.141721/3. Specific Objectives for 1990Improved health statusa.By 1990, the National infant mortality rate(deaths for all babies up to cre year of age)should be reduced to no more than 9 deathsper 1,000 live births. (In 1978, the infant mor-tality rate was 143.8 per 1,000 live births,)b.By 1990, no county and no racial or ethnicgroup of the population (e.g., black, Hispanic,iIndian) should have an infant mortality rate inexcess of 12 deaths per 1,000 live births. (In1978, the infant mortality rate foe whites was12.0 per 1,000 live births; for blacks 23.1 pet-1,000 live births; for American Indians 13.7per 1,000 live births; rate for Hispanics is notyet available separately.)cBy 1990, the neonatal death rate (deaths for allinfants up to 28 days old) should be reduced tono more than 6.5 deaths per 1,000 live births.(In 1978, the neonatal death rate Aras 9.5 per1,000 live births )dBy 1990, the perinatal death rate should be re-duced to no more than 5 5 per 1,000.4' (In1977, the perinatal death rate was 15.4 per r1,000 )*NOTE: The perinatal death rate is total deaths(late fetal deaths over 28 weeks gestation plusinfant deaths up to 7 days old) expressed asarate per 1,000 livebirths and latefetaldeaths.eBy 1990, the maternal mortality rate shouldnot exceed 5 per 100,000 hwe births for anycounty or for any ethnic group (e.g., black,Hispanic, American Indian) In 1978, the over-rate was 9 6the rare for blacks was 25.0,iwthe rateites was 6 4, the rate for Ameri-can Indians wasi12.1; the rate for Hispanicsis not yet available separately. )fBy 1990, the incidence of neural tube defectsshould be reduced_ to 1 0 per 1,000 live births.(In 1979, the rate was 1.7 per 1,000.)By 1990, Rhesfis h9molytic disease of the new-born should be reqfi

22 ced to below a rate of 1 3per 1,000'live
ced to below a rate of 1 3per 1,000'live biO.hs. (In 1977, the rate was1.8 per 1,000.) /By 1990, the incidence of infants born wit13Fetal Alcohol Syndrome should be reduced by25 percent. (In 1977, the rate' was 1 per 2,000births or aproximately 1,650 cases.)g.'h*NOTE: Same objective as foi Mis-use of Alco-hol did Drugs.See Nutritioh.. Reduced risk factorsi.By 1990, low birth weight babies (2,500 gramsand under) should constitute no more than 5percent of'all live births. (In 1978, the pro-portionwas 7.0 percent of all births.)By 1990, no county`and. no radial or ethnic group of the population (e.g., black, Hispanic,andweight(prematurely bornAmerican Indian) should have aof lowbirthsmall-for-age infants weighing less than 2,500,grams) -that exceeds -9 percent of all live births.(In 1978, the rate for whites was about 5.9percent, for Indians about 6.7 percent, and forblacks about 12.9 percent; rates fortHispanicsare not, yet separately avail ble; rates for someother nations are 5 percent and less.k.By 1990, the majority of hfants should leavehospitals in 'car safety carriers. (Baseline dataunavailable.)..4See Nutrition, Family Planning, Smoking andHealth. ,Misuse of Alcohol and Drugs. SexuallyTransmitted Diseases. Immunization, Occupa-tionalSafety and Health, Toxic Agent Control,'"and Accident Prevention and Injury Control.Increased public/professional awarenessBy 1990, 85 percent of women of childbearingage should be able ter-ckose foods. wisely (statespecialnutritional needs of pregnancy)andunderstandthe bazards of smoking, alcohol,pharmaceutical prodbcts and other drugs duringpregnancy and lactation (Baseline data unavail-able.)See Nutrition, Smoking and Health, Misuse ofAlcohol and Drugs. Sexually Transmitted -Dis-eases, Imm-unization, Occupational Safety andHealth, and Toxic Agent Control.Improved serv}ces/protectionm By 1990. virtually all women and infants shouldbe served at levels appropriate to their need bya regionalized system of primary, secondary andtertiary care for prenatal, Maternal and perinatalhealthservices.(In1979, approximately 12percent of births occurred in geographic-areasserved by 'such a system.)n.- By 1990,the, proportion of women inany.county or racial or ethnic groups (e.g., black,Hispanic, American Indian) who obtain noprenatal care during the first trimester of preg-nancy should not exceed IG percenS (In 1978,40 -percent of black mothers and 45 percent ofAmerican Indian mothers received no prenatalcare during the first trimester; percept of His-panics is unknown.)o.By' 1990. virtually all pregnant women at highrisk of having a fetus with a condition diagnos-able in utero, should have access to counselingand infgration on amniocentesis and prenataldiagnosis, as well as therapy as indicated. (In1978, abopt 10 percent of womenand overreceived amniocentesis. Baseline data are un-available for other high risk groups.)p.By 19'90; virtually all women who give birthshouldhave appropriately-attended,safede-.livery, provided in ways acceptable to them and4.Itaaq..their families. (In 1977, less than .3 percentof births were unattended by a physician ormidwife. Furthermore,.,nf births which are at-tended by a physician or midwife, an unknownshare are not considered satisfactory by thewomen or their families.)By 1990, Virtually all newborns sIcrbe pro-vided neonatal screening for metabis disordersfiv which effective and efficient tests and treat--y,ments are available (e.g., PKU and congenitalhypothyroidism). (In 1978, about 75 percentof newborns were screened for PKU; about 3percent were screened for hypothyroidism in theearly 1970's, with the rate now rapidly increas-ing.)r.By 1990, virtually all infants should be able toparticip

23 ate in primary hgalth care that includes
ate in primary hgalth care that includeswell Child care; growth development assessment;immunization; screening, diagnosis and treat-ment:for conditions requiring special services;appropriatecounselingregardingnutrition,automobile safety, and prevention of other ac-cidentssuchaspoisonings.(Baselinedataunavailable.)See Nutrition, Immunization, Accident Pre-vention and Injury Control.t-.1§Improved surveillance/evaluation systemss.By -1990, a system should be in place for com-prehensive and longitudinal assessment of theimpa6 of a range of prenatal factors(e.g.,maternalexposuretoradiation,ultrasound,draniatictemperaturechange,toxicagents,smoking, use of alcohol or drugs, exercise, orstress.) on infant and child physical and psycho-logical development.4. Principal AssbmptionsAssurances of participation in essential services willbe enhanced by various programs of outreach andby communication with client groups to achievestyles of service that are appropriate and acceptableto different populations. and by initiating or expand-ing publicly sponsored programs of care as may benecessary for people who are not reached by privateand traditional provider systemsCurrent efforts to ensure an adequate sup ply of foodwill be continued and extended (WIC and foodstamps)..Information will be routinely provided to pregnantwomen on serum-alphafetoprotein screening; screen-ing will be provided fedical, obstetric, psycho-social and genetic riskWnd participation assuredin 'appropriatelevels of diagnosis, support andtreatment,Prenatal care will routinely-include education -6n-avoidable risks to maternal and fetal health duringpregnancy, and to infant health following birth.Perinatal and mfant care wilt include but not belimited to:nutritional e(ucation and supplementation as22 needed, including preparation and support forbreastfeeding (See)utriticin);psychosecial supports which promote parentingbehavior conducive to parent-child attachment;promotion of lifestylesthat encourage good'parental, infant and child health practices;linkages that assure antenatal identification ofrisks,risk reduction activities and completedplans for participation in appropriate intrapar-turn and continuing infant care;'provision of Rhesus immune globulin to all Rhnegative women, not previously sensitized, whohavea knownorpresumed Rh positivepregnancy.Achieving objectives that deal with mortality andlow birth weight presumes participation in compre-hensive servicesthatwillalso Work to reducematernal and infant morbidity associated wit14 life-style and environmental risks, including:alcohol and drug use;smoking;management Of parental stress;toxic substances during pregnancy and lactation;occupational safety and health;prevention of infant and child accidents;See Misuse of Alcohol and Drugs,..Sinokingand Health, Control of Stress and *Violent Be-havior,ToxicAgentControl,OccupationaltSafety and Health, Accident Prevention andInjury Carol.Reduction of unwanted and unintended pregnancieswill achieve reduction of pregnancies in teenage andlate childbearing years, and will concentrate child-bearing during oppum maternal ages. Efforts toreduce unwanted pregnancies are presumed to pro-vide for:111.education on sex, family life and reproductivehealth;ready access toall forms of family planningservices;ley access to pregnancy testing, with assn'ciated counseling and referral;See Family Planning.All needful infants and families will participate insupport services(e.g., food supplementation, in-come supports, day cart, minimum housing) thatare defined by Natiotial standardswhich assureequity.All pregnant women will have access to regionalizedsystems of maternity care which assureservicesappropriate to need.,A

24 gencies receiving public funds related t
gencies receiving public funds related to healthcareincluding Federal, State and local units ofgovernment,privateagencies, andquasi-publicagencies such as HSAswill adopt these or moretringent'objectives,andwilldocumenttheirprogress toward meeting them.19235. Data SourOesa. To National level -onlyHealth Interview Survey (HIS). Smoking anddriiiking prevalence among women of childbear-ing age. DHHS-NCHS. NCHS Vital and HealthStatistics, Series 10, selected reports, and NCHS,Advance Data from Vital and Health Statistics,selected reports. Continuing household inter-view survey; National probability samples.Hospital DischarSurvey (HDS). Deliveriesinhospital. DHLINICHS. NCHS Vital andHealth Statistics,ries13, selected reports.Continuing survey,ational probability sampleof short-stay hospitsNational Ambulatory Care Survey (NAMCS).Visits to private physicians for prenatal care.DHHS-NCHS. NCHS Vital and Health Statisttics, sSeries13,selectedreports. Fontinuingsurvey; National probability sample office-basedphysicians.National Reporting System for Family PlanningServices (NRSFPS). Visits to family planningclinics. DHHS-NCHS. Annual Reports. Con-tinuous sample survey since June 1977; con-tinuous full count reporting from 1.972 to June1977.National Natality Follow Back Survey. Selecteddata from 1964-66 Folloiv Back.Vitaland ,HealthStatistics,Series22.Survey ofmothers with legitimate live births; sample ofbirth records.1980 National Natality Survey/1980 NationajFetal Mortality Survey. Birth and fetal 'deathsby numerous-characteristics not available fromthe Vital Registration System. DDHS-NCHS.Currently in the field. Public use data tapes,willbe available from the survey. National samplesurvey.National Survey of Family Growth (NSFG).Characteristics of women of childbearing age.'DHHS-NCHS..NCHS Vital and Health Sta-tistics, Series 23, selected reports, and AdvanceData from Vital and Health Statistics, selectedreports. Periodic surveys ,at intervals of severalyears; National probability sample.b. To State and/or local levelNational Vital Registration SystemNatality: Births by age, race, parity, maritalstatus. Most States also have number ofprenatal visits, timing of first prenatal visit,educational level of mother, sometimes of-father. DHHS-NCHS. NCHS Vital Statisticsof the United States. Vol. ilk and MonthlytVital Statistics Reports, Series 21. Contifiu-:ous reporting by States; full count of birthcertificates 38 States, 50 percent samplesample remaining States. (Many States issuetheir own earlier feports).Mortality. Deaths (including infant and fetal deaths) by age at death, sex, race. SomeStales link mortality and natality thus mak-.ingfullnatalitydata available. DHUS-NCHS. Vital Statistics of the United Staks,Vol. 1, parts A and B; and NCHS MonthlyVital Statistics Report by States, Series 21,selected reports. Continuous reporting byStates, all events. (Many States issue theirown earlier reports.)Hospitalized illness discharge abstract systems.Professional Activities Study (PAS). Pa-tients in short stay hospitals; patient charac-teristics,deliveries, dioses of Congenitalanomolies, proceduresloerformed, length ofstays. Commission on Professional and Hos-pital Activities, Ann Arbor, Michigan. An-a4420n al reports and tapes. Continuous report-ing from 1900 CPHA member hOspitais; not:a probabilitysample,extent of hOspitalparticipation varies by State.Other hospital discharge systems as locallyavailable..Selected health data. DHHS-NCHS. NCHS-...Statistical Notes, for Health Planners. Com-pilations and analysis of data to State level.Area ResourceFile(ARF). Demographic,health facility and manpower data at State andcounty level from various sources. DHHS-Health Resou

25 rces Administration. Area Re-source File
rces Administration. Area Re-source Filea Manpower Planning and Re-search Tool, DHHS HRA-80-4, Oct 79. Onetime compilation.24 NoIMMUNIZATIONI1. Nature and Extent of the ProblemVaccines are among the safest and most .effective meas-ures for the prevention of infectious and communica:ble diseases. Introduction and widespread use of vac-cines have resulted in global eradication of smallpoxand in dramatic declines in the incidence of diphtheriao.measles, mumps, pertussis (whooping cough), polio,rubella and tetanus. Although efforts to vaccinate in-creasingly higher proportions of target populationshave been successful in recent years, continued activi-ties are required to complete the task. Moreover,, cdnr.tinued vigilance is required to maintain past successesin alioiding illnesses and deaths from these diseases,since, with the exception of smallpox, the causal agentshave not bean eliminated and the risk coritinues. Fullimplementation of influenza immunization, and newvaccines as they are developed, imposes a continuingclrallete since the target populations (such as for asexually transmitted diseases vaccine) may be differentfrom those presently receiving vaccines..a.. Health implications411IkCessation of vaccination would inevitably leadto the recurrence of annual epidemics, for exam-ple, of measles, rubella, diphtheria, and mumps,as well as periodic epidemics of polioand greaterincidence of tetanus...During periodic pandemics, thousands of peoplemay die prematurely as a result of influenza.Be-tween these pandemics, excess mortality due toinfluenza may also be in the thousands. Thosepritharily affected are the chronically ill and theelderly.Pneumonia causes over 50,000 deaths annuallyand over half these deaths Occur among peopleover 65. The risk of death from pneumoniais2.5*tes higher.for those agqr 65 to 74 and 10times higher for those 75 to,A4 than for the pop-ulation as a whole.*4b.Status and trends:From the years of their initial development tothe present, the various immunizations havebrought global eradication of smallpox and sharpdeclines in morbidity and mortality from otherdiseases:diphtheriaApproximately160,000casesand 10,000 deaths or more annually in theearly 1920s; 59 cases in 1979 and 4 deaths1.\tAvailable);1978 (most recent yeaj for Which data are/Available);-'whooping coughapproximately 200,000cases and approximately'5,000 deaths annu- .ally in the early 1930s; 1,617 Cases in 1979and 6 deaths in 1978;polio - - 21,000 cases of paralytic, polip in1952 (epidemic year); 26 cases in 1979;mumps-152,000 cases in 1968; 14,225 in1979;rubella-60,000 cases in- 1969, 11,795 in197?;meAles-480,000 cases in1962; 13,597cases in 1979.Morbidity from influenza and pneumonia is not-reportable, so trends cannot be determined.With the dramatic reduction bf vaccine prevent-able diseases, the rare adverse effects of immuni-zation have become increasingly visible.An effective system for assuring that routine im-munizations are delivered to susceptible popula-tions has not yet been established nationwide.Immunization is required by law for first entryinto 'school in all 50 States and the District ofColumbia.Liability associated with vaccines,. and compen-sation of those injured as a result of immunize*tion, have emerged as issues in the effective de-livery of services..2. Prevention/Promotion Measuresa.Potential measuresEducation and information measures include:providing useful immunization information.to all mothers and new parents-by hospitals,physicians and others;aiming educational programs at members ofthe health care professions;including discussion of immunization and'preventive measures in school health curric-,2 5.ula;-- enlisting day care centers,

26 seniorcitizen cen-ters and churches to
seniorcitizen cen-ters and churches to provide immunizationinformation to parents and to older people;using the mass media for immunization ac-tivities;continuing usa of volunteers.Service mea%ces include: 94.adopting standardized official immunization-records;developing and using "tickler" and recallsystems to ensure that children return forimmunizations on schedule;reviewing records to identify children need.:ing immunizations;making immunizations -available without fi-nancial barriers in all health care settings asa part of comprehensive health services;prov.idinginformationand immuniza 'on'services to special, populations such asmi-grants and non-English speakingcontinuing use,of volunteers.Legislativeand regulatory measures include:,enforcing existing school immunization re-quirements and extending them to include'children at all .grade levels in both publicand privatejechoOls, as well aftitilbsfati Zadpreschool Attings;including consideration of coveragesg im-munization as a Medicare benefit;requiring carriers under any National healthinetrance plan to reimburse' for immuniza-tip services;requiring immunization as a condition of em-ployment (e.g.,in health care institutionsand for school age employees);requiring rubella immunization as a serviceroutinely offered in family planning clinics,primary care clinics, hospitals (particularlypost-partum settings) and HMOs.-0 Economic.measures include:kwreimbursing for immunizations ,underareprivate health insurance4lans;providing vaccine free tohealth care pro-viders as long as they do not chargKor it;proxiding economic incentives to healtk careproihders and vaccine recipientg..b.Relative strength of the measurespublicThe uniform sand forceful implementation ofschool immunization requirements is one of themost effective means of improving immunizationlevels Currently available. Enforcement of suchrequirements to the point of exclusion fromschool has resulted in the highest achievable im-,munization levels of school children and thelowest reported levels of diseases such as mea-, sles. One problem with this measure is that-itdoes not assure that all- pItchool children areadequately immunized before the time of entryto school.her potential regulatory measures,uch as imm nization requirements for employ-nt in hospitals, address specific problems inseted population groups and are less effective.Continuing education and motivation of-the gen-eral public and health providers about-the needto continue routine immunization and the ac-companying need to accept the minimal risk of4422severe complications associated wish.some vac:cines are .essential` to maintain and extend pre-vention Of these diseases, Experience developed.from the recent Childhood Immunization Initia-tive has demonstrated the importance of massmedia and vnteer promotion of routine inItnu-nization to paris and children.IC Specific Objectives fa 1990 or Earlier\Improved health statusBy _1990, reported measles.incidence should bereduced to less than 500 cases per yearall.ported or within two generations of importation.(In 1979, there were 13, 597 measles cases re--ported.)b:By'1990, reported mumps incidence should be --reduced to less than 1,000 cases per year. (In1979, there were14,225 mumps casesre-ported.)c.By 1990, reported rubella incidence should bereduced to less than 1,000 cases per year. (In,1979, there were 11,795 rubella cases reported.)d.By 1990, reported congenital rubella syqlromeincidence should be reduced to less than 10 casesper year. (In 1979, there were 62 new cases ofcongenital rubella syndrome.)e.By 1990, reported diphtheria incidence shouldbe reduced to less than 50 cases per year. (In1979, there were 59 diphtheria cases

27 reported.)f.By 1990, reported pertussis
reported.)f.By 1990, reported pertussis incidence should bereduced to less than 1,000 cases per year. (In1979, there wer*1,617 pertussis cases reported.)By ,1990, reported tetanus incidence should bereduced to less than 50 cases'per year. (In 1979,there were 81 tetanus cases, reported.)h.By 1990, reported polio incidence should be less-than 10 cases per year. (In)979, there were 26polio cases reported.)Increased public/professional awarenessI4,g.i.By 1990, all mothers of newborns should receiveinstructioh prior to leaving the hospital or afterhome births on immunization schedules for theirbabree(Baseline data unavailable.)Improved services/protection,j.By 1990, at least 90percenttal childrenshould have completed their basic iOnizationseries by age 2measles, mumps, rula, polio,diphtheria, pertussis and tetanus. (Incorn-pletion'traried from 50 to 90 percent.)k. By 1990, at least 95 percent of children attend-ing licensed day care facilties, and kinditrgartenthrough 12th grade should be fully immunized.(Based on data collected during the 1978-1979school year the immunization level for measles,rubella, polio and DTP. was about 90 percent forfirst.school entrants, lower overall.)1.By 1990, at least 60 percent of high risk popula-.tions as defined by the Immunization PracticesAdvisory Committee of the Public Health Serv-26 1tOPice (ACIPould be receiving annual immeni-g`nation against influenza. (In 1979, about 20 per-cent of high risk populations were immunized.),..m. fly.,1990, at least 60"percent of high risk Popula-tionahas defined by the ACIP, should have re-ceived vaccination against pneumococcal pneu-monia. (Baseline data unavailable.) .*n.. By 1990;at least 50 percent of people in popula-tions designated as targets by the ACIP shouldbe immunized within 5 years of licensure of newvaccines for routine clinical use.*NOTE: Same objecti e as for Surveillance andcandi-dates include: hepa itControl of Infectiou DiSeases. Potential candi-is A and B; otitis media(S. pneumoniae and H. influenza); selectedrespiratory andentericviruses;meningitis(group B N. meningitides, S. pneumoniae, H.influenza)..JPio.By 1985, the Nation should have a plan in:placeto mount mass immunization programs in theface of possible epidemics: of influenza or otherepidemic dise-ases for which vapcines may exist.By 1990, no comprehensive health insurancepolicies should exclude immunizations. (Base-line data unavailable.)Improve'd surveillance/evaluation systemsP.q.By 1990, at least 95 percent of all childrenthrough age 18 should have up-to-date officialimmunization records in a Uniform fort usingcommon guidelines for completion of imAlkiza-don. (Baseline data unavailable.)r.'By 1990, surveillance systems shouletr suffi-ciently improved that (1) at least 90 percent ofthose hospitalized, and 50 percent of those nothospitalized, with vaccine preventable dieasesof childhood are reported, and that (2) uniformcase definitions are used nationwide. (Baseline-/data unavailable.)4. Principal AssumptionsSupport for immunization activities in the privatesector will rernaimat least as high as in1978-79.In the public sector, local, State and Federal supportwill maintain immunization activities at least at cur-re nti,,1Issuesf vaccine liability and compensation of indi-viduals1s.viduals damaged by vaccinewhich have occasion-ally hampered immunization activitieswill be re-solv, or atleast will not worsen. Procedures forinrming recipients of the risks and benefits of vac- 'canes will hot become more complex and may beimplified. Anyin these areas woulcrjeopr-due attainment of the objectives.Vaccines will continue to be available ih the quanti-ties needed, in a timely fashion, and with notraor-...din

28 ary increase in cost.No hitherto-unknown
ary increase in cost.No hitherto-unknown serious adverse reactns willappear whiar11 affect vaccine acceptabiImmunity indu ed by recently introduced veines(e.g.,measles,mumps and rubella) will prove tobepermanent. Immunity will be induced in well over90 percent of recipients..Schools will continue active Ihvolvemen1 and strictenforcement of immunization requirements, no legalchallenges to this approach will be successful.'Use of multiple antigen vaccines (e.g., combinedIneasles-mumps-rubella) will be standard procedure.Support for the development angtesting of new andimproved vaccines will continue at least at presentlevels. Current difficulties in recruitingvoltinteers forvaccine trials will be resolved.. ./5. Data Sourcesa. To National le gel onlyNational 'AmbulatoryMedicalCare Survey(NAMCS). Patient visits to physicians by pa-tient and physician character'ics, diagnosis, pa-tient's reasons for the visit anti services provided,including immunization. DHHS-National Centerfor Health Statistics (NCHS). NCHS Vital andHealth Statistics, Series 13, selected reports, andNCHS Advance Data from Vital and Health Sta-tistics. Continuity ii National probability samplephysician's office-based prabtices since 1973,Health Interview Survey (HIS). Interview re-spondents repots of illness (including childhoodcommunicable'diseases, influenza, pneumonia),,.disability, use of hospisal,.medical, dental, andother services, arid other-health-related topics.DHHS-NCHS. NCHS Vital and Health Statis-tics, Series 10. Continuing survey; household in-tes, National probability sample.H lthandNutritionExaminationSurveyANES). Immunization status, serologic data.7DHHS-NCHS. HANES I, 1971-1974; HANESII, 1979. NCHS Vital and Health Statistics, Se-ries10. Periodic surveys, data obtained fromphysical examinations, National probab-sam-ples.U.Silkmunization Survey (USIS). Percentdf individuals immunized with DTP, TOPV,measles, rubella and mumps vaccines by age and*socioeconomic status. DHUS-Center forRiseaseControl (CDC). Survernslatiorial substfiple ofhouseholds interviewed for the Current POpula-tioh Survey of the 'U.S. Census. United Statesimmunization Survey! 1979. ContinUing, annual. flifVaccine distritmiton system. Distributioncines by antigen. DHHS -CDC. CDC Bioltficsrveillance Report. Quarterly. Continuing, reits from vaccine manufacturers.Vaccines admini*red. Doses of vaccines admin-istered in the public -sector. DI-IHS-CD-c. CDCMemoranda to State and local health depart-ments. Continuing; quarterlyreporting fromSlate and local immunization programs.Adverse Reaction Monitoring System (ARMS).Adverse reactions to vaccination. DHHS-CDC.Surveillance report. Co inuous reporting fromState and local imtion programs.ti School Entmunization Survey. Immuniza-tion status of children on'entry to kindergartenor first grade. DHHIII-CDC. Memoranda to Stateand local healtli departments. Annual reportingfrom State and local immunization programs.Preschool immunization surveys. Immunizationstatu*of preschool children. DHHS-CDC. Mem-oranda to State and local health departments.Annuak or as needed. Survey of day care centersand other surveys of 2 year old children by Stateand local immunization programs.b. To State and/or local levelNational Vital Registration SysttmMortality. Deaths by cause (including dis-eases preventable by .immunization), age,sex and race. DHHS-NCHS. NCHS VitalStatisticta,'s of the United States Vol II, andNCHS MonthlyVital StatisticsReports.Goa4auing reporting from States; Nationalfull count. (Many States issue earlier reports.)Hospitalized illness discharge'abstract systems- Medic'are hospital patient 'reporting system(MEDPAR). Characteristics of Medicare pa-tients, diagno

29 ses, proCedures. DHHS-HealthCareFinancin
ses, proCedures. DHHS-HealthCareFinancingAdministration-OfficeofResearch,Demonstrationsand -!tatistics(ORDS). Periodic reports Continuing re-porting from hospital claim data; 20 percentsample.I24Other hospital discharge systems as locallyavailable.Selected health datl DHHS-NCHS. NCHS Sta-tistical Notes for Health Plannfrs., Compilationsand analysis of data to State level.National Morbidity and Mortality Reporting-System. Numbers of 46 reportable diseases;deaths in 121 U.S. cities. DHHS -CDCt CDCMorbidity and Mortality Weekly Report:and an-nual reports.. Morbidity: continuous reportingfrom State health departments on basis of physi-cian reports. (Completeness of reporting variesgreatly, since not all cases receive -medical careand not all treated conditions are' reported.).Mortality: continuous reporting from volunteerpanel of health departments in 121 U.S. cities,.full count.'Early and Periodic Screening,. Diagnosis, andTreatment (EPSDT) reporting system. Immuni-zation status and referral of children screened.DHHS-Health Care Financing Administration(HCFA), Office of Research, Demonstrationand Statistics. Medicaid Statistics, selected re-ports. Continuing reporting from State Medicaidfiles.Area ResourceFile(ARF). Demographic,health facility and manpower data at State andcountylevelfrom varioussources. DHHS-Health ResOurces Administration (HRA). HRAArea Resource File: A Manpower Planning anResearch ToOl. DHHS-HRA-80-4, Oct 79. Onetime compilation.' Nb.SEXUALLY TRANSMITTED DISEASES1. Nature and Extent of the Prob lemzSexually transmitted diseases (STDs) are infectionsgrouped together because they spread by transfer of in-fectious organisms from person to person during sexualcontact. Sexually transmitted diseases are major Publichealth problems because they cause enormous humansufferinfi, cost hundreds of niillions of dollars and im-pose treMendous demands on medical care facilities.The sexually transmitted disease problem is rooted inapathy and ignorance. Neglect is widespread, dehuman-izing and institutionalized in the public and privatesectprs, including educational settings ranging frompublic schools to those for the health professions.Women and children bear an inordinate share of thesexually transmitted diseise burden: sterility, ectopicpregnancy, fetal and infant deaths,defects andmental retardation. Cancer of thvix may be linkedto sexually transmitted Herpes Lvirus.a.' Health implicationsThe most serious complications caused by sex-ually transmitted agents are pelvic inflammatorydisear, infant pneumonia, infant death, birth de-fects and mental retardation.Pelvic inflammatory disease is the mser uscomplicn from gonorrhea and chlamydlil in-fections.11ore than 850,000 cases are diagnosedand treated each year; the major proportion ofthese are associated with past or present sexuallytransmitted diseases. In 1978, it was estimatedthat 150,000 new cases of pelvic inflammatorydisease were caused by gonorrhea.inaddition:half of all women hospitaliied for pelvic in-flaminatory disease are 'less than 25 years ofage; sterility due to pelvic inflammatorydis-ease currently affects over50,000 womenannually and is increasing;over 35,000 ectopic pregnancies occureach1year resulting in danger to the woman's life;many of these result. from the long-termeffects of.pelyic inflammatory disease;pelvic inflammatory disease yearly accountsfor over 250,000 hospitalizations and over50,000 major surgical procedures, many in-volving total removal of the reproductiveorgans.Chlamydia causes an estimated 50,000 eye in-feCtions and 25,000 cases of-pneumonia per yearin infants.Genital herpes infections are very common, withan incidence of one-half to one million new casesann

30 ually, with several miSon recurrences ea
ually, with several miSon recurrences eachyear, and:no effective treatment is currently availablefor this painful condition; periodic recur-rences are the rule;herpes-complicated pregnancies often result--in abortion, stillbirth or severe neonatal in-.fectiorr; neonatal herpes results in death orpermanent disability in two-thirds of thecases.Hepatitis B is caused by airus With many dif-ferent modes of transmission, including sexualtransmission. Homosexual men are at very highrisk; nearly 60 percent attending Sexually trans-mitted disease clinics show evidence of past orpresent Hepatitis B infection. This same popula-tion is also at high risk of several other sexuallytransmitted diseases, including amebiasis andgiardiasis.These and other sexually transmitted diseaseshave placed great strain upon the resources oflocal healtdepartments during the 1970s.b.Status and treeTotal costsf.ually transmitted diseases.vastly egceedrIlion dollars annually.Costs for the most common reported sexuallytransmitted disease, gonorrhea, were estimatedto total over $770 million in 1978.2. Prevention/PromotionMeasuresa.Potential measures esEducation and information measures include:education and training, including clinical ex-perience in schools for health professionals;education and,formation about sexuallytransmitted dises for school children be-`fore, and during,e time they are at highestrisk;0pre-service and contm ing professional edu-cation for both health providers and healtheducatOrs to deal with sexually'transmitteddiseases an a confidential, non-judgmentalfashion;improved public understanding of sexuallytransmitted disease risks and confidentialitygh, of treatment thiough effective and continu-ous campaigns using mass media; the meas-.y be directed to wide populations orargeted to special groups such as adoles-cents, homosexuals, women with pelvic in-flammatory disease and other risk groups;counseling of patients being treated for Sex-ually transmitted diseases regarding compli-cations and measures to avoid future infec-tion;use of peers, who are often adjuncts to edu-b.cate and counsel adolescents about sexuallyilliktransmitted diseases.I1Service measures include:provision of diagnostic and treatment ser-vices for the sexually transmitted diseasesand their complications;counseling infected patients and tracing andtreating their contacts;screening for selected sexually transmitteddiseases;encouraging jointavailabilityof servicesamong related programs such as sexuallytransmitted diseases, family planning andmaternal and child health.Technologic measures-include:properly used condoms as the best knownmeasure for persons engaging in sexual ac-tivity to avoid acquiring or* transmitting manyof the sexually.transmitted diseases;a vaccine for Hepatitis B (being tested forefficacy); vaccines for gonorrhea and genitalherpes (at an earlier stage of development).Legislative and regulatory measures)nclude:Health Systems Agencies (HSAs) determin-ing the-magnitude of the sexually transmitteddisease problem and establishing objectivesfor inclusion in their Annual ImplementationPlans (AIPs);State Health Planning and DevelopmentAgencies (SHPDAs) making certain that theState health plan addresses gaps in educationand service delivery regarding sexually trans':mitted diseases;-= examination of healtkprofessionals' knowl-edge of sexually transmitted diseases andcompetency in dealing with sexually trans-mitted diseases by specialty boards, certify;ing agencies and other regulatory boards;establishment of a comprehensive rev)ew rat-ing and accreditation to evaluate and main-tain the quality of STD care and services;State and local' governments repealing stat-utes and ordinances whi

31 ch inhibit the adver-tising, display, sa
ch inhibit the adver-tising, display, sale or distribution of con-doms;regulationsmandating ,infOnnation aboutsexually transmitteddiseasesaspartofschool he$th education programs.Economic measures include:sexually transmitted disease services, as withother prevention-related activities, being ex-empted from coinsurance or deductible pro-yisions of health insurance;prepaid health plans receivingfinancial in-centives for sexually transmitted diseasrpre-vention activities including management ofcontacts who are not members of the plan.Relaiive strength of the measuresReadily available quality clinical seices withoutstigma form a neceisary fon6datiin for 'otherclinic-relatedpreventionactivities.Eaily diagnosis and treatment of sexually trans-mitted diseases among patients attending clinics,contacts and thOse ideptified in screwing pro-grams are highly effective in preventing trans-mission of the diseases and in limiting their dis-abling complications.Persons who properly and consistently use con-doins experience lower rates of sexually trans-mitted diseases.As vaccines are developed and introduced, theycan be effectively administered in the health caresystem..Mass and targeted education and informationmeasures appear td be the only way to modify1;jar dened public opinion and reduce .sexuallytransmitted disease ignorance and apathy.Education and training of health professionalsand health educators is a necessary first steptowardeffectivesexuallytransmitted diseaseservice measures.3. Specific Objectives for 1990 or EarlierImproved health statusa.By 1990, reported gonorrhea incidence shouldbe reduced to a rate of 280 cases per 100,000population. (In 1979, the reported case rate was457 per 100,000 population.)'b. By 1990, reported incidence of gonococcal pel-vic inflammatory disease should be "educed to arate of 60 cases per 100,000 females. (In 1978,the estimated rate was 130 cases per 100,000females,)c.By 1990, reported incidence of primary and sec-ondary syphilis should be reduced to a rate of 7cases per 100,000 population per year, with areduction in congenital syphilis to 1.5 cases per100,000 children under 1 year of age. ('In'1979,the reported incidence of primary and secondarysyphilis was 11 cases per 100,000 populationwhile reported congenital syphilis was 3.7 casesper 100,000 children under 1 year of age.),d.By 1990, the incidence of serious neonatal in-fection due to sexually transmitted agents, espcially herpes and chlamydia, should be reduced'to a rate of 8.5 cases of neonatal disseminatedherpes per 100,000 children under 1 year of age, and.a rate of 360 cases of chlamydial pneumoniaper0100,000 children under 1 year ofages(In 11979, about 16.8 cases of neonatal dissemihatedherpes per 100,000 children undtr 1 year of ageand about 720 eases of chlamydial pneumoniaper, 100,000 children under 1 year 404# wereestimated to have occurred.)e, By 1990, the incidence of nongonococcal ureth-ritit and chlamydial infections should be reducedto a rate of 770 cases ,per 100000 population.(In 1979, the case rate was estimated to be1,140 per 100,000 population.)Reduced risk factorsif.By 1990, the proportion of sexually active menand women protected by properly used condomsshould increase to 25 precent of those at highrisk of acquiring sexually transmitted diseases.(In 1979, the estimated proportion was less than10 percent.)Increased public/professional awarenessg.aBy 1990, every junior and senior high schoolstudent in the United States should receive accu-rate, timely education about sexually transmitteddiseases. (Currently, 70 percent of school sys-tems provide some information about sexuallytransmitted diseases, but the quality and timingthe communication va

32 ries greatly.)h. By 1985, at least 95 pe
ries greatly.)h. By 1985, at least 95 percent of health care pro-viders seeing suspected cases of' sexually trans-mitted diseases should be capable of diagnosingand treating allcurrently recognized sexuallytransmitted diseases, including: genital herpesdiagnosis by culture, therapy (if available) andpatient education; hepatitis B. diagnosis amonghoposexual. men, prevention through a vaccine(When proved effective), and patient education;and nongonococcaldiagnosis, therapyand -patient education. (Baseline data unavail-able.)Improved services /protectioni.By 1990, at least 50 percent of major industries.and Governmental agencies offering screeningand health promotion programs at the worksiteshould be providing sexually transmitted diseaseservices(education and appropriatetesting)within those programs. (Baseline data unavail-able.)Improved surveillance/evaluation systemstly 1985, data should be available in adequatedetail (but in statistical' aggregates to preserveconfidentiality) to determine the occurrence ofnongonococcal urethritis,genital herpes andother sexually transmitted diseases in each localarea, and to recommend approaches for prevent-ing sexually transmitted diseases and their com-plications.k.By 1990: surveillance, systems should be suffi-ciently improved that at least 25 percent of sex-tt,,ually transmitted diseases diagnosed in medicalfacilities are reported, and that uniformefini-tion5are used nationwide. (Baseline d to un-available.)4, Principal Assumptions, Biologic changes in the sexually transmitted diseaseorganisms are likely but unpredictable as to theiroccurrence or effect, therefore they have not beenconsidered.The size of the at-risk sexually-active population isnot expected to change substantially during the ).80s. (Declines in younger age grdttps are expectedtoea cedby increases in nonmonogamous sex-ual activitin a) groups.)During the-nexklecade, the health planning processwill proyide the ,opporturrito influence providersto raise norms and meet guidelines for prevention .and management of sexually transmitted diseases.HSAs willinclude sexually transmitteddiseasesamong other health status indicators, and will in-clude sexually transmitted disease objectives andcontrol measures in their plans...--All health professional training programs will,givegreater emphasis to the prevention, early diagnosisand treatment of sexually transmitted diseases..Medical schools will establish clinicalaffiliationswith public and private sexually transmitted diseasefacilities so that all medical students and physiciansin training will receive supervised clinical experiencein the diagnosis and freatment of sexually trans-mitted diseases.°Support for studies of mechanisms of antibiotic re-,.sistance and for the development of antiviral drugsand new vaccines will continue at 1979 levels.275. Data Sourcesa. To National level onlyAnnual Census of State and County Mental Hos-pitals. Resident patients and new admissions tomental institutions; costs, diagnoses of syphiliticpsychoses. DHHS-Alcoh IDrug aqd MentalHealth Administration,ationalInstituteofMental Health (NIML-1).ental Health Statisti-cal Notes, selected issues; special reports andtabulations furnished to the Center for DiseaseControl (CDC), Venereal Disease Control'vi-sion. Continuing; National sample surveys of.tients in State and county mental hospitals,NationalAmbulatory Medical Care Survey(NAMCS). Patient characteristics, diagnoses ofSTD. D,HHS-National Center for He Alih Statis-tics (NCHS). NCHS Vital and Hollth Statistics,Series 13, selected reports, and CDC, Rivisionof Venereal Disease Control, special tabulation'from tapes provided by NCHS. Continuing; Na-tionalprobability sample, offi

33 ce-based physi-cians.HealthandNutritionE
ce-based physi-cians.HealthandNutritionExaminationSurvey.(HANES). Adults, patient chajracteristics, serio-3,04-2,,f,- g: -i31a.44. alogic tests for syphilis, urine cultures for gono-rrhea. DHHS-NCHS. NCHS Vital and HealthStatistics, Series 11, selected reports. Periodicsurveys; National 'Probability sample.. Hospital Discharge Survey (HDS). Patient staysin short-stay hospitals, patient characteristics,diagnoses, including salpingitis and PID; surgbryand other procedures; length of stay. DHFIS-NCHS. NCHS Vital and Health Statistics, Series,13, selected reports, and special tabulations byCDC, Venereal Disease Control Division fromtapes provided by NCHS. Continuing survey;National probability sample of short stay hospi-tals.glD'Suiveillance. Nofireported as well as re-ported STDs. Patient visits to- VD clinics; age,race, sex, reason for attendance, sexual prefer-ence, laboratory tests and results, diagnoses of14 of the sexually transmissible diseases. DHHS -CDC, Venereal Disease Control. Division.house summaries provide part of basis for Na-'`tional incidence/prevalende estimates of STD in.STD Fact Sheet, HEW Publication No. (CDC)8195, and other program documentations. Con-firming reporting; full count from 7 STD clinics.Gonorrhea Therapy Monitoring Network. Gono-rrhea patients treated with a variety of anti-biotics in varying dosages; post treatment results,winimum. inhibitory concentration of antibiotics.DHHS-dDC, Veneraldisease ControlDivi-sion. Supplement to Sexually Transmitted Dis-eases (Journal of the Arriericen VenerealDis-ease Association) Vol. 6, No. 2, April-June1979.Continuing1971-4979;discontinued1979.The Hepatitis B Collaborative Study. Hepatitisincidence and prevalence among male homosex-uals; sexual behavior modalities. DHHS-CDC,Venereal Disease Control Division and HepatitisLaboratories DivisionResults in preparatioOne time study from five clinics.b. To State an4r local levelNational Case Reporting System (NCRS). Re-ported cases of gondrrhea, syphilis by stage,chancroid, granuloma inguinale and lympho-granuloina; age, race, sex and reporting source(private vs. public)DHHS-CDC, Bureau ofEpidemiology and Venereal Disease Control Di-visiOn. STD Fact Sheet, Publication No (CDC).8195; Sexually Transmitted Disease (STD) Sta-tistical Letter. Continuing full National count ofreported cases, State and major city breakdown,additional .characteristics,e.g., marital status,may be !daily available in some States.Hospitalized illness from discharge abstract sys-,temsProfessional Activities Study (PAS). Patientstays in short-stay hospitals; patient char-acteristics, diagnoses of salpingitis and PID.28Q.IA1Commislan on Professional and HospitalActivities (CPHA), Ann Arbqr,-Michigan.`s.Special tabulations and/or tapes providedto DHHS-CDC, Nenereal Disease ControlDivision.Confirming. reporting fromdis-charge records. Full count of patients dis-charged frets CPHA 1900 member hospitals.Not a probability sample. Extent of hospitalparticipation varies by State.Other hospital, discharge systems as locallyavailable.National Morbidity and Mortality Report-ing System. Numbers of 46 reportable dis-eases; deaths in121 U.S.cities. DHHS-CDC. CDC Morbidity and Mortality WeeklyReport, and anual reports. Morbidity: con-tinuous reporting from State health depart-ments on basis of phAician reports. (Com-pleteness of reporting varies greatly, sincenot all cases receive medical care and notall treated conditions are reported.) Mor-tality: continuous reporting; volunteer panelof health departments in121 U.S. cities,full count.Quarterly Epidemiologic Activity Report (CDC9.2127). Numbter of interviews by disease, con-tacts elicited and examined, medical disposi-tion. DI-I

34 NS-CDC, Vjnereal Disease ControlDivision
NS-CDC, Vjnereal Disease ControlDivision. STD Fact Sheet, HEW Publication No.(CDC) 8195; Sexually Transmitted Disease(STD) Statistical Letter. Continuing reporting-from State health departments; full Nationalcount with project area breakdown.Gonorrhea Culture Results of Females. Numberwomen screened and pdsitive, by type of pro-vider. DFIF15-CDC,' Venereal Disease Control.Division. STD Fact Sheet, HEW Publication No.(CDC) 8195, SexuallyTransmitted Disease(STD) Statistical Letter. Continuing reportingfrom State health departments; National fullcount of federally sponsored gonorrhea screen-ing activity.Infectious Syphilis Epidemiologic Control Rec-ord. Early syphilis interviews; age, race, sex ofcases, contacts, time intervals between,ege re-port and final disposition of contacts. DIIHS-'CDC, V triereal Disease Control Division. STDFact Sheet, HEW Publication No. (CDC) 8195;Sexually Transm,itted Diseases (STD) StatisticalLetter. Continuing reporting from 'State health.departments; National full count..Resultsof Followup ofSerologic Reactors.Reactive serologic tests reported to health de-partments and results of followup. DHHS-CDC,Venereal Disease Control Division. STD FactSheet HEW Publication No. (CDC) 8195;Sexually Trefftmitted Disease (STD) StatisticalLetter. (Pontinuing reporting from State healthdepartments; National full count.VD Laboratdry Surveillance Report. NumberI3Z Vb.of tests for syphilis performed, number positive,type of laboratory. DHHSCDC, Venereal Dis-ease Control Division. STD Fact Sheet, HEWPublication No. (CDC) 8195; Sexually Trans-milted Disease (STD) Statistical...Letter. Con-tinuing Eeporting from State health departments;National full count.4, National Vital Registration SystemPI2933tiMortality. Deaths by cause (including infantdeaths attributable to sexually transniissibledisease's and to syphilis) by age, sex andrace. DHHINCHS. NCHS Vital Statisticsof the UniStates, Vol. II, and N6HSMonthly VitalStatisticsReports. Continu-ing reporting from States; full count. (ManyStates issue earlier reports.).414 4.TOXIC AGENT(NTROL1. Nature and Extent of the ProbToxic agents include, but are nbt limited to, naturaland synthetic chemicals, dusts, minerals, and mate-*rigs which produce acute' or chronic illness. Such,agents may be carcinogenic, mutageniC or teratogenic,and they may adversely affect the reproductive system,nervous sys em, or specific organs such as the liver orkidney. Inced is a toxic agent for the purposes of.this documenare radiationexposures of varioustypes.a.Ilealtk implicationsHealth effects attributed to toxic ages and/orradiation of various types include:qt.acute effects, including systemic poisoning;chronic' effects including teratogenic abnor-malities and growth impairment;,infertility and other reproductive abnormali-ties;skin disorders;cancer;neurologic disorders;behavioral abnormalities;'immunologic damage;chronic degenerative diseases involving thelungs, joints, vascular system, kidneys, liverand endocrine organs.Though the extent to which toxic agents areassociated with disease is not completely known,recent empirical evidence confirms that seriousenvironmental health hazards ekist. New evi-dence unfolds regularly, revealing previouslyunsuspected associations between specific envi-ronmental agents and diseases. The detectionof specific etiologyis greatly complicated be-cause (a) many agents may contribute tothesame diseases, (b) there may be long latencyperiods between exposure. and disease onset,and (c) data are sometimes 'unavailable or inTapprop 'atelysaggregated fdr discovery purpdses.Diseassociated with toxic agents may dif-feren ally affect different age groups, presentand future generations and group

35 s with differenthistories of past exposu
s with differenthistories of past exposure and predisposingconditions.Varying latency associate,d with many chronicdiseases, complex history of previous exposureand other. factors mentioned above make assess-Iment of the magnitude of the. Noblem difficult.-Although current disease incidence and mor-tality data are inaccurate measures, they serveas indicators -Of the effectiveness of existingcontrol and prevention efforts:Objective labor tory measurements of toxicity,levels of contrations, and human biological'effects aressary to characterize effective-ness of control mechanisms and to define bio-chemical sequelae of toxic insults to biologicalsystems.b.Status and trendsSources of environmental health hazards, pres-ently subject to-kederal regulation include:air/water emissions/euents;hazardous waste disposal;transportation of hazardous materials;occupational exposure;products (food 'additiv,pharmaceuticals,pesticides, consume.i.d industrial chemi-cals);radiation ex . re from medical devices,31a4consumer products, food and the environ-ment.The rapid advancement of post-World War Hindustrial Noduction has created substantial in-creases in Al quantity ancl, kinds of substancesand materials which may pose significant health,hazards.It is estimated that of the fout million chemicalcompounds which have been synthesized orisolated from naturalmaterials, more than55,000 are produced commercially. Approxi-mately 1,000 new compounds are introducedannually; pesticide formulations alone containabout 1,500 active chemical ingredients.There may be as many as 30,000 toxic Solidwaste disposal -sites in the United States.Over 13,000 substances currently in commercialuse have been identified as potentially toxic toworkers, with an additional number introducedevery year.Over 2,000 chemicals are susREcled carcinogensin laboratory animals.. Current epidemiologibevidence builds a convincing case for the car-cinogenicity in humans of '26 chemicals and/orindustrial processes.More than 20 agents are known to be associated2. Iwith birth defect, in humans; many times thisnumber are associated with birth defectsinanimals.Of 700 atmbspheric contaminants, 47 have beenidentified in animal studies as recognized car-.cinogens, 42 as suspected carcinogens, 22 theicals as promoters and 128 as mutagens.From over 2,200 contaminants of all kinds id n-tified in mater, 765 were identified in drinkingwater. Of these, 12 chemical pollutants wererecognized carcinogens, 31 were suspected car-cinogens, 18 were:carcinogesk promoters and59 were mutagens. Itisnot known wifat theadditive effects of these chemicals will be on the,total cancer burden.As water resources become in shorter supply,mote and more surface water, used,for drinkingwater, *ill be recycled or reprocessed, con-tinuing the recycling of pollutants unless ade-quate water treatment measures are taken.-Even if carcinogenic pesticides are no longeravaila)31e. for sale by 1990, some will persist inthe environment, in food supplies and in humanbodies for many years.Problems with toxic agents are not only attrib-utable to industry, but also medical and dentalcare (x-rays and drugs), agriculture (pesticidesand herbicides), Government (biological andchemical agents), consumers (incorrect use ofconsumer products which contain toxic sub-stances) and, natural sources (fungal products).Low levels of ionizing radiation can producedelayed effects; such as cancer, after a latentperiod of many years.Fifty percent of thecurrent Unit d States population dose comes'from natural;occurring background radiation,radioactiveatenals in the 'water, soil and air,and cosmic radiation; 45 pernt resultd fromdiagnostid and therapeutic medi al applications.Fa

36 llout, industrialuse, produn of nuclearp
llout, industrialuse, produn of nuclearpower and consumer products account for theremaining 5 percent. Thus roughly half the,,exposure of the population at large comes frommanmade sources./The synergistic effects of exposures to ionizingradiation and toxic agents may greatly increase.cmogenic risks.ention/Promotion 11,easuresa.PotentialmeasureaMany, of the measures oittlinell below need tobe carried out by environmehtal and healthregulatory and research agencies. Mechanismssuchas. the InteragelYeritegulatofy Liaison,Group (IRLG) are esseqtial tocoordinife theiractivities in areas of:assessing agent toxicity;assessing the number of persons at risk froma particular agent and estimating intensityI.323r-of exposures and conditions pf exposure asthey affect risk;technology assessment and development;economic impact analyses;developing- generic or group standards forclasses of toxic substances;pooling limited ,technological resources re-quiredtocontrolenvironmentalhealthhazards;establishingeffective mode(s) of controlfor each agent.Education and information measures include:informing the public that exposure to baz-ard9us agents is serious, but manageable;anclthat government control measures areessential;- through television announcements;through establishing a, system to warnconsumers and workers of possible car-cinogens, teratogens, or other toxic sub-stances so that precautionary actions toprevent health effects may be exercised;,- through providing information ionthecontrolof environmental and occupa-tional 'healthhazardstoteachers andstudentsinelementary and secondaryschools within the context of comprehen-sive mandatory classroom health educa-'tion;educating health professionals and directorsin industry about toxicology, epidemiology,industrial by ene, medical surveillance, con-.trol technologdesign and hazardous sub-stance control;expanding sensitivity of practicing Physi-cians, nurses and other health professionalsin the 'diagnosis of environmental and occu-pational diseases and associated reportingresponsibilities;educating. managersofindustrialfirmsthrough both their training curricula andthroughcontinuingeducation(especiallythose trained in chemical and mechanicalengineering, law and business administra-tion );staffing the regulatory agencies with well-trained professionals, not only in the sci-ences, medicine and engineering, but alsoin policy analysis.Service measures include:'.relating diseases to toxic agent exposuresand providing appropriate Medical care;screening and diagnostic services for indi-viduals with suspected exposure totoxicsubstances, and treatment as necessary.Technologic measael include:,timely efforts to encourage and/of upgrade:- instrumentation and laboratory operationsfor hazard detection and monitoring; labo*ratory standardization programs to,,insure validity and interlaboratory com-parability oLdata;emission and =effluent control technology;hazardous age-radioactive waste disposaltechnology;manufacturing process design;-- new product development andtesting fordeleterious health efficts.;. Government assistance in-developing con-trol technology and process redesign wherethe industrial incentives or requirements forsuchdevelopment are lacking;technology to control nuclear wastes andrtain classes of hazardous waste and tech-nology to minimize transportation risks;technology improvements including modifi-cation of current technology and develop,ment of newagnostic tools to reduce theamount of ra iation required for medicaland dental diaosis and treatment;\.sharing of control technology informationamong the regulatory agencies and jointtechnology development among agencies toaddress related problems;technology-forcing reg

37 ulatory initiatives toencourage process
ulatory initiatives toencourage process redesign and new productdevelopment.Legislative and regulatory measures include:enforcement of major environmental lawscontrolling hazardous substances:Clean Air Act;Clean Water Act and the Safe DrinkingWater Act;.4c-- ResourceConservation and Recovery Act(regulatinghazardoussubstancesdis-posal);Toxic Substances Control Act;Federal Hazardous Substances ControlAct;Consumer Product Safety Act;Federal Environmental Pesticide ControlAct;The Food, Drug, and Cosmetic Act;HazardousSubstancesTransportationAct;.Atomic Energy Act._ _.National Environmental Protection Act;Occupational Safety and Health Act;FederalInsecticide, 1 Fungicide,andRcidenticide Act;Radiation and Safety Act.ensuring, the comprehensive application ofthearildws; certain groups of chemicals andclasses of substances are now exempted fromexisting testing and regulatory authorities;grouping of toxic agents into -classes for., bothtesting and regulatory action under alls'toxic substances control law; continuing to3336plaCe the burden of obtaining an exemptionfrom a class rule on the manufacturer sincesimilar .compoubds ,canhavedifferingtoxicities;labeling, hazardous ingredients in'trade nameproducts, to address both the content of theproduct with erespect to potentially hazard-ousubstances and directions for propere and disposal of the chemical (a pre-requisite. for both effective hazard recogni-tion and the implementation 4...appropriatecontrol measures);fulldisclosure of health-relateddata to'potentially affected parties, including toxi-cological and epidemiological data, in vitrotests, elemental analysis, molecular stpic-turestablishing priorities and developing morestairards for hazardous substances itbothair; end water(e.g.,careful attention toambient air standards as elFigy programsare implemented);` establishing, State systems for monitoringpollution from both diesel and convention-ally powered vehicles;ex`Pediting promulgafion of regulations de-.fining categories of hazardous materials.dis--posal under the Resource Conservation andRecovery Act (RCRA) and coordination oftheir control;identifying and detoxifying pa,st hazardoussOstance disposal sites, and prioritizing theaction taken on sites to reflect the magni-tude of the public health risk;--,requiring sufficientscreening examinationby the manufacturer (before marketing) forthe full minge of health effects for all newchemicals for which there may be potentiallysenious risk to, health/environment;withholding frbm introductioninto com-merce new chemicals that pose a significantpliblic health threat unless the' manufacturercan denionsitale that there are safe andpractical methods for-their manufacture, in-.tended uses and disposal;implementing expedited procedures to re-move from the market consumerproductscontaining known carcinogens, teratogensand mutagens;,controlling intensive use of pesticides toachieve marginal or questionable productionincreases;implementing integrated pest managernent;establishing it as I condition for perm4s touse the more hazardous pestilliides;developingand .implementingimprovedstandards for transportation containers andinspection standards for vehicles and routesof transportation for hazardous substances,with .particular emphasis on railroad safety; developing -an" adequate system of records oftoxic substances being transported;establishingcentralized National occupa-tional records ofradiation exposureofworkers to include exposure to all types andlevels of radiation, including records forpart-time workers;establishingsiting -criteriaforindustriesusingradioactivematerials(toprecludesuch events as the recent contamination offood in a grammar school cafeteria);-Thes%b

38 lishing approved routes for transpor-tat
lishing approved routes for transpor-tation of nuclear fuels and nuclear wastes-.designed to avoid metropolitan areas andpotential watershed contamination.Economic measures include:taxation and legal redress:effluent/emission taxes(using effluent/emission taxes as supplements to, andnot replacements for, regulation tiq createadditionalincentives for hazard abate-ment);favorable tax treatment of investment inpollution control;legal redressfor harmresulting fromexposure to toxic agents.tax policies encouraging capital investmentin redesigning process technology to em-phasize process improvement over add-ontechnology;amendingthelimitedliabilitypiinciplesappliedtoreactorsafetybythePriceAnderson Act in measures that deal withthe effects of toxic substances.b.Relative strength of the measuresExerting effective controlinthese areas bymeans appropriate to each is complex. Stepsare required 'to ensure that Federal regulatoryefforts are adequately coordinated, that they areanticipatory rather than reactive in dealing with,the problems of a rapidly changing industrialproduction system and that they are appropri-ately attentive to protecting the public health.Thereare - inherentand complicatedinter-relationships between regulatory and economicand technologic measures applied to protectingthe public from the hazards of exposure to toxicagents.The most effective measures may well be tech-nologic, but their development and applicationdepends upon adequate regulatory support andeconomic incentives.-Industry, which is the principal target of mostefforts to reduce exposure to toxic agents, ismost likely to be responsive 16 economic incen-tives.Education of the pu licof particular impor-tance,- given the sutialcounterpressuressPoffered by conflicting social values (e.g. energyproduction) and by existing adveyiffitig efforts.The pressures which drive the demand for in-creased consumption must be reconciled withan increased demand for protection of healthor the% environment. Resolving these conflictingsocial goals has been attempted (a) by pro-viding legislative guidelines and directives inindividual environmental laws, (b) by giving-extensive discretionto agency administrators,(c) by requiring economic impact statementsthrough Presidential directives, and (d) by in-troduction of Federal legislation requiring regu-latory impact analysis. To the present, the bal-ancing of social goals and the fulfillment ofregulatory mandates have been reviewed by thecourts with unpredictable results.3. Specific Objectives for-1990Improved health statusImprovements in the control of toxic agentscan be expected over the longer term to yieldreduced rates (or slowing in the rates of in-crease)for cancer, birth defects, respiratorydisease, kidney disease, nervous system diseaseand other acute and chronic conditions. Be-cause of uncertainties in the quantification ofthe exposure-to-disease relationship (short andlong term), the statement.of measurable healthstatus objectives at this time has been limitedto the two noted below.a.By 1990, 80 percent of communities shouldexperience a prevalence rate of lead toxicityof less than 500/100,000 among children ages0 to 5, especially age 0 to1.(In 1980, theestimated prevalence of lead toxicity Nationallyexceeds 1,000/100,000.)34*NOTE: Lead toxicity is defined as an erythro-cyte protoporphyrin level exceeding 50 ug/dLwhole blood and a blood lead level exceeding30 us/di.b. By 1990, virtually no individual should sufferbirth deforiscarriage as a result of expo-sure to ais chemical disposed after imple-mentation of the Resource Conservation andRecovery Act. (Baseline data uraT"Arle.)Reduced risk factorsc.By 1990, virtually all communities should ex-peri

39 ence no more than one day pee:year whena
ence no more than one day pee:year whenair quality exceeds an individual ambient airquality standard with respect to, sulfur dioxide,nitrous' dioxide, carbon monoxide, lead, hydro-carbon and particulate matter. (In 1979, thelevel was estimated to be about 50 percent.)By 1990, at least-95 percent of the populationshould be served by community water systemsthat meet Federal and State standards for safedrinking water. (In 1979,, the level was 85 tod.3" a90 percent .fot the National Interim PrimaryDrinking Water Standards.)6713 y 1990, there should be virtually no prevent-_able contamination of ground water, surfacewater or the soil from industrial toxins asso-ciated with wastewater management systems es-tablished after 1980. (Baseline data unavailable,but EPA is starting a series of programs toprevent ground water contamination in 1980that should shod' results by 1990.)f.By 1990, thsafe should be no pesticides, herbi-cides, fungicides, or rodenticides available forsale which are known to be carcinogenic, terato-genic or mutagenic in man, unless determinedto be vital to the National interest under certainconditions. (Baseline data unavailable.)By 1990, inhalation of fumes from toxic mate-rials during :transport of such materials shouldbe eliminated. (Baseline data unavailable.)h. By 1990, the number of medically unnecessarydiagnostic x-ray examinations should be re-duced by some 50 million examinations annu-ally. (In 1979, the number of diagnostic x-rayexaminations performed in the United Statesannually was 278 million, of which 83 millionwere estimated to be medically unnecessary.)Increased public/professional awarenessi.By 1990, at least 75 percent of all city councilmembers in urban communities should be ableto report accurately whether or not the quality,of Their air and water has improved or worsenedover the decade and to identify the principalsubstances of concern. (Baseline data unavail-able.)By 1990, at least half of all adults should beable to accurately report an accessible source ofinformation on toxic substances to which theymay be exposedincluding information on theinteractions with other factors such as smokingand medications. (Baseline data unavailable.)-'1. By 1990, at least half of all people -ages 15 yearsand older should be able to identify the majorcategories of environmental threats to healthand note some of the health consequences ofthose threats. (Baseline data unayailable.)1.By 1990, at least 70 percent of all primary carephysicians should be able to identify the princi-pal health consequences of exposure to each ofthe major categories of environmental threatsto health. (Baseline data unavailable.)Improved services/protectionm. By 1990, at least 90 percent of'all childrenidentified with lead toficity in the 0 to 1 'agegroup (especially those age 0 to 1) should havebeen brought under medical and environmentalmanagement. (Basettne--brau-navallable.--AV--proximately 34,000 children ages 1to 5 withlead toxicity are reported annually from Fed-erallyaupported programs, and an estimated oneg........I*percent of the U.S. population ages 1 to 5 havelead toxicity.)n. By 1990, the Toxic Substances Control Act andthe Resource Conservation and Recovery Actshould be fully implemented to protect the U.S.population against hazards resulting from pro-duction, use, and disposal of toxic chemicals.(Baseline data unavailable.)o.By 1990, individuals purchasing a potentiallytoxic product sold Commercially or used indus-trially should be protected by clear labeling asto content, as to direction for proper use anddisposal, and as to factors that may make thatindividual especially susceptible (health status,age, sex, medications, genetic traits). (Bas

40 elinedata unavailable.)p.By 1990, every
elinedata unavailable.)p.By 1990, every individual should have access toan acute care facility with the capability to pro-vide, or !make appropriate referrals for screen-ing, diagnosis and treatment of suspected ex-posure to toxic agents. (Baseline data unavail-able.)By 1990, -every individual residing in an area ofa population density greater than 20 per squaremile, or an area of particularly high risk, shouldbe protected by an early warning system de-signed to detect the most serious environmentalhazards posing imminent' threatstohealth.(Baseline data unavailable.)r.By 1990, every populated area of the countryshould be .able To be reached within 6 hours byan emergency response. team in the event ofexposure to )an environmentalhazard posingacute threatsto health from atoxic agent,chemical and/or radiation. (Baseline data un-available.)ImProved surveillance/evaluation systemss.13y 1990, a broad scale surveillance and moni-toring system should have been panned to dis-cern and measure known environmental hazardsof a continuing nature as well as those resultingfrom isolatellajncidents. Such activities should' becontinuously carried out at both Federal andState levels.t.By 1990, a central clearinghouse for observa-tions of agent/disease relationships and hostsusceptibility factors should be fully operational,as well as a National environmentaldata registryto collect and catalogukOrformation on concen-trations of hazardous agents in air, food andwater.q.4. Principal AssumptionsControl and prevention measures will continue to bedeveloped within a framework reflecting Federalregulatory efforts developed during the 1970s.Consumers and workers will have ready access tocentral information sources (like Poison ControlCenters) describing major substances or . productsknown to be toxic, their known interactions with.......3538 Flife style behaviors such a smoking and medica-tion's, insofar as these are known, and recommendedactions to be taken.The capability to trace the genecatimfransport,disposal and ultimate fate of various agents throughthe various environments relevant to public healthwill continue to be enhanced.Permissible exposure levels and individual harmfullevels will reflect real-world multiple exposures, thehistory of previous exposure, individual susceptibil-ities and the effects of aging, and will accommodatequalitative and quantitative differences in the healthconsequences of toxic substance?,exposures in theprenatal and perinatal periods.A substance-by-substance regulatory approach alonewill not be able to solve a large proportion of publichealth problems traceable to toxic agents.In designing a regulatory strategy, potential healthproblems arising from technology will be antici-pated.Schools for the health professions and continuingeducation programs will have evaluated their cur-ricula so that by 1990 health jorofessionals willreceiving training in toxicology and in the healthconsequences of environmental exposure to toxicagents.An integrated health education curriculum in mostpublic school systems will include information ontoxic substances, their relationship to the environ-ment and the students' role in protectingtheirhealth.Control technology will have been developed fordealing with the major known toxic agents.Programs will be operatiltg'to replace pesticides thatshow high acute toxicity and/or carcinogenic orteratogenic effects by safer substances or approaches(suclias integrated pest management). They will betargeted in each year to the 10 percent most hazard-ous materials in us.Transportation Of toxic and radioactive materialswill be fully regulated.State systems of mobile source monitoring for bothdiesel and conventionally poWer ve

41 hicles will beoperational.The.National w
hicles will beoperational.The.National water quality goals for 1984 of fish-"kable and swimable water will have been met andmaintained.Performance standards in hospital and ambulatory/patient care situations involving exposure to toxicagents will be operational.Sufficient penalties will be attached to toxic agentpollution to provide strong economic incentives toabate.Industrial investment for reducing exposure to toxicagents will receive favorable tax treatment.A strict liability system for industrial waste disposalwill be operational.By 1985;-a plan will have been developed to pro-tect humans from the consequences of toxic agentsin existing sites of toxic solid waste'disposiL (Ap-365.proximately 30,000 solid waste disposal sites may lieinvolved. Proposed "Superfund" will be used toclean up the worst sites.)Data,Sourcesa. To National level onlyNationwideEvaluationofX-rayTrends(NEXT). X-ray examination dosimetry, distri-bution of exposure levels by type of examina-tion, type of facility and type of equipment.DHHS-Food and Drug Administration (FDA).Periodic reports. Continuing reporting from par-ticipating State radiation control programs.Breast Exposure: Nationwide Trends (BENT).Mammography dosimetry, distribution of radi-ation exposure levels of x-ray equipment used inmammography. DHHS-FDA. Periodic reports:'Continuous reporting from participating Stateradiation control programs.DentalExposureNormalizationTechnique(DENT). Data on dental x-ray exposure, dis-tribution of radiation exposure levels of dentalx-ray equipment used in dental facilities. DHIIS-,FDA. Periodic and annual reports. Continuous_reporting from participating State radiation con-trol programs.Birth Defects Monitoring Program. Birth defectsdiagnosed.at birth, by major types. DHHS-CDC.CDC quarterly report, Congenital Malforma-tions Surveillance Report. Continuing analysisof data reported on hospital discharge abstractsfrom hospital members of the Professional Ac-tivhies Study RAS), Commission on Profes-sional Hospital Activities. (Not a random sam-ple of hospitals.)National Occupational Hazard Survey. Inven-tory of work hazards. DHHS CDC, Nationaljnstitute for Occupational Safety and Health(NIOSH). National Occupational Hazard Sur-vey Records, Vol. 1-4, 15974-1979. Survey willbe updated 1980-82. Data obtained film on-siteinspectionsof800 industrialfacilities,1972-79.HealthandNutritionExaminationSurvey.(HANES). Levels of various toxic agents inblood obtained from laboratory tests. DIMS,.NCHS. HANES II, 1979. Reports- willf appearin NCHS Vital and Health Statistics, Series 10.Toxic Effects. Listing.of chemical substances forwhich toxic effects have been reported. DHHS-CDC, NIOSH. NIOSH Reports of Toxic Effectsof Chemical Substances. Annual reports derivedfrom endings reported in journal literature.b. To State and/or localEarly and Periodic Screening, Diagnosis andTreatment (EPSDT) reporting system,f Leadpoisoning detectedamong children screened, andreferral. DHHS-Health Care Financing Admin-istration (HCFA), Office of Research,'Demon- .51strations and Statistics (ORDS).'MedicaidSta-tisfics,selected reports. Continuous reportingfrom State Medicaid Offices.Lead based paint poisoning prevention. Numbeichildren screened for lead toxicity, number poti-tive, number brought under enmental andmedical managementinrticipatingareas.CDC Laboratory Quarterlyeport, Surveillanceof Childhood Lead Poisoning, United States.DHHS-CDC. Quarterly deport. Continuous re-portipg from States.Surveillance,Epidemiology and End ResultProgram (SEER). Cancer incidence, morbidity4#4.4.andsurvival.DHHS-NationalInstitutesofHealth, National Cancer Institute. Periodic re-ports from cancer registries, selected geographic

42 teas.National Aerometric Bank (NADB). Me
teas.National Aerometric Bank (NADB). Measure-ments on the five pollutants for which NationalAmbient Air Quality standards have been set.Environmental Protection Agency (EPA). Na-tional Air Quality Monitoring and EmissionsTrends Report, 1977, and continuing reports.Research Triangle Park, N.C. Continug re-porting, quarterly, from 3,400 pollutioncontrol.agencies.374uAN*"a.-__JA.."Ia tiOCCUPATIONAL SAFETY AND HEALTH1. Nature and Eitent of the ProlikmOccupational illnesad injuries ar of human brigin,and thus preventable.ith approxiately 100 million-workers in this country occupation_1 hazards can pose,a serious threat to hea. Workconditions can yieldd6ly exposure to suchlcs as: toxic chemicals, asbes-L..tos, coal dust, cotton,ionizing radiation, physicalhazards, excessive noise, as well as stress and routinizedtrivial tasks. A broad-range of health problems may beassociated with such exposures, including cancers, lungand heart diseases, birth defects, -sena* deficits; in-juries and psychological problems. Steps important to--''protecting the health of workers include not only edu-teflon of workers about; potential hazards, but engi-neering modifications to control hazards, regulatoryefforts to promote weorker safety, and additional re-search to identify the full range of occupational safetyaid health problems.4It must be recognized that qtere are limitations to thebility of regulatory agencies to contribute to thechievement of these objectives. ThOccupationalSafety4jd Health Administration and thc Mine Safetyand Health Administration are responsible for settingand enforcing t tandit's s tcontrol work place hazards,but the enabling le. tr At. for both of these agencies.Wiltholds employers rcfora healthful and safework environn\ent. !etinglase objectives will re.-Ohre a-concerted Nationalffoinvolving a commit-ment from not only regulatgencies, but Also em-ployers and employee organizations..-a.HealltkimplicationsOccupational illness .:%,..%Ay,occupational exposure to toxic chemicals andphysical bards such as dust from asbestospsilica, graid and cotton; fumes from chemi-chls; noise; ionizing radiation; sunlight andvibration. --can all produce various problemssuch as lung disease, cancers, sensory loss,'skin disorders, degetierAtive diseases in anumber of vital organ systems, birth defectsor genetic changes; these toxic effects maybe acute or chronic;occupational exposures to some. agents canalso increase the frequency of 'stillbirths,4.\ spontaneous atortioni,reduced fertility andsterility;in addition to the burden of permanent and3941paltial disability brought on by job-relateddiseases, the National Institute for -Occupa-tional Safety and Health (NIOSH) estimatesthat each year 100,000 Americans die fromoccupational illnesses; nearly 400,000 newcases of occupational diseases are recognizedannually; although these estimates made byNIOSH for the May 1972 President's Report' on Occupational Safety and Health are con-troversial, no better' estimates are availablefrom the presently inadequate reporting ofoccupational disease;skin diseases are the largest group of occu-pational illness (43 percent in 1976), fol-lowed by repeated trauma (14 percent);about 15 percent of coal miners exhibit somechest x-ray evidence of coal workers' pneu-moconiosis, and black lung disease may beresponsible for 4,000 deaths each-year;recent studies suggest that occupations assn=ciated with handling wood and wood prod-ucts have increased risk el-certain cancers;an estimated 1.6 million presePt and formerasbestos workers have increased risk of deathfrom asbestos-related diseases such as hingcancer, mesothelioma and asbestosis;the lung cancer rate among coke oven work-ers is about 1

43 0-times the National average;an estimate
0-times the National average;an estimated 2 million workers have been ex-posed to benzene and 2 to 3 million to vinylchloride, chemicals thought to cause cancer;job-related stress, ergonomic issues, andjob ,design also contribute to illnessin--jury (in both service and manufacturinsec-tors) to an undeermiqed degree.See Misuse of Akohol and Drugs and Con-trol ofStress and Violent Behavior.Occupational injuryin 4978, work accidents resulted in 4,590deaths;Jin 1977, more than 2.3 million workers ex-perienceddisablinginjuries(80,000 ofwhich were permanently disabling);the injuries span a wide spectrum including:electrical shocks, falls, crushes, motor vehi;de accidents, burns and eye injuries;workers in mining, agriculture (includingforestry and fishing) and coristructiog aresix, three and three times, respectively,Its likely to die from a work-related injury thanother private sector workers;slips and fails are often due to lack of goodhousekeeping at the job site;poor architectural design such as incorrectplacing of stairs, wrong height of stair lifts,improper lighting and ventilation, and im-proper engineering of equipment can contrib-ute to or cause illniss and injuries.b.Status and trends, 'Occupational illness...gtoxic effects have been reported for nearly45,000to50,000 chemicalswhicharethought to appear in the workplaceover2,000 of which are suspected human circino-',glaboratory animals;one survey has indicated' that 9 out of 10American industrial workers may not be ade-.guately protected from exposure to at least1 of the 163 most common hazardous indus-trial chemicals;v.. approximately 21 million American workers.are exposed to substances regulated by theOccupational Safety and Health Administra-tion. ,,Occupational injury.8.direct and indirect costs of occupational acci-"tents are estinfited at $20.7'billion per year;each year about one worker in nine in privateindustry experiences an occupational injury;-iin 1978, there were, on average, 9.2 injuriesand illnesses and 62.1 lost workdays per 100full-time workers;-7 Worker's Compensation ,paymentsin 1976($7.5 billion) were up 14 percent from 1975and were three times thelevel of 19615;between 1976 and 1977, the n mber ofwork-related injuries increased fro5.0 mil-lion to 5.3 million, the number of workdayslost increased from 32:5 million to 35.2 mil-'lion, the average days lost per injury de.:_. ..n..creased from 17 days to 16 days, andothenumber of fatalities increased for companieswith 11 or more employees from 3,940 to4,760; these data show 'aggregate trends,however, they do not reflect the relative'severity Of different injuries.2. Prevention/Promotion Measuresa.Potential measuresEducationreviewinformationecommenasures itJude:ding, initiating and pub-licizing occupational health and safety 'stand-.ards,procedures, controls, and practicesnecessary for assessing, monitoring, control-ling, and eliminating on-the-job .health andsafetyhazards,includingenvironmentalhealth requirethents;I40.T1initiating, as a management responsibility inconcert with workers and their representa-tives, experimental and innovative educa-tional programs regarding exposures to andcontrol of_ occupational health and safetyhazards;initiating and expanding methods designedto motivate labor and management responsi-bility for the development and maintenanceof a safe and healthful work-and community.environment;.developirliaNvarene,ofthe potential inter-actions between occupational health hazafdsand lifestyle habits and behavior and theireffects on health;;developing worker awareness through label-ing, electronic and print media, vocationaltraining programs, health care providers;campaigns aimed at high-risk worker. groups(e.

44 g., asbestos workers, newly employed and
g., asbestos workers, newly employed andelderly workers) and organized labor. pro-grams;developing professional occupational healthand safety personnel including occupationalhealth physicians and nurses, industrial hy-gienisti,toxicologists and epidemiologistsand including occupational health educationinthe curricula of medical and nursingschools and continuing education;developing awareness in other groups thateither interact with workers or the work-.place, including engineers, managers, teach-ersliocial workers arid health care workers;developing public awareness of occupationaldisease and injuries and their high cost to theNation;labeling in simple language to inform work-ers, employers, health professionals and thepublic of the hazards, the associated risksand symptoms as appropriate;..including occupational health as part oratecomprehensive health education' curricula inhigh schools and vocational schools.Service measures include:well-designed corporate occupational healthprograms that idpreventive and treat-ment services d rectat nonoccupational aswell as occupat. nal health;,--consultation services of Governmental agen-cies to assist businesses to identify problemsand to establish suitable 'programs to elimi-,nate or control them;encouraging small businesses to form coop-erative groups to seek occupational healthexpertise;.developing a personal health service deliverysySti.in in which the diagnosis and treatment.of occupational illnesses and injuries will becoordinated and integrated with all other42 health services provided the-worker and hisfamily;upgrading capabilities of State and localhealth.departments to participate in occupa-tional health and safety services, includingmpnitoringYsurveicce and consultation tosmall businesses.go Technologic measurds include:7- improved architectural and engineering de-sign of worksite to prevent injuries;control technology to proisejeoreftrerS, in-cluding development of sari substitutes fortoxic substances, design of proceis unitsthat eliminate worker exposure, design ofsafe maintenance procedures and design ofjobstoeliminateharmfulphysicalandmental stress;measurement technology to enable quick,accurateand economicalassessmentofhazard levels in the workplace by workers,employers or health professionals.1,Legislative and-regulatory measures include:fully implementing the OSHA/MSHA andother laws related to workers' health as wellas the product control provisionsof theToxic Substances Control Act and the Con-sumer Product Safety Act;recommending,initiatingandevalua tingmeasures designed to improve and expandoccupational health and safety legislation,paying particular attentiontopossibilitiesof standardizing benefits through a nationalsystem of worker's compensation;developing criteria doCUments recommend-ing standards, (NIOSH) ;promulgating new health standards on haz-ardous substanCes (OSHA);'annual inspections by industrial hygienistcompliance officers;conducting mandated industrywide studies.and Health Hazard Evaluations /or carcino-genicity, reproductive effects, and other haz-ards that could lead to Emergency Tempo-rary Standards;1-- changing Worker's Compensation Laws toprovide stronger economic pressures on em-ployers to reduce hazardous conditions atthe worksite.Economic measures include:fines and negative publicity for poorly con-trolled health and safety conditions;tax deductions and other economic incen-tives fbr capital investment in controltech-nology or occupational health programs.b. Relative strength of the measuresGiven the broadnature,and scope of occupa-tional safety and health problems, the relativestrength of the measures-varies with the problem41'at hand, with the nature and adequ

45 acyof en-forcement effort and social and
acyof en-forcement effort and social and political supportand with research capacity. Most occupatipnalhealth problems require the simultaneous orconsecutive application of several types of mea-sures as ,a total strategy to comprehensivehaz-ard eradication. For example, eradication of theasbestos hazard might be achieved by:banning all nonessential uses -of asbestos;substitutionofothereffectivematerialsfound to be nonhazardous;research to deterrnine physiologic effeCts ofhuman exposure to the asbestos fiber;worker information to minimize exposurethat may still occur during demolition andrepair work;rigidenforcementofasbestosstandards,Ifhile use remains necessary;rofessional education for physicians to, as-sure proper medical help for exposedindi-viduals.This type of eradication program focuses publicattention on the problem and goes beyond estab-lishing('-P. standardforpermissible exposurelevels.3. Specific Objectives for 1990 or Earlier- Improved-health statusa.By 1990, workplace accident deaths for firms oremployers with 1\1, or more employees should bereduced to less than 3,750 per year. (In 1978, -there were 4,170 work-related fatalities for armsor employers with 11 or more employees!)eb. , By 1990, the rate of work-related disabling in-.juries should be reduced to 8.3 cases -per BOfull time workers. (In 1978, there were approxi-4'mately 9.2, cases per 100 workers.)4c.By 1990, lost workdays dueto Injuries shouldLabe reduced to 55 per 100 workers annually. (In1978, approximately 62.1 days per 100 workerswere lost.)d.By 1990, the incidence of compensable occupa-tional dermatitis should be reduced to about60,000 cases. (In 1976, -there were approxi-mately 70,000 cases involving compensation.)e.By 1990, among workers newly exposed after1985, there should be virtually no new cases offour preventable occupational diseasesasbes-tosis,byssinosis,silicosisand coal worker'spneumoconiosis. (In 1979, there were an esti-mate!. 5,000 cases of asbestosis; in 1977, anestimated. 84,000 cases of byssinosis were ex-pected in active workers; in 197* an estimated60,000 cases of silicoSis were expected amongactive workers in mining, foundries, stone, clayand glass products and abrasive blasting;in1974, there were an estimated 19,400 cases ofcoal workers pneumoconiosis.)f.By 1990,..the prevaleigfrof occupational noise-inducedhearing loss shouldbe reducedto434 (V\415,000 cases. (In 1975, there were an esti-,mated 462;000 cases of work-related hearingloss.)g.By 1990, occupational heavy metal poisoing(lead, arsenic, zinc) should be virtually elimi-nated: (Baseline data unavailable.)Red* risk factorsh. -By' 1985, 50 percent of all firms with more than500 employees should have an approved plan ofhazard control for all new processes, new equipment and new installations. (Baseline data un-available.)iBy 1990, all firms with. more than 500 employ-ees should have an approved plaof hazard'control for all new processes, ntequipmentaql new installations.(liaselineata unavail-able.)Improved public/professional awareness1.By 1990, at least 25 percent .of workers shouldbe able, prior to employment, to state the na-ture of their occupational health and safety risksand their potential consequences, as well as beinformed of changes in these risks while alitployed. (In 1979, an estimated 5 percent orworkeriweie fully informed.)k. .By 1985, workers should be routinely informedof lifestyle behaviors and health factors thatinteract with factors in the work environment toincrease risks of occupational illness and in-juries. (Baseline data unavailable.)1.'By 1985, all workers sId reeveminenotification in a timelyer ofalthexaminations or personaleuiements taken on work environments directl

46 y rlaced to them. (Baseline data unavail
y rlaced to them. (Baseline data unavailable.).m. By 1990, all managers(st industrial firms shod!!be fully informed about the importapce of andmethocli' for controlling human exposure to theImportant toxic agents in their work environ-ments. (Baseline data unavailable.)n.By 1990, at least 70 percent of primary healthcare providers should routinely elicit occupa-.tional health exposures as part of patient his-tory, and should4dow how to interpret the in-formationtopatientsinanunderstandablemann.aseline data uriavailablo.)B990, at least 70 percent of :all graduateengineers should be skilled inthe desioplants and processes that 'incorporateupa-tional safety and health control techno(Baseline data unavailable.)Improved services/proteCtionp.By 1990, generic standards-and other forms oftechnology transfer should be established, wherepossible, for standardiied employer attention toSuch major common 'problems as: chronic lunghazards, neurological hazards, carcinogenic haz-ards, mutagenic hazards, teratogenic hazardsand medical monitoring requirements.Cq. Bj 1990, the number of health hazard evalua-;,dais being performed annually'should'increase-tenrold; the number of inditstrywidestudiesbeing performed annually should increase three-fold.(In1979, NIOSH performed approxi-mately 150 health hazard evaluations; 50 indus-trywide studies were performed.)Improved surveillance/evaluationr.By 1985, an onerm occupational health haz-ard/illness/injury coding system, survey andsurveillance capability should be developed, in-cluding identification ,of workplace hazards andrelated health effects, including cancer, coronag/heart disease and reproductive effects. This sys-tem should include adequate measurements ofthe severity of work-related disabling injuries.,s,--. By 1985, at least one question about lifetimework history and known exposures to hazardoussubstances should be added to alL appropriateexisting health data reporting systems,e.g.,cancer registries,hospital discharge abstracts-aid death certificates.t. By 1981; a program should be developed to:1) follow up individual findings from healthhazard and health evaluations, reports fromunions and management' and other existing sur-veillance sources of clinical' and epidemiological.data; and 2) use the .findings to dEtermine theetiology, natural history and mechanisms of sus-pected occupational disease and injury.r.cipal Assumptionstintrol technology will have been developed in theublic and private sectors to reduce many majorworkplace. hazards.A regulation program will have been developed forpre-evaluation and approval of hazard control plansfOr, all new processes, new equipment and newinstallations.Greater use will be made of relevant State and localGovernment agencies, as well as those academicunits which can address occupational safety andhealth problems.ComprehensiVe school health education curriculawill incorporate concepts of occupational illness andinjury including the role of lifestyle and personalhabits (such as smoking and alcohol consumption)and the level of hazard foithe individual with occu-pational exposures(e.g.,asbestos and smoking,vinyl chloride and excessive drinking).Growing awareness of the importance of preventingoccupational disease and injuries will facilitate legis-lative incentive to support the recommendations.Coordinated State and local implementation systemsforrecognitionand preventionofoccupationalhealth and safety hazards will have been developed.Quality controlin thedeliveryofoccupationalhealth and safety services willbe improved.Workers in the-public sector will be extended thesame protection as those in the private, sector. 5: Data Sourcesa. Ta National. leiel oalyNational Occupati

47 onal Hazard Survey: Inven-'tory of work
onal Hazard Survey: Inven-'tory of work hazards. DHHS-Center for Disease,Control (CDC), National Institute for Occupa-tional Safety and Health (NIOSH). CDC Na-tional, Occupational Hazard Survey Reports,Vol. 1-4, 1974-1979. Survey to be updated198071982. Data obtained from on-site inspecttipns of 800 industrial facilities 1972-79.HealtIhazardevaluation andindustrywidestudies. Morbidity, mortality and environmentalstudies. DHHS-CDC, NIOSH. Selected NIOSHTechnical Reports. Ccintipuous reporting.Occupational injury and illness. Job related in-ury and illness rates. Bureau of LaborStatistics.Amlual reports, Chartbook of Occupational In-Lc .3164-256 0 -- 4a43IPrb..juries and Illnesses (summary' tables). Continut-ous reporting; National sample.Surveillance,Epidemiology and& End ResultProgram (SEER). Cancer incidence, morbidityandsurvival:DHHS-NationalInstitutesofHealth, National Cancer Institute. Periodic re-ports.ContinuouS reporting fromState,andregional cancer registries.Mine injuries. Injuries per hours workDe-partment of Labor-Mine Safety and Healthministration. Quarterly reports. Mine Injuriesand Work Time. Continuous reporting fromworkplace.To State and/or local levelState Worker's Compensation Systems.OCcupa-tional-illness and ,injuries. Data collected by offi-cial jState agencies. Sometimes analyzed in forrnto permit incidence estimates.r0 ACCIDENT PREVENTION AND INJURYCONTROLv.414. Nature and Extent of the ProblemThe principal causes of disability and death from' in-juryjury are those associated with motor vehicles, falls,.drownings, burns, poisoning and gunshot wounds.Most such deaths and injuries occur while driving, inthe home -or at work; many are alsoassociated withrecreation and sports.See Pregnancy and InfantHealth, Toxic Agent Control, Occupational Safetyand Health, Smoking and 'Health,Misuse of Alcoholand Drugs.INDa. Health implicationsUnintentional injuries are the leading causeofdeath for people between1and 38 years ofage, and a leading cause ofdisability.Minorities have higher accidental death ratesthan the overall population. For example,in1973-75 the American Indian accidental deathrate was 3.1 times the U.S. death ratefor allraces.According to the National Health Survey, 30percent of the population isinjured each year.10;1/00 children undei 15 years of age died fromaccidental injuries in 1978:.for children between 5 and 15, motor ve-hicle jatalities accounted for42 percent of'all aental deaths;the 'overall death rates from accidentsforchildren under15fellfrom 26.6per100,000 in 1968 to 21.1 per 100,000 in1978, a decrease of 20.7 percent.the most common fatal accidents tochildrenat home were from fires (36 percent)andsuffocation (25 percent)..1).Status pad. TreadsMotor vehicle accidents account for the largestnumber of trauma deaths and injuries:there were approximately 52,400d athsfrom motor vehicle accidents in 1978, a rateof 24.0 per 100,000 population,which rep-..resents an increase,,from the lowof 21.5deaths per 100,000 in 1975;of these motor vehicle accidentdeaths, overe9,000 were pedestrians, a 2'percent increasefrom 1977;k.there were approximately 2 million disabling.injuries from motor vehicleaccidents in1978;454C,the motor vehicle fatality rate for childrenunder 15 decreased from 10.4 per 100,000children in 1968 to 9.1 per 100,000 in1978, a decrease of 12.5 percent;for 15 to 24 years olds, the motor vehicle.fatalityrate has climbed' fiain 39.2 per100,000 in 1975 to 46.1 in 1978;at least 45 percent of all fatal motorvehicleaccidents are alcohol related; in single ve-hicle accidents, 65 percent of drivers arelegally drunkwith blood alcohol con-centration of over .10 percent).Fallsthere were 13,690 deaths from falls in 1978

48 and overmillion injuries;theality rate f
and overmillion injuries;theality rate from falls was 6.3 per100,000 in 1978, and has been declining inrecent years;over fifty percent of fatal falls occurin thehome;fifty-seven percent of fatal falls involve per-sons 75 or older;older people who survive falls are more aptto experience fractures than are youngerpeople;impairment by alcohol is a major contributorto falls.Drowningsin1978, there were 6,900 deaths fromdrownings, a number which has remainedfairly constant over the past 15 years despiteincreasingparticipationinwater-relatedactivities;approximately I in 6 drownings (over 1,000)involve boating mishaps;a substantial proportion ofdrownings occurin unattended bodies of water.Burnsthere were 6,300 deaths from fires and burninjuries in 1978,*a rate of 2.9 per 100,000persons;there are an estimated 60,000 hospital ad-missions for burn injuries per year, with theaverage length of hospital staybeing 15days;-- age specific ratesfor burn deaths are highin children and,the elderly;most fire deaths are caused by residentialfires; -about one-third or fatal house fires, -11IPand a Substantial number of burn injuries,are related to cigarette smoking;i -the largest nv.mber of burn injuries 'requir-ing hospitalization are calmed by scalds;-.-- both alcohol and smoking are significant'factors in fire-related deaths.Gunshot wounds. are second only to motor vehicle crashes incausing death from traumatic injury;in 1977, there were 31;000 deaths from gun-shot wounds;,ISapproximately 2,000' of these were acci-dental; 12,900 were homicides1/4.16,000 weresuicides;-'in 1978, the death rate for non-whites frcingunshot wounds (including accidents, sui-cides and homicides) was 21.3 per 100,000population; compared to a rate of 3.6 per100,000 for whites; for black males 15 to24, gunshot wound were the leading causeof death;firearm deaths are strongly associated -withalcohol misuse.Poisonings.-an estimated 400,000 children under age 5are accidentally poisoned each 'year, 'one -fourth of whom will be retreated for poison-(ing.2. Prevention/Promotion Measuresa.Potential measuresEducation and infOnination measures include:integrating safety education into the kinder-garten through 12th grade school curricu-lum, with special attention to highway safety(and misuse of alcohol), poisoning, water.safety and bums;educating parents and health professionalsabout the importance of crash-tested childrestraints and seat belts and their properuse in motor vehicles;educating parents and child caretakers aboutgeneral safety for children, including pre-school traffic safety;.water safety and swimming education pro-gratis;educating the elderly in measures to reduCerisks of falls;educating architects,building .contractorsand related professionals, including healthprofessionals, on fire safety;safety education and first-aid training forhealth professionals and the public;educating the public,on safe handling of fire-arms as part of general accident preventionPrograms;educating the general public, legislators and46-other decisionmake)s on the extent of .thefirearm injury problem;-'self- protection training programs'for shop-keepers, taxi drivers and others working injobs at high risk of armed robbery.See,Misuse of Alcohol and Drugs.Technologic measures include:improved automobile crashworthiness;improved highway design facilitating pre-vention of ants:mobile crashes;increased use of impact attenuators on high-ways;bikepath development;improved design criteria for homes to pre-vent injury from falls;improved design of swimming pools andenvirons;-increased use of flame retardant -materialsfor clothes and furnishings;introduction of self-extinguishing matchesand cigarettes into general use;impr

49 ovement of trigger safety lock designs;u
ovement of trigger safety lock designs;use of non-lethal (wax) bullets for targetguns;improved safety design of toys, gymnasium,equipment, other play equipment for schoolsand playgrounds;'continued safety packaging of medicationsto prevent poisoning;efficient emergency medical services.Legislative and regulatory measures include:rmandatory automatic restraint systems incars;mandatory infant and child carrier use incars;standardsforcrashworthiness and crashavoidance;motorcycle helmet laws;improved enforceinent of laws related tospeeding, driving while under the influence,and seat belt use;,strengthened building and housing codes;floor-covering standards to protect againstfalls;standards for personal flotation devices;safety standards for public swimming pools;mandatory use of smoke detectors;mandatory no ..715seald settings for hot waterheaters;uniform laws regarding the purchase andpossession of handguns.tEconomic meajres include:reduced insurance premium rates for driverswho do not drink or are otherwise at verylow risk;'reduced rates on home insurance,for specialprotective measuers against falls or fires;reduced insurance rates for recreational fa-4 "i0l,s ,citifies, such as children's camps and parks,which have implemented effectivesafetymeasures.b. Refative strength of the serumsSafety education is a time-honored and widely.dsed prevention measure in injury control. 'TheNational Safety Council, the American RedCross, and a large number of accident preven-tion projects at all levels of Government dependon education as the mainstay of their programs.Although There is widespread support for allkinds of educational efforts in this field, evalua-tion of educational prdgrams that use rates ofmorbidity _,and mortality as outcome measureshave not demonstrated significant effects in re-ducing injury, rates. However, a majority ofsafety professionals express strong confidencein training and education as a powerful tool forbuilding skills, increasing awareness and creat-ing a climate for change.Technologic strategies have accounted for sig-nificant reductlbns in morbidity and mortalityfrom injury and poisoning. Motor vehiclede-sign changes to improve occupant protectionhave been demonstrated to reduce the proba-bility of death, or serious injury inthe event ofa collision. Industry hasachieved remarkablereductions in injury rates through improvementsin machinery design. Childproof containersformedications have dramatically reduced , acei-f dental poisoning. The effectivenessof teichno-logic depends on both the relationship of thedesign to injury causation and the rate of adop-tion of the change.Regulatory measures such as building codes,firecodes and safety standards for materialsandmachinery are widely acceptedns effective coun-termeasures.Regulatory measures have variableeffectiveness depending on compliancerates,enforcement'and the relationship of the measureitself to injury causation.The effectiveness of economic incentivesfor theprevention of injury is only beginning to be ex-.plored outside the industrial setting. It hasbeensuggested that low insurance rates for driverswho have not been Involved in crashes orwhohave no violations on their record may provideincentives for more careful driving, but the stra-tegy has not been evaluated. Productliabilitysuits have created incentives formanufaCturersto design and market saferproducts and torecall defective ones. Adjustment of insurancepremiums for summercanirrrias been used toprovide incentives for hazard removal and hasbeen associated with reductions in Injury rates....3. Specific Objectives for 1990Jmproved health statusa.By 1990, the motor vehicle fatality rateshouldbe reduced to no greater-than 18er

50 '100,0004/tpopulation. f In 1978, it wa
'100,0004/tpopulation. f In 1978, it was 24.0 per 100,000population.)b.By 1990, the motor vehicle fatality rate for chil-dren under 15 should be reduced to-no greaterthan 5.5 per 100,000 children. (In 1978, it was9.2 per 100,000 children under 15.)c.pBy 1990, the home accident fatality rate for'fchildren under 15 should be no greater than.e5.0 per 100,000 children. (In 1978, it was 6.1per'100,000 children under 15).d.By 1990, the mortality rate from falls should bereduced to no more than 2 per 100,000 persons.NIn 1978, it was 6.3 per 100,000,).-!,ei. By 1990, the mortality rate fordrowning shouldbe reduced to no more than 3.0 per 100,000persons. (In 1978, it was 3.2 per100,000.) .f.By 1990, the number of tap water scald in-juries requiring hospital care .should ,be re-duced to no more than 2,000 per year.(Int978, it was 4,000 per year.).'By 1990, residential fire deaths should be re-duced to no more than 4,500 per gear: (In1978, irwas 5,400 per year.)h. By 1990, the number of accidental fatal)ties -from firearms should be ,held to no more than1,700. (In 1978, there were, 1,800.7See Misuse of Alcohol and Drugs.Reduced risk factors'i.By 1990, the proportion of automobiles con-taining automatic restraint protection should begreater than 75 percent. (In 1979, the propor-tion was 1 percent.)j. -By 1990, all birthing centers, physicians andhospitals should ensure that at least 50 percentsof newborns return home in a certified child pas-.senger carrier. (Baseline data unavailable).k.By 1990, at least 110 million functional smokealani, systems should be installed in residentialunits. (In 1979, there were approximately 30mil lio 'systems.)Increapublic/professional awarenessI.B1990; the proportion of parents of childrenunder age10 who canidentify appropriatemeasures to address the three major risksforserious injury to their children (i.e., motor ve-hicle accidents, burns, poisonings) should be.greater than 80 percent. (Baseline dataunavail-able.)m. By 1990, virtually all primary health care pro-viders should advise patients about the import-ance of safety belts and should includeinstruc-tion about use of child restraints to preventinjuries from motor vehicle accidents as partof their routine interaction with parents. 1979, the- proportion of pediatricians who re-ported that they advised parents on car safety4'measures was approximately 20 percent.).Improved services/protectionn. By 1990, at leist 75 percentof communitiesg.y, with a population of over 10,000 'should havethecapabilityfor ambulanceresponse andtransport within 20 minutesa call. (In 1979,approximately 20 percent had this capability.)o.�By 1990, virtually all injured personsin needshould have access to regionalized systems oftrauma centers, burn centers and spinal cordinjury centers. (In 1979, about 25 percent ofthe population lived in areas served 6y region-s,.alized trauma.centers.)p.By 1490, at least 90 percent of the populationshould be living in areas with access to regional-ized or metropolitan area,poison control centersthat provide information on the clinical manage-ment of toxic'substance expostites in the 'homeor work environment. (In 1979, about 30 per-cent of the population lived in such areas )a Improved surveillance/evaluation systemsqBy 1990, at least 75 percent of the states willhave developed a detailed plan for the uniformreporting of injuries.4. Principal AssumptionsChildren.improvements will occur in design and use ofchild restraint systems;increases will occur inuse of automatic re-straints;trends in product safety regulation for the pro-tection of children will continue.MOtor Vehicles.highway safety and vehicle safety will continuetd-be improved;.use of safety belts

51 and child restraints will in-increase t
and child restraints will in-increase to thirty -fire percent;the 55 MPH speed limit will be vigorously en-forced;more Statelawswillbe passedto reducealcohol-related crashes, and more stringent en-forcement of existing laws will occur;See Misuse of Alcohol and Drugs.Falls:4improved design will be effected in new andexisting dwelling units (handrails, lighting);alcohol abuse prevention and treatment pro-grams will be increasingly available.Drownings:swimming pool 'design will improve, includingmodifications to access;licensing/certificationof boatoperatorswillgrow.Barns:there will be a continued decline in per capitacigarette consumption;improvements in building codes and their en-forcement will opur;self-extinguishing matches and cigaretteswillbecome acvailable.48laGunshot wounds:Dthere will be an increase in State laws Concern-ing purchase and possdsion of handguns;,fewer people will purchase handguns;there will be Improvements in design andcrease in use of gun safety devices.5. Data Sourcesa. To National level onlyNational Electronic Injury Surveillance System(NEISS). Traumatic consumer product relatedinjuries. ConsUmer Product Safety Commission(CPSC). NEISS Data Highlights and Newsfroth' CPSC, selected reports. Continuous dailyinjury reporting and detailed accident investi-gations of selected high priority cases, Nationalsample of 74 hospital emergency rooms. Re-porting initiated in 1972, revised in 1978.Occupational injury and illness, Job related in-jury and illnessrates. Department of Labor,Bureau of Labor Statistics. Compiled from con--tinuous monthly and selectedreports, fromthartbook on Occupational Injuries and Ill-nesses tables.Fatal Accident Reporting System (FARS). De-scribes detail of fatal highway accidents. De-partment of Transportation (DOT), NationalHighway Traffic Safety Administration. FatalAccident 'Reporting System Annual Report.Continuous reporting.:..0Health Interview Survey (HIS) Sickness and,injuries among members of households experi-enced during two weeks prior to the Interview.DHHS-National Center for HealthStatistics(NCHS). NCHS Vital and Health Statistics,Series 10. Continuous household interview sur-vey; National sample.BoatingaccideGts.Compilationofboatingaccident and registrationstatistics. DOT-U.S.Coast Guard. Boating Statistics (COMDTINSTM,16754.1, Old CG -357). Full count and se-lected activities reported annually from recrea-tional boat numbering and casualty reportingsystems.Surveillance and studies of accidents. Causes,and prevention of vehicular accidents; otherstudies. Accident Analysis and PreventionInternational Journal.Pergamon Press, LtContinuous quarterly reports.Surveillance and studies of accidents. Selectedstudy reports, various topics. Metropolitan Life,Insurance Company. Statistical Bulletin. Surveyand full count data. Continuous quarterly pub-lication.Hospital Discharge Survey (HDS). Trauma,butn patients discharged from s ort stay hospi-tals. DHHS-NCHS. NCHS VitHealthStatistics, Series 13, selected reports. Continu-ous; National probability sample.in-AIMS b. To Slate-aad/ oi local level'National Vital Re:ttation SystemMortality: 'Deaths by cause (including atci-dents),b1p. sex and race. DHHS-NCHS.NCHSVtaustics of the. United staid,vol ILand NCHS Monthly Vital StatisticsReports.Coruing reporting from States;National,fullcount. (Many States issueearlier reports. )Accident report!' Nunfbets and rates of acci-dents biftype. National Safety Council.Accident`Facts,an annual report of surveys, fullcountdata, anceittrapolations of data, including se-lected summary reports; andJournal of SafetyResearch,selected accident study reports, pub-lished quarterly. Data from State, Federal, localgovernments and

52 private industry and organza -tions.,Mo
private industry and organza -tions.,Motor vehicle accidentsReports froin State Motor, Vehicle depart-ments.EpidemiOlogic survey data on traffic acci-"dents and conditions. When, where and howtraffic accidents occur. State traffic authori-*ties and DOT-Federal Highway Administra-tion. Selected reports and annual summaries.State burn registries, where established.Hospitalized illness discharge abstract systems.aworeN,'r49bProfessional Activities Study (PAS). Pa-tients in short stayftiospitals; patient charac-tetistics, diagnoses of trauma and burns,prycedures performed, length of stays. Com-,mission onand Hospital Activi-ties, Ann Artr, Michiga6. Annual reportsand tapes. Continuous reporting from 1900CPHA member hospit) ats;"not a probability_sample, extent of hospital participation var-iet by State.Medicare Hospital Patient Reporting System(MEDPAR). Characteristics, of Medicarepatients,diagnoses,procedures.DHHS-HealthCareFinancingAdministration,('lice of Research, Demonstration and Sta-.tistics (ORDS). Periodic reports. Continu-ing reporting from hospital claim data; 20,percent sample.Other hospital discharge systems as locally,available.Selected health data. DHHS-NCHS.NCHSSta-tistical Notes for Health Planners.Compilationsand analysis of data to State.level.AreaResource. File(ARF).Demographic,health facility and manpower data at State andcoun;ylevelfromvarioussources. DHHS-Heaith Resources Administration.Area Re-source File: A Manpower Planning and Re-search Tool.DHHS-HRA-80-4, Oct 79. Onetime compilation,0 FLUORIDATION AND DENTAL 'HEALTH.1. Nature andEttent of theProblem:Dental diseases probably constitute, in the aggregate,the most prevalent health problem in the Nation. Thetwo most prevalent oral diseases are dental caries(tooth decay) and periodontal disease (diseases ofthe gums and other tissues supporting the teeth). Ifnot coqtrolled, each of these diseases progresses to anadvanced stage that is difficult and, therefore, expen-sive to treat. If left untreated, or ifitreatment is delayedtoo long, dental .caries and periodontal disease resultin tooth loss. However,. based on current knowledge,both of these diseases can be grevented in molt per-sons. Fluoridationparticularly of community watersuppliesis the most effective measure to reduce theincidence of the largest problem, dental caries, withthe capability of prevepting 65 percent of dental cariesand'50 percent of children's dental bills. Fluoridationis, therefore, the major focus of this section, but othermeasures important to dental health are also discussed.a.Health insplicatiomsDental caries is localized, progressive destruc-tion of the, tooth initiated by 'acid demineraliza-tion or the outer tooth surface. Caries resultsfrom a complex interaction among three factors:tooth susceptibility, bacteria in plaque and die-tary environment.Periodontal disease is an insidious inflammatorydisease which affects the gums and the alveolarbone supporting the teeth. There are severaltype of periodontal diseaSe. The initial and mostcommon type is gingivitis or inflammation ofthe gums. If untreated, this condition usuallydevelops into periodontitis, the chronic destruc-tive stage of the disease. In the advanced stages,the bone supporting the teeth is destroyed, theteeth loosen and eventually are lost.Research findings indicate that certain oral bac-teriaassociated with plaque and calculus ac-cumulations on teethare the prime cause ofperiodontal disease. Several other factors thatmay be associated with the development of thedisease include: poor nutrition, malocclusion,grinding of the teeth, the loss of teeth whichcauses those. remaining to dlift out ofpositionand hormonal imbalances.b.Status sad tread

53 sRental caries affects '98 percent of th
sRental caries affects '98 percent of the U.S.'51population, creating a, dental disease problem ofmassive proportions.14-17 years of age, 94' percent of children haveexperienced caries in their permanent teeth. Onaverage,17 year-olds have had about ninepermanent teeth affected.Low income children have about four timesmore untreated decayed teeth than high incomechildren. cForty-seven percent of chilte4..mader age 12have never been to a dentist.About 31 million .adults aged 18 to 74 yearshave lost all of their upper or lower naturalteeth. This includes about 19 million adults whoherlost all their teeth.Periodontal disease is thesc4ondmost prevalentoral disease. More than 65 million persons haveperiodontal disease, including nearly 12 millionchildren and more than 53 million adults.The proportion of persons with periodontal dis-ease increases significantly with age:almost one-third of children aged 12to.17years have gingivitis;among those persons 65. to 74 years of agewith some patural teeth still present, two-thirds have periodontaldisease,halfofwhom have the disease initsdestructivestage.Data from the initial and 1971-74 NationalCenter for Health Statistics (NCHS) health ex-amination survey suggest perioriontal disease isdecreasing in prevalence.Injuries to the teeth and mouth also constitute aosizeable dental problem.2. Prevention/Promotion MeasuresDental disease prevention covers a spectrum of manyactivitiesthe fluoridation of community and schoolwater supplies, dental health education, fluoride sup-plement$ and rinses, individual improvement of oralhygiene and dietary practices and routine professionalcheck-ups. Included in this spectrum are procedures tomodify the behavior patterns of individuals regardingmeasures such as diet change, tooth brushing andflossing.a.Potential measuresMeasures toiprevent dental caries may be directed,at one of the three principal contribpting factors;51 tooth susceptibility, bacteria in plaque and dietaryenvironment Reduction of bacterial agents is ac7_complished through a proper personal .oral hygieneregimen and regular prophylaxes given by a dentalprofessional. For a proper dietary environment,highly cariogentc foods and snacks, particularlythose containing refined sugars, should be avoided;ho7ever,such foods are consumed, the teethought to be thoroughly brushed immediately after-wards. The caries susceptibility of teeth is signifi-cantly reduced through the proper use of fluorides.For persons not ingesting sufficient fluoride as itoccurs naturally in their drinking water, fluoridemeasures are needed. The ingestion of fluoridesfrom birth is Most effective' and may be accom-plishedthrough eitherfluoridation of drinkingwater supplies or the use of dietary fluoride supple-mentary Fluoridation of water supplies is the mostpractical measure. As a less effective alternative,topical fluorides may be applied either by the indi-vidual or a dental profeAnal. The benefits andsafety of fluorides in prevoting dental canes arewell documented as the result of almost five decadesof research and over 30 years of experience. Al-though the technology of fluoridation as an effec-to,e prevention measure for dental caries is well_established, a considerable gap 'persists betweenknowledge and application. To implement nearuniversal fluoridation in the United States requiresan array of interacting strategies.The prevention of periodontal disease requiresproper oral hygiene to minimize plaque depositson the teeth. Calculus, a hard crust-like materialformed at and below the gum margin by depositionof calcium and phosphate from saliva in neglectedplaque, must also be removed As periodontalpockets are formed, bacteria and food particlesma

54 y lodge in the pockets resulting in more
y lodge in the pockets resulting in more inflam-mation and setting up acycleinthe diseaseprocess. Plaque can be removed by the individualby thorough brushing and flossing of the teeth ona daily basisCalculus, however, cannot bere-moved by simple briushing, but requires scaling ofthe teeth regularlya dentist or dental hygienist.Education and information measures include:public educational efforts to promote fluo*datiotistf community and school water sys-tems as well as other caries and periodontaldiseasepreventive measuresatNational,State and local levelsusing electronic andprint media, school health curricula, healthorganizations and lay groups;informing and involving key groups and in-dividuals,includinghealthprofskonals,communitydecisionmakers, health- organi-zations, waterworks associations, and laygroups and organizations in the preventionof dental disease;using schools to promote both fluoridationand improved preventive periodontal meas-ures;52'developing local advocacy groups toen-,__courage__ the_ Adoptionandretentionoffluoridation through the appropriate politi-cal processs"' Service measures include:fluoridation of water systeins*:community wate fluoridation: most com-munity water sues contain less thanoptimumconcentra ionsofnaturally-occurring fluoride and need to be fluori-dated; among communities of 1,000 ormore poptrlation, about 8,670 water sys-tems serving about 5,860 cpmmunitieshave not yet been fluoridated;' apfroxi-mately 32 percent of the U.S. population(67millionpersons)were served bythese fluoride-deficient water systems in1975; another 17 percent were not servedby community water , systems at all; thus,'approximately 51 percent of the popula-tion was served by public water systemsproviding anadjusted optimalfluovidelevel and an additional8 percent of thepopulationusednaturallyfluoridateddrinking water at optimum or 'higher fluo-ride level.,school water fluoridation: elementary andsecondary schools on independent watersystems' (i.e., schools not served by com-munity water systems) that are lo-cated influoride-deficient areas need to be fluori-dated; school 'water fluoridation can re-,duce the incidence of dental decay by upto 40 percent, and could serve an addi-tional 2.2 million school' children.*NOTE: Optimum fluoride concentration:For community water fluoridation, therecommended optimum fluoride concen-tration is determined by the mean maxi-mum daily temperature over a five-yearperiodin the United States, the opti-mum fluoride concentration for com-munity water fluoridation ranges between0.7 -and 1.2 parts of fluoride per onfmillion parts of water (ppm); for sepa-rate school water fluoridation, the rec-ommended fluoride concentration is 4.5times the optimum fluoride concentra-tion recommended for community waterfluoridation in the same geographic area.school-based, caries and periodontal diseasepreventive services; a full range of appropri-ate preventive services can be made readilyavailable to childen enrolled in eletpentaryand secondary schools and to younger chil-dren in day-care centers, Head Start pro-grams and preprimary programs, includingas appropriate.:self-appliedfluoridemeasuresthrough511.111 dietaryfluoridesupplements,usuallytaken in tablet form, or fluoride,,reuth-rinses;educational and informational measuresas a component of general health educa-tion;-school ao community activities to limitthe accessibility of highly cariogenic foodsand slicks to children;sch-based educational and hygienicpe odontal disease preventive services.Technology 'measures include:efforts to ensure that the fluoride concentra-tions of water distributed from fluoridatedwater systeni are maintained at optimumlevels at all tunes (unless

55 the fluoride con-centrationismaintained
the fluoride con-centrationismaintained at the optimumlevel,thereduction of .dent cariesismarkedly decreased):continuousoperationoffluoridationequipment;proper and timely monitoring and surveil-lance of fluoridated water systems;training and continuing educationforwaterworks personnet*and engineers andfor school personnel responsible for op-eration of school fluoridation equipment;use of modern technology in fluoridationsystem surveillance;improvedtechnologyforfluoridationequipment, and testing and engineeringprocedures;ensuring an adequate supply of neededtypes offluor ye compounds.Legislative and regulatory measures include:developing model St4te laws and regulationsfor fluoridation and fluoridation monitoringand surveillance systems;clarifying specific provisions of Federal andState safe drinking water laws and regula-tions which potentially delay the implemen-tation'of fluoridation.Economic measures include:financial and technical assistance\to supportexpansion of community and school waterfluoridation;inclusion of fluoridation equipment, whereappropriate, in. the funding of new or im-provide water systems by the U.S. Depart-ment of Housing and,Urban Development,the Econ omic Development Administrationand the Farmers Home Administration;reducing premiums for dental insurance forfamilies with children who live in fluoridatedcommunities;reducing HMO capitation charges for dentalcoverage for families with children who livein fluoridated communities.I5353r\b. Relative strength of the measuresMeasures which in combination ensure that chil-dren receive the full .benefitslik fluoride, infre-quently consume highly cariogenic foods andfollow a proper personal_ oral hygiene regimenhave a synergistic effect oh preventing dentalcaries and reducing the need for and cost ofchildren's dental care. These measures do notalter the need for regular visits to the dentistand the prompt treatment of caries that doesdevelop.. Fluoridation of community water suppliesisestimated to yield $50 in savings from reducedtreatment for each dollar invested.The fluoridation of community water systemsisthe most effective,least costly public healthmeasure for preventing dentalcaries. Benefitsthat accrue in children include:teeth that are more resistant to caries;as much as two-thirds ids caries inchildrenwho drink fluoridated water from birth;as many as six times more caries-free teen-agers in fluoridated communities asin non-fluoridated communities;fewer extractions of primary and permanenttteth;fewer and less complex and, therefore, lesscostly restorative services (children's dentaltreatment costs in fluoridated communitiescan be one-half the costs innonfluoridatedcommunities).Adults consuming fluoridated water throughoutlife can expect fewer caries-related treatmentneeds and less loss of teeth due to caries.Substantial,thoughinmostinstanceslessbeneficial, results can be realized from otherfluoride measures (the percentage reductions ofthese measures are not arithmetically additive):dietary fluoride supplements in recommend-ed dosages:if provided in school programs, result incaries reductions in permanent teeth rang-ing from 25 to 35 percent after two ormore years of fluoride ingestion.a weekly fluoride rinseregimen, utilizing a0.2 percent neutral sodium fluoride solution,can reduce caries incidence byabout 25percent;a fluoride dentrifrice (toothpaste) can re-,duce caries incidence by 20 percent;'professionally-applied fluorides can reduce("nes incidence by about 35 percent.Regular oral" examinations serve toidentifycaries at an early stage so that treatment can be -prompt, and unnecessary further destructiod and' potential loss of the teeth prevented.Both fluoridation and sc

56 hool-based programsensure that children
hool-based programsensure that children of all socioeconomiclevelsreceive caries preventive services.. Since the United States began using communityfluoridation in 1945, there have always beenbarriers to attaining goals Ornear universal fluo-ridation, including community inaction, financiallimitations on cdmmunities, improper systemssurveillance, and the powerful antifluoridationistlobby. Also, some fluoridated systems are main-tained below thc recommended optimum leveeVigorous promotional efforts to prevent perio-dontal disease can also be effective. Particularlyimportant in this regard are efforts to encouragethe publicespecially school childrento prac-tice good oral hygiene on a daily basis and tomake regular visits to the dentist.3. Specific Objectives for 1990 or EarlierImproved health statusaBy 1990, the proportion ofv,ine-year-old chil-dren who have experienced dental caries in theirpermanent teeth- should be decreased to 60 per-cent. (In 1971-74, it was 71 percent.)b. By 1990, the prevalence of gingivitis in childrento Iears should be decreased to 18 percent.(l'9714, the prevalence was about 23 per-_cent.),c.By 1990, in adults the prevalence of gingivitisand destructive periodontal disease should bedecreased to 20 percent and 21 percent, respec-,tively. (In 1971-74, for adults aged 18 to 174years, 25 percent had gingivitis and 23 percenthad destructive periodontal disease.)Rechiced risk factorsd.. By 1990, nopublic elementary or secondarysew! (and no medical facility), should offercanogenic foods or snacks in vending ma-chines or in- school breakfast or lunch programse.By 1990, virtuallyallstudent's in secondaryschools and colleges who participate in orga-nizedcontactsportsshouldroutinelywearproper mouth guards. (Baseline data unavail-able.)Increased public/professional awarenesss'f.By 1990, at least 95 percent of school childrenand their parents should be able to identify theprincipal risk factors related to dental diseasesam) be aware of the importance of fluoridationand other measures in controlling these diseases.(Baseline data unavailable.)By 1990, at least 75 percent of adults should beaware of the necessity for both thorough. per-'Sonal oral hygiene and regular professional carein the prevention and control of periodontal dis-ease. (In 197k, only 52 percent knew of theneed for persoiial oral hygiene and only 28 per-cent were aware 'of the need for dental check-ups.)'Improved services/protectionh. By 1990, at least 95 percent ofrthe-pripttlationon community watef systems should b receiv-g.54ing the benefits of optimally fluoridated water.(In 1975, it was 60 percent.)i.By 1990, at leat 50 percent ofsgihool childrenliving in fluoride-deficient areas that do not havecommunity water systems should be served byan optimally fluoridated school water supply.(In 1977, it was about 6 perent.)j.By 1990, at least 65 percent of school childrenshould be proficient in Personal oral hygienepractices and should be receiving other neededpreventive dental services in addition to fluorida-tion. (Baseline data unavailable.)Improved surveillance/evaluation systemsk.By 1990, a comprehensive and integrated sys-tem should be in place for periodic determina-tion of the oral health status, dental treatmentneeds and utilization of dental services (includ-ing reason for.and costs of dental visits) of theU.S. population.1.By 1985, systems should be in place for deter-,mining coverage of all major dental public healthpFeventive measures and activitiesto reduceconsumption of highly cariogenic foods.4. Principal AssumptionsEven though community water fluoridation isthemost effective public health measure for preventingdental caries, this measure alone cannot do the

57 job.Significant progress will not be ma
job.Significant progress will not be made in reducingthe national dental caries rate in children and in-'creasing the proportion of children who are cariesfree until such time as all three major approachesto caries preventionproper personal oral hygiene,diet low in highly cariogenic foods and fluoride pro-tectionare followed in combination, as needed,by the majority of children in this country.Support for fluoridation assistance programs willgrow to a level to meet the program's major objec-tivenear universal fluoridation.Organized dentistry's support for dental caries andperiodontal disease prevention measures willin-crease at the National, State and local levels.State and local health and education agencies, theHealth Systems Agencies, the State Health'Planningand DevelopmentAgenciesandtheStatewideHealth Coordinating Councils will increase theirconcern for and expand their activities to supportfluoridation, school-based prevention oriented dentalprograms and periodontal health promotion.Fluoridation will continue to have the strong en-dorsement of virtually every major National healthorganization.The cost /benefit ratio of community water fluorida-tion will continue to be more favorable than for anyother known public health measure implemented forthe prevention of dental caries.The percent, of the total U.S. population on com-munity water supplies will not change appreciablybetween 1980 and 1990 (approximately 82 percentin 1979). S. Data Sourcesa. ToNCenterr.rvd mayal(h and NExamination Survey). Rrevale ce of dental caries, perio-aside tilousness and related infor--1.13pulation.DHHS-NalionalHealth Statistics (NCHS). *NCHS4`----3Vital'fInd Health Statistics, Series II, selectedreports. Periodic survey, national sample. Note:dental data collected inHANE$ I (1971-74),not in HANES I* (1976=-80). 'State legislation oon fluoridation: New or pro-poses State legislation affecting fluoridation ofWater supplies. DHHS-Center for Disease Con-trol (CDC)._ CDC analysis compiled from Corn-merce Clearing House, Inc., information.Orr=`-tinuing.Effects of fluoridation on dental practice andntal human resource requirements. AmericanIffental AsAlition ikareau of Economic' andBehavigarillicatch. Periodic reports. Continu-ing: national surveys of practicing dentists.b. To Stile andlocal levelFluoridation census. Fluoridation status of corn-04 water supplies, adjusted and natural;population served,' dates fluoridatioh initiated,otherelated' information.' DCDC CDC1e.A.6o901975. To be conducted .annually beginnifigIn1980. Data to be aggregated atNatikal andState levels.'National Dental Caries Prevalence Survey. Den-tal caries'and periodontal disease among schoolchildren; grades K-12, related to fluoride con-tent of drinking water for the school andplaceof residence of the children-in the study. DHHS-National Institute of ,Ffental Research. Reportforthcoming. Sup/0, 1980. Additional surveysplanned at 3ar intervals.Early-Periodic Screening, Diagnosis andTrwent (EPSDT) reporting, system.Oral'-Health status and referral of children screened.DHES-Health Care if inancing Administration(HDFA), 'Office of Research, Demonstrationand Statistics;Statistics, selected re -*.ports. Continuous reporting from StateMedicaidoffices.Seleced health data.DHH S-NCHS. NCHS Sta-tistical Notes for Heahh Planners. Compilationsand analysis Of NHS data to State level.Area ResourceFile(AkE). ,Demographic,health facility and manpower data at Stateandcountylevelfrom varioussources.14ealthResources Adpitistration. Area Re-Source File' A Manpower Planning and ResearchTool, DIIHSHRA-80-4, Oct 79. Onetimecompilationatt40C"Po rSURVEILLANCE AND CONTROL OFINFESIOUSDISEASES1. Natureand Extent of the Proble

58 m46'Current surveillance and classificat
m46'Current surveillance and classification systems do notaccurately reflect the importance of infectious diseaseson the health and well-being of thenation. Only onecat;goey of -infectious diseases (influenza and pneu-monia) is ranked among the top-10 causes of deathaccording to the National Center for Health Statisttcs(NCHS). However, were infectious diseases to begrouped in a manner similar to the cardiovasculardiseases and cancer, 123,000 deaths would,have beenattributable to infectious diseases in 1976,surpassed'only by cardiovascular diseases (719,000) cancers(387,000), and stroke (1824)00). However, eventhisfigure is an underestimate of the total impact.Whenit is adjusted for the probable sensitivity of the sup.-..Veillance systems used, over 300,000 deaths may beattributable to infectious diseases each ye'. Particu-larly underestimated are the incidences of the common,infectious diseases of the respiri ory, gastro-intestinaland genitourinary tracts.IIPa.Health implikations.ifOver 2 millionomial infections (acquiredtin patient-care initutions) occur each year, and,60,000 to 80,000 persons die as a direct orindirect result of suchinfections.An estimatedir 20 percent of these infections are preventablewith current control technollegles.a. N, Each year, an estimated 2,400,000 casesofpneumonia occur, with pneumococcal pneu-onia alone affecting 400,000 persons at a cost... $325 million.'1,ual average of 57,000 deaths attributabletd pneumonia and influenza hasbeen reportedover the last 10 yes.Io41977, there we30,145 reported cases oftuberculosis and 2, 68 associateddeaths.Each year, an estimated 1,200,000 cases of ,sal -monellosis occur, with an estimated dirktcost'of $774 million.Annually, an estimated 200,000 cases of shigel-losis occur, with an estimated direct cost of $130million.Almost three quarters of food -borne diseasesoriginate in foodeserviee establishments. (65 per-cent) or food processing plants (4 percent).Each year an estimated 200,000 infectionsofhepatitis B virus occur, a third of which resultin jaundice. Approximately 200 people die due1'57to acute infection, 280 from liver cancer and.3,500 from cirrhosis caused by hepatitiS B virus..The cost of acute disease is-estimated to be $70million.An estimated 60,000 acute cases of hepatitis Aand 60,000 cases of non A/non B hepatitis occureachlrear cosproximately $120 million.Each year; an18,000 cases of bac-terial meningitis are reported, with 2,500 asso-ciated deaths and an estimated direct cost of$58 million.In 1975, an epidemic year, an estimated 544,000infections of St. Louis Encephalitis occurred inthe United States.A 1977 epidemic of dengue in Puerto Rico re-sulted in an estimated 1,740,000 eases. DengueOutbreaks continue in the Caribbean area andin Mtxico increasing the potential for the intro-.*lion of-dengue into the'contiuental UnitedStates..Infectious diseases including malaria, hepatitisand -diarrhea]diseases of viral,` bacterial orparasitic origin, *remain serious health hazardsof international travel.b.Stains and trendsThere are between 190 and0 million acuterespiratoryillnesses per _Mir in the UnitedStates, resulting in a minimum of 400 milliondays in- bed, 124 million 'days lost from workand 125 million days lokfrcrin school.Acute gastroenteritis is the sec nost com-mon illness, accounting in one suy'for 9.5percent Of all visits to pediatricians.' offices.Infectious diseases result in' approitimately 27million patient days of acute hospital care eachyear (10 peitent of the patient days in acutecare hospitals)at an estimated direct Cost ofnearlybillion.Infecti us diseases, such as tuberculosis, con-tinue to be more prevalent in poverty areas andareas with high immigration

59 vs.AntibiotiCs and antimicrobilis, the
vs.AntibiotiCs and antimicrobilis, the most com-monly prescribed category of medipetion, ac-count for a major portion of prescription drugcosts.R plasmmediated multiple-resistant orga-nisms, which appear to be increasing amongpathogens of man, threaten to blunt the effec-tiveness of previous therapeutic regimens.C 2. Prevention/Promotion Measuresa.. Potential measures ,OPEducatiOn and information measures include:better understanding and practice of basichygienic measures, such as handwashing andproper handling of fisod;creation of an atmosphere conducive togreater public participation in health prac-tice (e.g., ,more. local demand for hygienicpractices in food service establishments andfor immunization availability);school health, and public and professionaleducation to improve individual awarenessof, and responsibility for, disease preventionpractices such as handwashing, and obtain-ing immunization for one's self and one'schildren;educational apaches that takes into ac-count socioeconomic and ethnic differencesthat may influence both spread of diseaseand receptivity to change.Service measures include:operation of surveillance networks includingdefinitive and dependable laboratory infor-mation to ensure early detection of infec-tious diseases and their causes;assistance in analysis of surveillance data toassess the extent and impact of infectiousdiseases, to evaluate the costs and benefitsof public health efforts and to define im-portant areas for research;operation of communications technology tofacilitatenationaldisseminationofdatawithin disease reporting systems;dissemination of information to States andlocalities concerning threatening infectious,disease agents and new prevention and con-trol methods;provision of epidemiologic investigation and,controlservicestofacilitate -response toinfectious disease problems within medicalcare facilities as well as in the community.Technologic measures include:.better design of medical devices and im-plants for safety and ease of sterilization ordisinfectioh;improved water treatment systems;,improved regulatory measures relating tofood processing, food service and waste dis-posal;development and testingew vaccines;develbpmeht of new d.ostic tests for 'dis-ease diagnosis and control;improved vector control and vector surveil-lance technology;improved design of health-care facilities tofacilitateinfection control practices(e g.,readilyaccessiblesinksfor handwashingVetween visits to patients).5$b.Relative-strength of the measures,Surveillance, including epidemiologic investiga-tions, is the basic and essential element of dis-ease control: Historically, surveillance has pro-vided the basis for understanding the majorinfectious diseases of man. It will remain essen-tial to the future of infectious disease control.Improved surveillance systems.will 'allow detec-.tion of new reservoirs of infection, definition ofpopulations atrisk, understanding of patternsof disease spread, and the evaluation of controlmeasures. Serveillance systems will serve:anincreasingly important role in program evalua-tion (e.g., cost-benefit analyses) and the identi-fication of new areas for intervention.Although health edtication measures lack rigor-ous evaluation, they have contributed substan-tially to curbing disease transmission. Furtherprogress in preventing infectious diseases canbe expected from public education measures inareas such as vaccine acceptance, proper use ofantibiotics and the understanding of personalhygiene.The history of successful intervention in the con-trol of food and waterborne diseases anticipatesthe development of new technologies for, thecontrol of infectious diseases and the applicationof new environment

60 al control measures to largepopulations.
al control measures to largepopulations. In the hospitaLsetting, the Studyon the Efficacy of Nosocomial Infection Con-trol (SENIC) is a model for evaluating environ-mental measures related to infectious diseaseproblems of public health importance.3. Specific Objectives for 1990Improved health statusa.By 1990, the annual estimated incidence ofhepatitis B should be reduced to 20 per 100,000population. (In 1978, it was estimated to be 45per'l 00,000 population.)b.By 1990, the annual reportedi incidence oftuberculosis should be reduced to 8 per 100,000popidation. (In 1978, it was 13.1 per 100,000population.)c.By 1990, the annual estimated incidence ofpneumococcal pneumonia should be reduced to115 per 100,000 population. (In 1978, it wasestimated to be 182 per 100,000 population.)a.By 1990, the annual reported incidence of bac-terial -meningitis should be reduced to 6 per100,006 population. (In 1978, it was estimatedto be 8.2 per 100,000 population.)e.By t990, the (risk factor-specific) incidence ofnosocomial infectioninacute care hospitalsshould be reduced by 20 percent of what other-.wise would pertain in the absence of hospitalcontrol programs. (In 1979, it was estimatedthat 5 percent of all hospital patients sufferednosocomial infections and the overall rate ofhospital acquired. infections appears to be in-5 creasing, although less so in hospitals with goodinfection control programs.) A similar pereent-age of Las uction should be seen in long-termcare at residential care facilities.(Baselinedata unavailable.)`improved services/protectionf.By 1990, 95 percent of licensed patient carefacilitiesshould be applying the recommendedpractices for controlling nosocomial infectious.(Basepe data unavailable.)g.By 1990,surveillanceand controlsystemsshould be capable of respondingto and contain-ing: (1) newly recognized diseases and unex-,pected epidemics of public health significance;and (2)infections introducedfroinforeigncountries.*h.By 1990, at least 50 ercent of people in popu-lations designated as targets by the Immuniza-tion Practices Advisory Committeeof the PublicHealth Service should be immunized within 5years of licensure of new vaccines for routineclinical use.*NOTE: Same objective as for Immunization.Potential caodidates include. hepatitis A andB; otitis media (S. pneumoniae and H. influ-enza); selected respiratory and enteric viruses;meningitis (group B N. meningitides, S. pneu-moniae, H. rn#uenza).Improved surveillance/evaluation systemsi.By IWO, data reporting systems in all Statesshould be able to monitor trends of commoninfectious agents not now subject to traditionalpublic health surveillance (respiratory illnesses,gastrointestinal illnesses, otitis media) and tomeasure the impact of these agents on healthcare cost and productivity at the local and Statelevels, and by extension at the National level.By 1990, the extent of epidemics of respiratoryand enteric vir'al' illnesses should be predictedwithin 2 weeks after they appear, through com-munity-wide sentinel surveillance systems.k. By 1990, all State health departments should be`linked by a computer system to Federal healthagencies forroutinecollection,analysis anddissemination of surveillance data, rapid com-munication* of messages, and epidemic aid in-vestigations.1.By 1990, laboratories throughout the countryshouldbelinkedformonitoringinfectiousagents and antibiotic resistance patterns° and fordisseminating information.4. Principal AssumptionsDespite anticipated changes in antibiotic resistancepatterns, there will be no dramatic changes in theprojected evolution of infectious disease patternsbefore 1990- ..a.lthough disease agents will be newlyrecognized and epidemiologic patterns define

61 d.Continuirig change in the age structur
d.Continuirig change in the age structure 'of the U.S.I59L.population with increasing numbers of persons over65 and a concomitant increase in the number andsize of residential facilities for the elderly will beaccompanied by a rise in the incidence of infectiousdisease.Current research efforts to understand the naturalhistory of infectious diseases will be maintained, andimprovedtoolsfor ,prevention,diagnosi; andtherapy will be developed.With the increased use of computer technology,there will be improvements in surveillance, commu-nications and data analysis.*There will be better dissemination o f current tech-nologies known to control disease, and new tech-nologies will be developed (e.g., hepatitis B vac-cine).'There will beincreasing proportion of institu-tionalized pat nts with more serious illness who aresubjected togreater number of interventions andwha are more prone to nosocomial infections.There will be an increased emphasis on the preven-tion and control of nosocomial infections, .particu-larly in residential health-care facilities.Current Federal technical assistance and advisoryservices-in epidemiology and program managementwill be'maintained at the Stake and local level.There will be an improved &Cof diagnostic andtherapeutic measures such as drugs for the treat-ment of viral diseases.There will be a continued overuse of antibiotictherapy as.well as an increase in the developmentof antibiotic-resistant strains of bacteria such as thepenicillin-resistant gonococcus.Because of increased international travels there willbe more oppOrtunities for international spread ofdiseases.5. Data Sourcesa.To Natirl level onlyNational Hospital Discharge Survey (HDS) andNationalAmbulatory Medical CareSurvey(NAMCS). Utilization of health manppwer'andfacilities providing care for infectious diseases,ambulatory care, hospitahcare. DHHS-NationalCenter for Health'Statistics (NCHS)/ Vital andHealth Statistics, Series 13. Continuing surveys;National probability samples.Health Interview Survey (HIS). Interview re-ports on infectious disease disability,useof.hospital, medical, and other services, anotherhealth-relatedtopics. '431-1,HNS-ISCHSVital and Health Statistics, Series 10. Continu-ing survey; National probability sample.Health Examination Survey and the Health andNutrition Examination Survey (HANES). Nu-tritionrisk factors for infectious disease, andmedical sequelae from infectious disease (e.g.,rheumatic fever). DHHS -NCHS. NCI1S Vitaland Health Statistics, Series 11. Periodic sur-veys; National probability samples. Investigation of( epidemics. DHHS-Centers forDisease Control (CDC). Continuous activity byCDC in response to epidemics of infectiousdisease activity throughout the U.S. Data peri-odically made available, in reports and publi-cations.Study on the Efficacy of Nosocomial InfectionControl (SENIC). Hospital infection controlactivities and occurrence of hospital acquiredinfection. DHHS-CDC, Bureau of Epidemiol-ogy, Bacterial Diseases Division (BE-BDD).The Journal of Epidemiology, 11,11:468-653May 1980. Special issue on SENIC. One timestudy, stratified sample of U.S. hospitals.National Nosocomial Infections Study. Noso-comial infections. DHHS-CDC, 14E-BDD.Na-tional Nosocomial Infections Study Report80-8257 Continuous reporting from hospitals vol-untarily cooperating with volunteer panel of 8C1short stay hospitals.b. To State and/or local levelNational Vital Registration SystemMortality. Deaths by cause (including in-.fectious diseases), by age, sex and race.DHHS-NCHS. NCHSVital Statistics of theUnited States,Vol II, and NCHSMonthlyVital Statistics Reports.Continuing report-ing from States; National full count. (ManyStates issue earlier reports.)H

62 ospitalized illness discharge abstract s
ospitalized illness discharge abstract systems.Professional Activities Study (PAS). Pa-tients in short stay hospitals; patient charac-teristics, diagnoses of infectious diseases,procedures performed, length of stays. Com-mission on Professional and Hospital Activi-ties, Ann Arbor, Michigan. Annual reportsand tapes. Continuous reporting from 1900CPHA member hospitals; not a probabilitysample, extent of hospital participation var-ies by State.Medicare hospital patient reporting system(MEDPAR). Characteristics of Medicarepatients,diagnosis,procedures.DHHS-HealthCareFinancingAdministration,Office of Research, Demonstration and Sta-\0 OP60tistics (ORDS). Periodic reports. Continu-ing reporting from hostpital claim data; 20-percent sample.Other hospital discharge .systems as locallyavailable.National Morbidity and Mortality RepottingSystem. Numbers of 46 reportable diseases;deaths in 121 U.S. cities. DHHS-CDC. CDCMorbidity and Mortality, Weekly Report,andannual reports. Morbidity: continuous reportingfrom State health departments on basis of physi-cian reports. (Completeness of reporting variesgreatly, since not all cases receive medical careand not all treated conditions are reported.)Mortality:continuousreporting;volunteerpanel of health departments in 121 U.S, cities,full count.National surveillance data. Detailed data oncases of 33 communicable diseases.SurveillanceReports.DHHS-CDC, BE and Bureau of StateServices. Continuous reporting from States.Third party payers and large group practices cansometimes priavide data on diagnosis, cost anddemographic features of defined patients andpopulations. Data are collected on a continuousbasis but are not consistently analyzed or dis-tributed.State diiase surveillance systems. Report ofnotifiable diseases fequired by State law (asmany as 100 in some States); analyzed andperiodically published by' each of the States.Special penodic Statewide studies to monitordisease ,activity or to evaluate the effectivenessof disease control programs avble at Slatehealth departments.Statewide accounting prpcedures to documentpublic health activities available through theNational Public Health Reporting System of theAssociationof State and TerritorialHealth`44Officers as well as individual State health de-partments.Investigation' of epidemics. Continuous activityby Federal, State and local health departmentsin response to epidemic infectious disease ac-tivity.Data pericidically made available byresponsible health authorities. SMOKING AND HEALTH1: Nature and Extent of the ProblemSmoking, the single most important preventable causeof death and 'disease, isassociated with heart andblood vessel diseases, chronic bronchitis and emphy-sema, cancers of the lung, larynx, pharynx, oral cavity,esophagus, pancreas, and bladder, and with 'otherproblems such as respiratory infections and stomachulcers. Though the share of the population who smokehas declined for the country as a whole, the declineshave not been .as great among adolescents and therehave even been increases in the rates for 17 and 18year -olds wOmen.'"To reduce the pre'lence of smok-ing in this country, a variety of apprOaches are neededto discourage young people from starting to imoke, toincrease the number of smokers who quit, and to assistthose who continue to smoke to do so, to the extentpossible, in less hazardous ways. Particular attentionshould be given to high risk groups such as pregnant ,women, children and adolescents who initiate smokingat a young age, and workers who are exposed to occu-pational hazards that are exacerbated by cigarettesmoking.a.Health implicationscigarette smoking is responsible for approxi-mately 320,000 deaths annually in the UnitedStates.L

63 ung cancer is the leading cause of cance
ung cancer is the leading cause of cancer deathamong men; if present trends continue, by 198it will become the leading cause of cancer-deathamong women.Cigarette smoking is a causal factor for: coro-,nary heart disease and arteriosclerotic peripheralvascular disease; cancers' of the lung, larynx,oral cavity, esophagus, pancreas and bladder;and chronic bronchitis and emphysema.Cigarette smoking during pregnancy is associ-ated with retarded fetal growth, an increased'riskforspontaneous abortion and prenataldeath, as well as slight impairment of growthand development during early childhood.cigarette smoking acts synergistically with oralcontraceptives to enhance the probability ofbol to increase the risk of cancer of the lax,coronary and cerebrovascular disease; withoral cavity and esophagus; with asbestos andother occupationally encountered subs&nces toincrease the likelihood of cancer of the lung;and with other risk factors to enhance cardio-vascular risk.Involuntary or passive inhalatiiM of cigarettesmoke can precipitate or exacerbate symptomsof existing disease states such as asthma, cardio-vascular and respiratory diseases. Pneumoniaand bronchitis are more common among infantswhose parents smoke.Smoking is a major contributor to death andinjury frow fires,' burns and other accidents.Twenty-nine percent of fatal house fires and a,substantial number of burn injuries are smokingrelateeTen years after quitting cigarette smoking, thedeath rates for lung cancer and other smoking-related causes of death approach those of non-smokers.b.Status and trendsAdult per capita consumption of cigarettes de-creased temporarily in 1953, 1954, 19 4, and1968-1970, coinciding with periods of in reaseanational publicity on health hazards of sking.The rate of decline has accelerated sine1977.the percentage of- adultmen who regularlysmoke declined from 53 percent to 38 percentbetween 1955 and 1978.The percentage of adult women who regularlyawoke increased from 25 percent to 33 percentbetween 1955 and t965, decreasing to 30 per-cent by 1978.The percentage of all adults who smoke regu-larly was about 33 percent in 1978, the lowestpointiri over 30 years. Smoking cigarettes issignificantly less prevalent in higher educatedgroups. The decline since 1966 involves all so-cioeconomic groups but cigarette smoking ratesamong blacks still exceed those among whites.Most of the decrease seen in smoking prevalenceamong adults is explained by smoking cessationrather than by a lower rate of initiation.Teenage smoking has declined since 1974, ex-cept for young i4omet1 aged 17 to 18. Rates forwomen aged 17 to 24 have risen and now ex-ceed those of men in this age group.2. Prevention/Promotion Measuresa.Potential measureseducation and information measures include:. , genefal educational campaigns using broad-cast and other mass media, coordinated withgovernment, business and nonprofit volun-tary efforts, focusing on such subjects as spe-cific health consequences, self-initiated ces-sation, less hazardous ways of smoking, theimmediate benefits of cessation and the ef-fects of passive smoking on infants and onpeople with pre-existing heart and lungconditions;specific educational campaigns directed: towomen, focusing on the special health con-sequences of cigarette smoking fu pregnantwomen (and fetus) or for women using oralcontraceptives; to youth and to people inlower socioeconomic groups, focusing onimmediate consequences and how to dealwith social primures to smoke; to varkersexposed to toxic agents and to othIrs atspecial risk to health, focusing on the syner-gistic and additive effects of smoking fosthose exposed to occupational hazards; andto those with other risk factors, such as hi

64 gh'blood pressure;special smoking educat
gh'blood pressure;special smoking education programs reach-ing high tisk groups;youth smoking prevention programs, espe-cially in grades 7 through 10, focused on thepsychosocial factors which promote smok-ing, which will impart knowledge and skillsnecessary to helpresistsocialinfluences(e.g., using nonsmoking peer models);.media programs focused on self-initiatedcessation, referring people to materials ap-propriate to their special risks and dealingwith common relapse situations;advising consumers to consider carbon mon-oxide as well as levels of "tar" and nicotine;warning consumers that changing to ciga-rettes with lower yields of tar and nicotinemay increase smoking hazards" if accompa-nied by smoking more cigarettes, inhalingmore deeply or starting smoking earlier inlife;cautioning consumers that even the lowest-yield cigarettes present health hazards muchgreater than thosencountered by non-smokers, and that the most effective way toreduce the hazards of smoking is not to startor to quit.Service measures include:formal and self-help smoking cessation pro-b.grams Made more available within the healthcare system, occupational settings, union fa-cilities and places convenient to the generalpublic;coordination and exchange of programs andmaterials between Government, business,cominercifil and nonprofit agencies;62expanded direct counseling and patient edu-cation by health cace providers;specialized service programs 'for women, forpregnant women, for occupational and otherhigh risk groups and other smokeis in par-ticular need of assistance in stoppffig smok-ingto be carried on through community,church, social and health organizations andat the work place.Technologic measures include:continuing engineering and research on thedevelopment ofleishazardous ways ofsmoking including the development of ciga-rettes with lower yields of incriminated in-gredients and the development cff-oseahodsto assess the relative ,risks of cigarettes withlower yields.Legislative and regulatory measures include:continuing the ban on TV and radio adver-tising and the requirement of a health warn-ing on all cigarette packages;continuing the FTC reguirement of a healthwarning in advertising, -7-.?"'improving- enforcementAf laws prohibitingsales to minors;i' strengthening State and local laws and regu-lations which establish nonsmoking areas inpublic places and work areas;,examining potential new areas of regulation,such as: increased disease-specific informa-tionin advertisements; deglamorizing thevisual and printed components of advertis-ing; requiring greater visibility of warnings;requiring that tar and nicotine yields beplaced on the package; banning distributionof cigarette samples to minors.Economic measures include:tax policies vis-aavis cigarettes;income tax deduction policy for the cost ofsmoking cessation programs;encouraging employers to provide bonusesand other incentives to workers who quit;"no smoking" policies for workplaces wheresmoking on the job presents particular haz-ards;encouraging insurance companies to exam-ine feasibility of offering preferentiallifeand/or health insurance premiums tb' non-smokers and of paying for smoking cessa-tion programs offered to group insurancesubscribers.Relative strength of the measuresEducation, information,fiscal and regulatorymeasures are key strategies in a National smok-ing prevention program. Education is the pri-orityority in suchgrams, especially related tochildren and preant women. Additional re-search is needed to define the types of educationwhich best meet public needs.si The major,gains may come through the identifi-cation of effective peer education strategies forchildren and youth..Counseling by physicians and

65 health profession-als on smoking would
health profession-als on smoking would facilitate the decline insmoking if incorpoarted into routine clinicalpractice.Legislative, regulatory and economic measures(including taxation), consistently and, vigorouly;applied, should enhance the educational efforts,but are less likely to be successfully enacted.If elgarettes with lowek tar and nicotine shouldprovbe less hazardous for some smoking-related(as current evidence suggests),the substitution of lower level cigarettes forthose with higher levels may prove a valuableaid in reducing disease through less desirablethan not smoking at all.,3. Specific Objectives for 1990 or EarlierImproved health statusReductions in smoking can be expected td yieldreduced rates of coronary heart disease, chroniclung disease, prematurity in newborns, smokingrelated fire deaths and fewer occupational ill-nesses from exposure to substances with whichcigarette smoking acts synergistically. Over thelonger term, reductions in cancer rates (espe-cially lung and bladder) can also be .expected.Because of uncertainties in short-term quantifi-cation of the exposure-to-disease relationship,measurable health status objectivesarenotstated.Reduced risk factorsa.By 1990, the proportion of adults who smokeshould be reduced to below 25 percent. (rE1979, the proportion of the U.S. populationwhich smoked was 33 percent.)b. By 1990, the proportion of women who smokeduring pregnancy should be no greater than onehalf the proportion of women overall whosmoke. (Baseline data unavailable.)c.By 1996, the proportion of children and youthaged 12 to 18 years old who smoke should bereduced tp below 6 percent. (In 1979, the pro-portion of 12 to 18 year olds who smoked was11.7 pereent.)d. By 1990, the sales-weighted average tar yield ofcigarettes should be reduced to below 10 mg.The other components of cigarette smoke knownto cause disease should also be reduced propor-tionately. (In 1978, the sales-weighted averageyield was 16.1 mg.)Increased public/professional awarenesse.By 1990, the share of the adult populationaware that smoking is one ofthe major riskfactors for heart disease should be increased toat least 85 percent. (In1975, the share was 53percent.)f.By 1990, at least 90 percent of the adult popula-63A;rg.tion should be aware that smoking is) majorcause of lung cancer, as well as multjple othercancers including laryngeal, esophageal, bladderand othei types. (Baseline data onavailablelBy,1990, at least 85 percent of the addlt popula-tion should be aware of the special risk of.de-veloping and worsening chronic obstructive lungdisease, including bronchitis and emphysema,among mokers. (Baseline data unavailable.)h.By 19at least 85 percent of women shouldbe awarethe special health risks for womenwho smoke, including the effect on outcomes ofpregnancy and the excess risk of cardiovasculardisease with oral contraceptive use. {Baselinedata unavailable.)i.By 1990, at least 65 percent of 12 year oldsshould be able to identify smoking cigaretteswith increased risk of serious disease of theheart and lungs. (Baseline data,unabailable.)Improved secprotectionj.By 1990, atast 35 percent of all workersshould beoffered employer/employee, spon-sored or supported smoking cessation programseither at the worksite or in the community. (In1979, 15 percent of U.S. business firms hadprogiams to encourage or, assist' their employeesin smoking cessation.)k.By 1985, tar, nicotine and carbon monoxideyields should be prominently displayed on eachcigarette package and promotionalmaterial.(Carbon monoxide levs are not currently re-quired.)I.By 1985, the present'garette warning shouldbe strengthened to increaseitsvisibility andimpact and to give the consumer additionalne

66 eded information on thespecificmultipleh
eded information on thespecificmultiplehealth risks of smoking. Special considerationshould be given to rotational earnings sand toidentification of special vulnerable groups.m. By90, laws should exist in all 50 States andallrisdictions prohibiting smoking in enclosedpub lc places, and establishing separate smokingareas' at work and in dining establishments. (In1978, 31 States had some form of smokingrestriction laws.)n.By 1990, major health and life insurers shouldbe offering differential insurance premiums tosmokers and nonsmokers. (In 1979, approxi-mately 30 major companies were offering dif-ferential premiums.)Improved surveillance/evaluationo. By 1985, insurance companies shouldhave col-lected, reviewed, and made public their actuarialexperience on the differential life experience andhospitalutilization by specific cause among,smokers and nonsmokers, by sex.p. By 1990, continuing epidemiologicalresearchshould have delineated the unansweredresearchquestions regarding low yield cigarettes, and6,2 preliminary partial answers to these should havebeen generated by research efforts.q. By 1990, in addition to biomedicalhazard sur-veillance, continuing examination of the changingtobacco product, and the sociologic phenomenaresulting from those changes should have beenaccomplished.4. Principal AssumptionsPolicy, planning and programs to reduce smokingwill continue to be high priorities of government,voluntary agencies and industry.Educational programs to reducesmoking in youth,women, pregnant women, high riskoccupations andpopulations and lower socio-economic groups willbecome more intensive.There will be a gradual increase in the availabilityand use of smoking cessation service programs.Smoking education will be increasingly integratedinto positive'lifestyle promotion programThq social acceptability of smoking,willTontinue todecreaSeThere will be a continued decline in smoking.amongupper socioeconomic classes,spreading to lowersocioeconomic classes.Regulations against smoking in public places willincrease, providing incentives and social supports toreduce smoking.The decline in sales-weighted average tar contentofcigarettes will continueEngineering measures will help reduce the yields bycigarettes of hazardous particulants and the gaseousingredients of smokeThere wl be no dramatic change in tax policy oncigarettes.5. Data Sourcesa. To National level onlyKnowledge, attitudes and practices incigaretiluse. Demographic data,attitudes, informationand beliefs about cigarette use, andsmokingpractices among people 21 years of age orolder, and changes between 1964and 1970.DHEW National Clearinghouse forSmoltg andHealth (now/Office on Smoking andHealth)Reports: Use of Tobacco: Practices,Attitudes,Knowledge and Beliefs 1964-1966; and AdultUse of Tobacco -1970 /Adult Use of Tobacco,1975. Longitudinal study of panel firstinter-viewed 1964; follow up interviews in 1966 and1970: one time survey (new sample), 1975.Teenage smoking. Demographic data, attitudes,beliefsandknowledgeconcerning smoking. amongadolescents in the United States. Officeon Smoking .and Health(formerly NationalClearinghouse for Smoking aijd Health)1968b.1974; National Institute of Education ,1979.Teenage Smoking: National Patterns ofCiga-rette Smoking, Age 12through 18. Pvitiedin 1968, 1970, 1972 and 1974. (In 19le.*-64was changed to: Teenage Smoking: Immediateand Long Term Patterns). Surveys of adoles-cents ages 12-48 respondent sample of generalU.S. population.Smoking behavior and attitudessof health pro-fessionals. Office on Smoking and Health (for-merly National Clearinghouse for Smoking andHealth). Smoking Behavior and Attitudes: Phy-sicians, Dentists, Nurses, and Pharmacists, 1975.One time

67 survey.Health Interview Survey (HIS); S
survey.Health Interview Survey (HIS); Smoking Sup-plement. Smoking prevalen,ce among adults col-lected asof the Health Interview Survey.DHHS-National Center for Health Statistics(NCHS). IstCHS Advance Data from Vita! andHealth Statistics and Surgeon General reportson smoking usually annual. 1980 Surgeon Gen-eral's report entitled Health Consequences forWomen: A Report of the Surgeon General. Con-tinuingsurvey; -Nationalprobabilitysample.Smoking supplements periodic since 1978.HealthandNutritionExaminatiohSurvey(HANES). Clinical 'and ,j2iochemical data onexaminees collected, could-be analyzed accord-ingtotheir smoking characteristics. DHHSNCHS. NCHS Vital and Health Statistics, SeriesI1. Periodic survey; National probability sam-ple.Cigarette and cigar production and imports.Number of cigarettes (large and small). andcigars, by size and class, shipped from factoryor imported each month by manufacturer. De-partment rof TreaSury-Bureau of Alcohol, To-bacco and Firearms. Monthly statistical release,Cigarettes and Cigars. Continuing; reports frommanufacturers, importers.Tobacco crops. Average yield, stock, supply,domestic use, price and crop value. Departmentof Agriculture, Agricultural Marketing Service.Annual Report on Tobacco Statistics. Continu-ing."Tar" and nicotine content. Results of "tar" andnicotine yield measurements of cigarettes -bybrand. Federal Trade Commission, annual re-port. "Tar" and Nicotine Content of the Smokeof 176 Varieties of Cigarettes. Continuing analy-sis and reports.Cigarette marketing and regulatory issues. An-nual review of current issues ,in labeling andadvertising, advertising themes and costs, regu-latoryactivity,legislativerecommendations,types of cigarettes marketed. Some trend data.Federal Trade Commission. Annual RerIbrt toCongress Pursuant to the Public Health Ciga-rette Smoking Act. Continuing.To State and/or local levelNational Vital Registration SystemMortality.Deathsby cape(includingsmoking related diseases), by age, sex, and ivrace. DHHSNCHS. NCHS Vital Statisticsof - the United States, Vol II, and NCHSMonthly Vital, Statistics Reports. Continuingreporting from States; National full count.(Many States issue earlier reports.)Hospitalized illness discharge abstract systems.Professional Activities Study (PAS). Pa-tients in short stay hospitals; patient charac-teristics,diagnoses of lung cancer andothlsmoking related diseases, procedures per-formed, length of stays. Commission on Pro-fessionalandHospitalActivities,AnnArbor, Michigan. Annual reports and tapes.Continuous reporting from1900 CPHAmember hospitals; not a probability sample,extent of hospital participation varies bystate.Medicare Hospital Patient Report]ystem(MEDPAR) .Characteristics oredicarepatients,diagnoses,procedures., DIMSHealth Care Financing Administration, Of-keoftResearch, Demonstration and Statis-,Vt65D Atics (ORDS). Periodic 'reports. Continuingreporting from hospital claim data; 20 per-,cent sample.-Other hospital dikharge systems as locallyavailable.Cigarette sales. Number of cigarette packages-.tamed for each month in ekh State, and ,00tn-,parison to one year previously. Tobacco TaxCouncil, 5407 Patterson Avenue, Richmond,Virginia: Monthly State Cigarette tax Report.Continuing.Area Resource File(ARF).Demographic,'health facility and manpower data at State andCounty level from various sources. DHHSHealth Resources Administration. Area Re-source File: A Manpower Planning and.Re-search Tool. DHHSHRA:80--4, Oct 79. Onetime compilation.Selectedhealth data. DHESNCHS. NCHSStatisticalNotes for Health Planners.Compila-tions and analysis of data to State level. MISUSE OF .ALCOHOL AND,DRUGS/*-!:-..':Nahn.e and Extent of the Problem71-- A major obje

68 ctive of the drug and alcohol privention
ctive of the drug and alcohol priventionpolicy is to reduce the adverse social and healtcon-sequences associated with the misuse of thesub-stances, especially among adolescents, youadults,pregnant women and the elderly.Alcohol and 'other drug problems haventasieffects:biological,psychological and socialk 'conse-quences for the abuser; psychological and social effectson familymemtrs and others; increased risk of*mjuryand death to,self, family members and others.(espe-cially by accidents, fires or violence); and derivativesocial and economic consequences for society at large.Destructive drug and alcohol use shares many similar-Wei with tobacco( use and may respond to some of thesame prevention strategies (see Smoking and Health)...Per capita alcohol coffsurnption and use of otherdrugs for non-medical purposes decreases with olderage groups, but the use of drugs for medical purposes,bothover-the-counter and prescriptiondrugs,in-crease". Since the aging proCess is accompanied byphysiologic changes that alter the body's response toboth food and drugs, practices of self-medication,over-prescribing and the concurrent use of two or moredrugs can createserious health problems for theeldest Concurrent misuse of alcohol and drugs con-sumed for either non-medical or medical purposes in-creases risks to health arid complicates the deliveryand financing of preventive and treatment measuresfrom both private and public sources.*NOTE: For purposes of this report, the term "use ofother drug'" refers to self-reported use of licit orillicit drugs for non-medical or self-defined purposes.It does not include inappropriate use of drugs con-sumed for medical purposes, nor the use of alcoholor tobacco. These arc discussed separately.a. Health implication;ALCOHOLIn 1975, an estimated 30,000 deaths from cir-rhosis, alcoholism or alcohOlic psychosis couldbe directly attributed to alcohol use.In 1975, an additional 51,000 fatalities could beindirectly attributed to alcohol use.Alcohol has been identified as a risk factor forcancers of the oral cavity, esophagus and liver.In 1977, about 45 percent of all motor vehiclefatalities involved drivers with blood illcohol6765levels of .10 percent or more, a rate of 11.5per 100,000 population.In 1975, the costs of alcohol problems wereestimated to be $43 billion in lost 'production,health and medical services, accidents, crimeand other social consequences.The Fetal Alcohol Syndrome is estimated tocause some' 1,400 to 2,000 birth defects an-nually.OTHER DRUGSThe vast majority of users of "other drugs" aremarijuana users, but the category is not limitedto this group.The social cost of drug abuse, including Lawenforcement, has been estimated to be at least$10 billion per year, a figure ,which may be anunderestimateconsideringthedifficultiesofmeasuring the aggregate health and social con-sequences 51 those behaviors.Between May 1976 and April '1977, there werean estimated 7,000 to 8,000 death's and an esti-mated 275,000 to 300,000 medical emergenciesrelated to misuse of drugs.An undetermined portion of deaths and medicalemergencies relate to drug use for suicide and,attempted suicide (see Gontrol of Stress andViolent Behavior) and may be very difficult toprevent.Barbiturates were the class of drugs mentionedmost frequently by medical examiners in con-nection with drug-related deaths reported to theDrug 'Abuse Warning Netw9xk between May1977 and April 1978 (2 percent of drugs men-tioned).Tranquilizers were the class of tlrugs mentionedmost frequently by 'emergency rooms during the/same period (24 percent of drugs Mentioned)."The proportion of barbiturate and Vanquilizermisuse that is deliberate,and the proportion thatis accidental is not k

69 nown.DRUGS USED FOR MEDICAL PURPOSESUse
nown.DRUGS USED FOR MEDICAL PURPOSESUse of high estrogen content oral contraceptive&by women smokers increases risks of coronaryand cerebrovascular,disease.See Family PlanningPeople over 65 years of age, 11 percent of thepopulation, use more drugs andforlongerperiods of time than any other 'age group, ac- counting for 30 percent of all medicines con-sumed.The risk of adverse drug reactiosin elderlypatients is almost twice that in patients between30 and 40 years of age:,Between 70 and ;40 percent of reactions are pre-dictable and-preventable.Between 0.3 and 1.0 percent of the nation's total35.5 million hospital admissions each year aredue to adverse drug reactions.Improper use of drugs 'forces curtailment ofnormal activities, or. contributes to such curtaiment, in an unknownroportion of the disapopulation.b.Status aad treadsALCOHOL',An estimated 10 percent of the a4ult population18 years and over are ffequent ffeavy drinkers(5 or more dnnies per occasion at least onceper week )Most problems indirectly attributable-to alcohol(homicides, car crashes) have the highest ratesamong young adult males ages 18 to 24 years.'IL-National surveys indicate no changes in peakquantity consumed by teenagers 12 to 17 (fiveor more beers ata' time) or in regularity oftheir drinking, between 1974 and 1978.Alcoholism mortality rates (2 per 100,000) andalcoholic psychosis rates (1 per 100,000) showlittle overall increase between 1950 and 1975.Based on survey reports and tax -paid with-drawals, per capita consumption of absolutealcOhol did not change significantly during theyears 1971 to 1976 More. recent data indicatethat per capital consumption began to increase:again after 1976, from 2.7 gallons to 2.82 .gal-Ions of absolute alcohol per capita in1978.Whether the increase will continue is not yetknown.OTHER DRUGSA dramatis' decline in level of heroin-relatedmedical problem indicators was seen from 1976to 1977, suggesting a decline in heroin use.The proportign of adolescents (12 to 17 yearsold) reporting curnt use of marijuana hasbeen rising continuoly for the last decade andhas increased significtly from 6 percent in1971 to 16 percent in 177.°The proportion of young adults (18 to 25 yearsold) reporting that they hadever, used marijuanarose from 39 percent in 1971 td 60 percent in1977.It has been estimated that there are approxi-mately 2,500,000 persons (roughly 2 percent ofihe population age 18 and over) having seriousdrug problems.Epidemiological evidence suggests that the useoralcohol, tobacco and marijuana by adoles-'ceists is associated.DRUGS USED FOR MEDICAL PURPOSES,Barbiturate-related mortality accounted for lessthan 1,300 deaths in 1976.2. Prevention/Promotion Measures-a.Potential measuresEducation and information measures include:general public information campaigns, andprograms targeted to children and yquth andto specific at-risk populations, with specificmessages to facilitate problem recognition orreinforce desired behavior;programs targeted at a wide array of serviceprofessions concerning the recognition") of,and responses to, alcohol and other drugproblems;information on medicine labels on drug/drug, drug/food and drug/alcohol interac-tions, with practical guidance on avoidingclinically significant interactions;school and community-based health educa-tion programs, some using peer leaders andmodels;special education programs emphasizing ef-fective risk-management skills and alterna-tives to drug and alcohol use;education of physicians,'Inursing home staffand patients about hazards surrounding themisuse of tranquilizers, hypnoticS" and otherclasses of prescription and nonprescriptiondrugs;easily- understandable information availableto patients' taking dru

70 gs' for medical par-,posesService measur
gs' for medical par-,posesService measures include:programs which offer general social support(youth centers, recreation programs) andthereby provide alternatives to drug andalcohol use;outreach and early intervention services atthe worksitcand in community settings forpersons whose behavior indicates that theyare at-risk for the development of alcoholor other drug problems;anticipatory guidance, identification of chil-dren at high risk of alcoholism;a broad range of treatment services in em-ployeeassistanceprograms,ingeneralhealth care delivery settings and in special-ized alcohol and drug facilities;counseling by pharmacists to older peopletaking drugs f6r medical purposes;maintenance of computerized drug profiles;hotlines and drug information"centers people,can use to learn about drug bffects andinteractions.68Technologic measures inclproduct safety changof injuliand deathuse of alcohol and6 Cde:which reduce the riskplaces' associated withther drugs (e.g., airbags in motor vehicles and improved fireproofingin residences);.modification to alcoholic beverages them -selves %(e.g., reduction of alcohol content,reduction or elimination of nitrosamines);efforts by community institutions to modifysocial settings and contexts to reduce the riskassociated with intoxication and to altersocial reaction to some types of drinking or.drug-using behavior.Legislative and regulatory measures include:regulating the conditions of availability ofalcoholic beverages (i.e., zoning regulationsregarding hours of sale, numbers of outletsand numbers of licrnses);enforcing minimum drinking age laws andemploying legal-disincentives to discouragethe dispensing of alcohol to obviously intoxi-,i-cated persoirs;enforci, g laws prohibiting, driving while in-tbxiced by arEohol or drugs and initiatingstro ger legal disincentives;controlling advertising ofalcoholic bever-ages;enforcing laws related to production, distri-bution and use of `:other drugs" that areproscribed except for medical and scientificpurposes; special law enforcementagenciesare respottrible for enforcing suchprohibi-tions and violations are punishable by crim-inal sanctions;regulation of conditions under which thecasubstances are available for authorized uses,such as measures relating to schedulingof"controlled substances' and limitations onprescriptions;periodic re-examination of sanctions to en-sure correspondence to thedegree of severityof the health and social problems associatedwith. the overuse of each particular 'sub-stance or drug;patient labeling for certain prescription drugs(estrogens, progestins);---- drug information for patientsinnursinghomes and in other long-term care facilities.Economic measures include:excisetaxes on alcoholic beverages andother means of affecting the price of alcohol;tax incentives or disincentives tocontrollevels of advertising expenditures for alco-holic beverages.b.Relative strength of the measures.....,Systematic evaluation of tlie effects ofeducitionand yearly intervention prograpstargeted atchildren and youth and populations at specialrisk is at an early stage.Regulatory measures have been theNation's .primary tool of drug abuse preventionduringmost of the 20th rentury. Thereis much debate69about the overall cost-benefit assessment of thecurrent prohibitions. From a morelimited per-spective, however, some recent treads tend tosupport claims that regulatory approacheshavehad an impact on the extent of,drug use.Heroin addiction in this country has been de-clining in recent years, coincident with reducedsupplies on the illegal market and the extensiveavailability of treatment services: Late in 1979,however, the supply and incidence of heroin useincreased in several Easte

71 rn citiet. Also, bar-biturate-relatedmor
rn citiet. Also, bar-biturate-relatedmortalityhas been decliningsteadily as a result of increased legal controls,greater physician awareness of the mosteffica-cious userbf these drugs, and improved publicawareness of the hazards associatedwith theuse of barbiturates in combinationwith otherdepressants.Mass media campaigns thai have focused publicattention upon alcohol use and abuse may havecontributed to a period of relative stability inalcohol' consumption during the seventies (al-though economic conditions were also a likelysignificant factor). Alcohol problems, _as notedby several indicators (cirrhosis mortality ratedecline, survey data on 'alcohol consumptionamong youth and adults), appitr Also 'to haveleveled off during this period of apparent stabil-ity. NIAlle direct causal attribution is not possi-ble,,the creation of a National alcoholism treat-ment network and early intervention servicesinthe workplace probably playedrale in thestabilization of cirrhosis deaths.Alcoholic beverage regulation has not tradition-ally been focused on public health considera-tions, but data concerning the impact of regula-toryinitiatives on tobacco smoking may betransferable to the alcohol area. Research hereand in other countries suggests that the avail-ability of alcohol may affect the level and typeof alcohol problems, particularly physicalhealthproblems consequenttolong-termexcessivedrinking. Cbnsumption, in turn, has been-linkedfairly conclusively le the relative price of alco-hol, and less conclusively to such factors as thelegal- purchase age, number- and dispersion ofretail on-premise and off-premise outlets, andhours of sale. Also "Dram Shop" laws can offerpowerful incentives for alcoholic beverage licen-sees to try to reduce the likelihoodof intoxica-tion among their patrons.In general, alcohol and drug education programscan increase informationlevels anmodifyattitudes. Their effect on drinkingrug-usingbehavior has not yet been demoted conclu-sively, although recent studies have yielded en-couraging preliminary findings.3. Specific Objectives for 1990Improved health statusa.By 1990, fatalities' from motor vehicle accidents67 involving drivers With blood alcohol levels of`.10 percent or more should be reduced to lessthan 9.5 per 100,000 population per year. (In197, there were 11.5 per 100,000 populatinn.)b.By 1990, fatalities from other (non-motor ve-hicle) accidents, indirectly attributable to alco-hol use, e.g., falls, fires, drownings, ski mobile,aircraft) should be reduced to 5 per- 100,000population per year. (In 1975, there were 7 per100,000 population.)c.By 1990, the cirrhosis mortality rate should beretticed to 12 per 100,000 per year. (In 1978,the rate was 13.8 per 100,000 per year.)*d.By 1990, the incidence of infants born with theFetal Alcohol Syndrome should be reduced by25 percent. (In 1977, the rate was 1 per 2,000births, or appro3imately 1,650 cases.)*NOTE: Same objective as for Pregnancy andInfant Health.e.By 1990, other drug-related mortality should bereduced to 2 per 100,000 per year. (In 1978,the rate was about 2.8 per mop.)f.By-1990, -adverse reactions from medical druguse that are sufficiently severe to ,cequire hospi-tal admission should be reduced to 25 percentfewer such admissions per year. -4In 1979, esti-mates range from approximately 105,000 to350,000 admissions per year.)Reduced risk factorsBy 1990, per capita consumption of alcoholshould not exceed current levels.(In1978,about 2.82 gallons of absolute alcohol were con-sumed per year per person age 14 years andover.)h.By 1990, the proportion of adolescents 12 to 17years old who abstain from using alcohol orother drugs should not fall below 1977 levels.(In1977, the proporti

72 on of abstainers was:46 percent for alco
on of abstainers was:46 percent for alcohol; for other dpigs, rangingfrom 89 percent for marijuana to"9.9percentfor heroin.*)*NOTE: A person is defined as not using alcoholor other drugs if he or she has never used thesubstance or if tie last use of the substancewas more than one month earlier.i.By 1990, the proportion of adolescents 14 to 17yearsold who reportacute drinking-relatedproblems during the past year should be reducedto below 17 percent.* (In 1978, it was estimatedto be 19 percent based on 1974 survey data.)*NOTE: Acute drinking-related problems havebeen defined as problems suclwas episodes ofdrunkenness;drivingwhileintoxicated,ordrinking-related problems with school authori-ties.By 1990, the proportion of problem drinkersamong all adults aged 18 and over shoUld beg.1.70reduced to 8 percent. (In 1979, itbout 10percent.)k. By 1990, the proportion of young a ults 18 to 25years old reporting frequentuse of other drugsshould not exceed 1.977 levels. (In 1977, it wasless than one percent for drugs other than mari-juana and 19 percent for marijuana')*NOTE: "Frequent use of other drugs" meansthe non-medical use of any specific drug on 5or more days during the previous month.I.By 1990, the proportion of adolescents 12 to 17years old reporting frequent use of other drugsshould not exceed 1977.1evels. (In 19747, it wasless than 1 percent for drugs other than mari-juana and 9 percent for marijuana.)Increased public/professional awareness,m. By 1990, the-proportion of women of childbear-......ing age aware of risks associated with pregnancyand drinking, in particular, the Fetal AlcoholSyndrome, should be greater than 90 percent.(In 1979, it was 73 percent.)By t990, the proportion of adults who areaware of the added risk of head and neck can-cers for people with excessive alcohol consump-tion should exceed 75 percent. (Baseline dataunavailable.)o.By 1990, 80 percent of high school seniorsshould state that they perceive great risk- asso-ciated with frequent regular cigarette smoking,marijuana use,-barbiturate use or alcohol intoxi-cation.(In 1979, 63 percent of high schoolseniors perceived "great risk" to be associatedwith l'or 2 packs of cigarettes smoked daily, 42percent with regular marijuana use, 72 percentwith regular barbiturate use, and only 35 per-cent with having 5 or more drinks per occasiononce or twice each weekend..)By1990,pharmacistsfillingprescriptionsshould routinely counsel patients on the properuse of drugs designated as high priority by theFDA, with particular attention to prescriptionsfor pediatric and geriatric patients apd to _theproblems of drinking alcoholioibeveragestakingcertainprescriptiondrugs,(Baselinedata unavailable.)Improved services/protectionBy 1990, the proportion of workers in majorfirms whose employers providea substanceabuse prevention and referral program (em-ployee assistance) should be greater 'than 70percent. (In 1976, 50 percent of a sample ofthe Fortune 500 firms offered some type- ofemployee assistance program.)r. Ay 1990, standard medical and pharmaceuticalpractice should include drug profiles on 90 per-cent of adults covered under the Medicare pro-gram, and on 75 percent of other patients withacute and chronic illnesses being cared for inn.P.q. ,J.allprimate and , organized medicalsettings.1Baselittedatiunavaille),,,-.ImprOved surveillance /evaluation syptemss.By 199Q,acomprehensive ;datacapabilityshould be established to monitor and evaluatethe status and impact ,of misus*aisohol anddrugs on: health status; motor, vehicle acci-dents; accidental. injuries in addition to ;thosefrom motor vehicles; interpersonalessionandlenie; sexualassault;v',-4141 .m andproperty damage; ,pregnancy ou -.Ines; andemotiona

73 l and physical development of infantsand
l and physical development of infantsand children'4. Principal AssumptionsThe Federal emphasis on research and technicalassistance will continue, with primary reliance onState and local governments and the voluntary sec-tor for delivery of alcohol and drug abuse fireven:tion i'erVices.Resources and services devoted by -State artd localgovernments, and voluntary groups, for dritg andalcohol prevention programs and services will ePand.Federal funding for 'research and evaluation in drugand alcohol prevention will'modestly increase, withspecial attention to the priority areas reflected inthe proposed ti bjectives.Fedekal informationinitiativeswillcontinuetosensitize the pnblic to the adverse social and healthconsequences Of heavy or.frequFnt use of alcoholand'other drugs.Strong arid varied initiatives bo'public and pri-vate, will seek to minimize uof tobacco, alcoholand other drugs by children and adolescent4=in-eluding coordinated efforts with alcohol producers,distributors, retailers ar0State alcohottOntrOl com-missions.The allocation of resources by alcohol producers,distributors and retailersqo the marketing, promo-tion-and distribution of ,alcoholic beverages willprobably increase.No dramatic shift in tax or regulatory policies to-ward availability and consumption' of alcoholicbeverages will occur, unless con's'umption trendsrequire reconsideration.There will be no dramatic or permanent-shift in/heavailability of controlled substances outside legiti-mate medical and scientific channels.. The trend will continue toward modification of thecriminal law and its less punitive administration incases involving arrests fOr Rerionaliossession ofmarijuana and other drugs.4D ata Sourcesa. To National level only.....Health Interview Survey ,(HIS). Accidental in-juries, disability, use of hospital, medical andother services; and other health-related topics.49-2S6 0 -,81'- 6,4,4'11''.----DHHS2National Center for Health Statistics(NCHS). NCHS Vital and Health Statistics,Series_10, selected reports, and Advance Data,selected reports: Continuing household inter-view survey; National probability sarrfplei.Health Examination Survey (HES) and theHealthandNutritionExaminationSurvey(HANES). Alcohol and drug related condi-tions. DHHS-NCHS. Vital and Health Stittistics,Series11, selected reports. Periodic surveys;Nationalprobabilitysamples; data obtainedfrom physician's examinations.-National Hospital Discharge Su($DS).Utilization of hospital services relato misuseof alcohol and drugs. DHNS-NCHS Vital andHealth Statistics,Series13. Continuing;* Na-tional probabilitpample, short stay hospitals.NationalAmbulatory Medical ...eTreStu:vey(NiiMc&O. Alcohol and drug related patient-physiciar encounters. DHHS-NCHS. NCHSWI and Health Statistics, Series 13. Continu-ing survey; National probability sample, officeis.based physicians...The lifestyle and ialues of youth. Non-medicaluse of substance in12 Categories includingmarijuana, barbiturates, cocaine,prescriptiondrugs, alcohol, cigarettes. DHHS-NIDA Drugsin the Class of (survey yedate), Beviors,Attitudes and Recent NationTrends, seriesNumber 20. Annual surveys sine 1§1highschool seniors in a National sapublicand private, schools.The Wational Survey on Drug Abuse. Estimatesof the leveof illicit and lieigal drug use in theUnited Stes: marijuana-hashish, cocaine, hal-,lucinons, heroin and other opiates; summaryof data on use of inhalants, alcohol, cigarettes1and die non-medical use of psychotherapeuticdrugs legally prescribed. DHHS-NIDA. 'High-lights from the National Survey on Drug Abuse,1977. Continuing suryey since 1971; National.6sample..'Drug Abuse..WarningreNetwork (DAWN): Drug.abuse encountered in emergency rooms andmedica

74 l examination offices. DHHS-NIDA andOle
l examination offices. DHHS-NIDA andOle Drug Enforcement Administration. Quar-terlyreportsofprovisionaldata Series G,NIDA. Continuing survey in 2t, standard metro-.politan statistical areas.National Prescription Audit (NPA). Drug sales,including barbiturates, tranquilizers; source ofprescription; payment status, provider type. IMSAmerica, Ltd., Ambler, Pennsylvania. 1MS re-ports. Continuing audit of pharmacies on IMSpanel.Third Special Report to the U.S. Congress onAlcohol and Health, June 1978. Sflbsecinentreports will be available approxiMatelythree years. b. To State sad/or local levelNational Vital Registration SystemMortality. Deaths by cause (including alco-hol and drug related), by age; sex and race,DHHS-NCHS. NCHS Vital Statistics of the° United States, Vol II, and NCHS MonthlyVital Statistics Reports. Continding report-ing from States; National full count., (ManyStates issue earlier reports.)Hospitalized illness discharge abstract systems.Professional Activities Study (PAS). Pa-tients in short stay hospitals; patient charac-teristics, alcohol and drug related diagnoses,procedure§ performed, length of stays. Com-mission on Professional andllospital Activi-ties, .Ann Arbor, Michigan. Annual reportsand tapes. Contmuous reporting' from 1900CPHA member hospitals; not a probabilitysample, extent of hospital paidtipationvar-ies by State.Medicare hospital patient reporting system( MEDPAR)Characteristics of Medicarepatients,diagnosis,procedures.DHHS-aIV72/IHea6;CareFinancingAdministration,Office of Research, Demonstration and Sta-tistics (ORDS). Periodic reports. Confirm,-ing reporting from hospital claim data; 20percent sample.Other hospipedtscharge systems as locallyavailable.Area ResourceFile(ARF). Demographic,health facility and manpower data at State andcounty level from -varioussources. DHHS-Health Resources Administration Area Re-source File: A Manpower Planning and Re-search. Tool, DHHS-HRA-80-4, Oct. 79. Onetime compilation.Annual Census of State and County MentalHospitals. Resident patients and new admissionsto mental institution's; costs, diagnoses of alco-hol psychoses. DHHS-ADAMHA, NationAgin-stituteof Mental Health (NIMH).alHealth Statistical Notes, selected issues; specialreports and tabulations furnished to the Centerfor Disease Control. Continuing reporting; Na-tional full count of patients in State and countymental hospitals.mgr NUTRITION,or1. Nature and Extent of the ProblemIssues related to nutrition' and fsumption in-volve complex interactions amooural,economic and physiologidal factors. Adequintakesof sources of energy. and of essential nutrients arenecessary for satisfactory-rates of growth and develop-ment, physical activity, reproduction, lactation, recov-ery from illness and injury and maintenance of healththrough the' life cycle. Deficits of essential nutrientsor energy sourceslead to several specific diseasesor disabilitiesExcessive or inacreased susceptibility to others.priate consumption of some nu-trients may contribute to adverse conditions, such asobesity, or may increase the risk for certain diseases.(e.g., heart disease, adult-onset diabetes, high bloodpressure, dental caries and possibly some types ofcancer). Such chronic diseases are clearly of complexetiology, with substantial variation in individual sus-ceptibility to the factors involved. While the role ofnutrients in these diseases is not definitively estab-lished, epidemiologic and laboratory studies offer im-portant insights which may help people in making foodchoices so as to enhance their prospects of maintaining.,health. See High Blood Pressure, Physical Fitness andExercise, and Fluoridation and Dental Health.a.Health implicationsObesity increases the

75 risk for adult-onset dia-betes and high
risk for adult-onset dia-betes and high blood pressure,th, of whichare associated with cardiovascularisease. Obe-sity also increases risk of galibla der disease,elegenervive joint diseases, and some types ofcancer (e.g. endometrial cancer). (Obesity isdefined 4 this discussion as significant over-weight, re., 120 percent or more of "ideal"weight.)Freqdent consumption of highly cariogenic foods(those containing fermentable, orally-retentivecarbohxdrates), especially between meals, cannullify some of, the caries preventive benefits ofadequate fluoride intake and/or can cause ramp-ant caries in children with a fluoride deficiency.Inadequate nutrition may be one factor asso-ciated with poor pregnancy outcome, includingsome fraction of low birth weight in ants, andsuboptimum mental and physical delopment.Excessive sodium intake has beenssociatedwith high blood pressure in suscepti le individ-uals...L.*PikTotal dietary fat, saturated fat and cholesterol"may influence risk factors for heart disease.Erg more foods high in fiber may reduce thesymptoms of chronic constipation, diverticulosisand some types of "irritable bowel" in someindividuals.Dietary fat has been associated epidemiologic-ally with some .cancers, but better understand-ing, of the strengthrelationship mustawait the outcomef ongointudies.Breast fed infants appear to, enjoy significanthealth advantages when compgred with infantsfed with breast rhilk substitutes, in particular,the immunologic characteristics of breast milkmay increase resistance to infections' and per-haps certain allergies..1*Poor nutrition may enhance susceptibility orimpair host response to infections.See Misuse of Alcohol and Drugs, and Preg-nancy and Infant Health.b.Status and trendsOver the 10 yeaci from 1963 to 1973, meanbody weight of American men and Ameriianwomen, ages 18 to 74, increased by an averageof six pounds and three pounds, respectively.Height did not play an appreciable role in ac-counting for the increase.Iron and folic acid,deficiencies are particularlycommon among pregnant or lactating women.Average blood cholesterol levels in the UnitedState among men of allage groups declinedslightly between surveys conducted in 1960-62and 1971-74; among women, blood cholesterollevels declined as much as 7 percent in the' age group 55 to 64., and 6 percent in tlk. agegroup 65 to 74.Some subsets of the population are more proneto obesity than others:for people ages 20 to 74, about 14 percentof men and 24 percent of women meet thecriterionforobesity'(120, percentof`Ideal");of men who are not poor, about 12 percentof blacks and 13 percent of whites ages 45to 64 are obese;of men who are poor, only 4 percent ofblacks and 5 percent of,whitesages 45 to64 are obese;73low7A of women who are not pods, 4.0 percent ofblacks and 29 percent of whites ages 45 to64 are obese;_of women who are poor; 49 percent ofblacks and 26 percent of whites ages 45 to64 are obese.6 Prevalence of breast feeding declined from 65percent in the late 1940s to 26 percent in 1969.In the past decade, prevalence of breastfeedinghas increased to 45 percent of newborns, atleast initially. In contrast to -the past, however,women of lower socioeconomic status are nowless likely to breastfeed than women of highersocioeconomic status.2. Prevention/Promotion Measuresa.Potential meta oresEducatii; and information measures include:increasing awareness of idealweigh[' rangesand safe weight reduction and weight con-trolstrategies based on energybalanceconcepts;increasing awareness of the science baseregarding- relationship3/ between diet andheart disease, high blood pressure, ccancers, diabetes,den* caries-and oconditions,providing information and behavioral sItstd s

76 elect and prepare more healthfuletsdevel
elect and prepare more healthfuletsdeveloping more effective means of coin-*mating nutntion information to peoplein different age and ethnic groups;providing nutrition information and 'educa-tion about healthy food choices in the home(via the media), in schools, at the worksite,by and to health care providers, at the pointpf purchase, aira part of government foodservice programs (such as Project HeadStart, school lunch and WIC PrOgrams) andby appropriate advertising;providing appropriate information on theadvantages and techniques of breastfeedingand when appropriate, alternatives, particu-.larly for low income women. ,Service measures include:nutritious breakfast and lunch programs forschool children and meals for senior citizens;food stamps for low income populations;food supplements for low income women,ifitts and children at risk for nutritionalproblems;nentious food offered in business and insti-tutional settings; .counseling related to dietary practices rou-tinely offered to high risk individuals throughhealth care system, schools and work-places;psychosocialsupport groups focusecl cnweight control and weight maintenancllcounseling regarding the merits of breast-feeding, and 'appropriate techniques.Technologic measures include:ensuring nutritional quality, and content ofde..manufactured foodstuffs, from productionthrough consumption;,-- changinglivestockpracticestoproduceleaner meat;fortifying certain foodstuffs;111l developing and making readilyavailablenew products lower in fat; saturated fat,cholesterol, sodiuit and sugars;positioning products in supermarkets so thatkeyinformationon :caloric,cholesterol,.sodium and sugar contents of products isreadily apparent.Legislative and regulatory measures include:promulgation of guidelines to maintain orimprove the nutritional quality of the foodsupply;requiring nutrition labeling on foods about'which nutrition claims are made or to which'nutrients are added,' including informationoncalories,fat,carbohydrate,protein,cholesterol, sugars,,sodium and other nutri-ents of public health concern;providing explicit discretionary authority toregulate fortification of foods when it is ofpublic health significance;regulationof food vwding practicesinschools and health fortifies to reduce oreliminate highly cariogenic foods and snacks;grading standards to give greater emphasisto lower fat products;regulating televisedadverti.4ments whichpromote caridgenic and non-nutritious foodsand snacks and which are directed at youngchildreni..;Economic measures include:studying possibilities for adjusting insurancepremiums, in relation to relative risk, forcorporapons offering employee health pro-motion programs 'withanutrition com-ponent;government fbod purchasing support prac-tices;assessing feasibility and cost benefits of re-.imbursement by third party payers of coun-selingserviceswhichmeetappropriatestandards;reducing or eliminating local sales taxes onstaple toads.b.Relative strength of die measuresService programs are-likely to be effective inimproving thenutrittlfalstatus of pregnantwomen and children and, perhaps in reducingthe incidence of low birth weight infants.Certain "segments of the public have respondedto educational and informational messages abouteats and cholesterol by reducing their intakes.On the other hand, some recent messtilik havebeen mixed and contradictory, leaving the pub-confused. The DHHS/USDA Dietary Guide-lines for Americans provide a simple set ofpractical recommendations.Technologic measures hold real promise, par-*ularly if governmental policies could be gen- crated in support of such measures and if re-sultant products are acceptable to consumers.With the eAcelktion of food -sanitatio

77 n, regulationand economic incentives hav
n, regulationand economic incentives have,not been ern-florpieyed and are, therefore, of unreFtain potential.Educcation'and counseling programs regardingbreistfeeding have beerisuccessful in increasingthe prevalence of breastfeeding among middleand upper income women. It-is reasonable toexpect similar results from programs targetinglow income women.3. Specific Objectives' for 1990 or EarlierImproved health statusImprovements innutrition may yield reducedtares of infant mortality, cardiovascular disease,dental caries and possibly some cancers Certainquantified health status objectives are specifiedin the sections on High Blood Pressure Control,Pregnancy and Infant Health, and Flouridationand Dental Health Others are noted below. Stillothers (particularly those related to heart dis-ease and cancer) are not stated, due to uncer-taintiesin quantifying. the exposure-to-.diseakrelationshipa.By 190, the proportion of pregnant womenwith iron deficiency anemia (as estimated byhemoglobm concentrations early in pregnancy)should be reduced to 3 5 percent. (In 1978, theproportion was 7 7 percent.)bBy'1990, growth retardation of infants and chil-dren' caused by inadequate diets should havebeen e/minated in the Limited States as a publichealth problem. (In 19.72-73, it was estimatedthat 10 to 15 percent of infants and childrenamong migratory workers and certain poor rusepopulations suffered growth retardation due todiet inadequacies )Reduced risk factors"c.By 1990, the prevalence of significantover-weight (120 percent of "desired" weight) amongthe U.S. adult population should beirecreasedto 10 percent of.men and 17 percent of women,without nutritional impairment. (In 1971-74,14 percent of adult men and 24 percent ofwomen were. More than 120 percent of "de-sired" weight.).*NOTE: Same bjecti.ve atfor High Blood Pres-sure Contfol,d.By 1990, 50rcent of the overweight popula-tion should h %adopted weight loss regimens,combining an aiiipropriate balance of diet andphysical activity. (Baseline data unavailable )ift By 1990, the mean serum cholesterol level inthe-adult population aged 18 to 74 should be ator below 200 "mg/d1(In 1971-74,, for 'maleand female adults aged 18 to 74, the meanserum cholesterol level was 223 mg /dl. For a/75Lsmaller _population sample in 1972-75, meanblood plasma cholesterol levels were about 211mg/di for males aged 40 to 59 and about 210mg/di for females aged 40 to 59!)f.By 1990, the mean serum cholesterol level inchildren aged 1 to 14 should be at or below 150tng /dl. (In 1971-74, for children aged 1 to 17,the mean serum cholesterol level was 176 mg/.d1. For a smaller population -samfde in 1972-75,the mean blood. plasma cholesterol levelforchildren aged 10 to 14. was about 160 mg/c11.)*g,By 1990, the average daily sodium ingestion .(asmeasured by excretion) by adults should bereduced at least to the 3 to 6 gram range. (In1979, estimates ranged between averages of 4and 10 grams sodium. NOTE: One gram saltprovides approximately .4 grams indium.)*NOTE: Same objective as for High Blood Pres-.-sure Control.hBy 1990, the proportion of women who breast-feed, their babies at hospital discharge should beincreased to 75 percent and 35 percent at sixmonths of age. (In 1978, the proportion was45 percent at hospital discharge and 21. percentat 6 months' of age.)Increased public/professional awartnessi.By 1990, the proportion of the population whichis able to identify the principal dietary factorsknown or strongly suspected to be related todisease, should exceed 75 percent for each ofthefollowingdiseases.heartdisease,highblood pressure, dental caries and cancer. (Base-line data largely unavailable. About 12 percentof adults are aware of the relationship

78 betweenhigh bloWd pressure and sodium in
betweenhigh bloWd pressure and sodium intake.)By 1990, 70 percent of adults should be able toidentify the major foOds which are: low in fatcontent, low In sodium content, high in calories,good sources of fiber(Baseline data unavail-able.)k. By 1990, 90 percent of adults should understandthat to lose weight people must.either consumefoods that - contain fewer calories or increasephysical activityor both. (Baseline data un-Improved services /protection1.By 490, the labels of all packaged foods shouldcontain useful calorie and nutrient informationto enable consumers to select diets that pro-mote and protect good health. Similar informa-tion should be displayed where nonpackagedfoods are obtained or purchased.m. By 1990, sodium levelsinprocessed foodshould be reduced by .20 percent from presentlevels. (Baseline data unavailable.)n.By 1985, the proportion of employee and "schoolcafeteria managers who are aware of, and ac-tively promoting, USDA /DHHS dietary guide-lines shoulckabe greater than 50 percent.j.vak o. By 1990, all States should includenutritioneducation as part of required comprehensiveschool health education al elementary and sec-ondary levels. (In 1979, only 10 States man--dated nutrition as a cote content area in schoolhealth education.)p.By 1990, virtually all routine healscontactswith health professionals should include ,someelement ofnutritioheducation andnu&tioncounseling. (Baseline data unavailable.)Improved surveillance/evatikatio,q.Before 1990, a comprehensive Nationtion status monitoring system should hacapability for detecting nutritional problems inspecial population groups, as well as for obtain-ing baseline data for decisions on Nationalnutrition policies.4. Principal AssumptionsEffortstopromotethe DHHS/USDADietaryGuidelines for Americanswill involve wide publicand private sector participation and support.Governmental efforts in nutrition education will becontinued and improved.Public and private efforts to make the populationaware of the science base with respect todiet andchronic disease will beexpanded,including thoseareas for which controversy exists.Currentresearch effortsto improve thesciencebase with respect to diet and disease will continueto grow, with improved dissemination ofinforma-tion.Research to identify effective measures of nutritioneducation will be productiveCurrenteffortsto develop a National nutritionmonitoring and surveitance system will be main-tained.a.Programs to promote economic and physical accessto high quality foods will be continued andim-proved.Cooperation between Government and the privatehealth care sector willincreaseon nutrition relatedissues.Major food processors and distributors will incor-porate nutrition principles and concepts intotheirfood and marketing strategies and messages.Public and private sector efforts to maintain thewholesomeness of the food supply will continue.Better methods to monitor the population's knowl-edge and understanding of nutrition will be devel-oped.'Nutrition messages aired over television and radiowillcontinue, and willbe more explicit astohealthful diets.Comprehensive school health education, includingnutrition education, will become a more integralpan of the K-12 curriculum.Health professionals will play a larger role in theprovision of nutrition information.A set of principles of human nutrition will be de-fined and used as a basis for public policydecisions.76lbS. Data Sourcesa. To National level onlyHealthandNutritionExaminationSurvey(HANES). Height, weight, skinfold thickness;serum cholesterol values and breast feeding.DHHS-National CenterforHealthStatistics(NCHS). HANES I, 1971-1974; HANESII,1979. NCHSVital and Health Statistics,Series11. Periodic surve

79 ys; data obtained Mom physi-cal examinat
ys; data obtained Mom physi-cal examinations, National probability sample.Health Interview Survey (HIS). Food practices,food habits, based on data collected in a con-tinuingnationwidesurveythrpugh personalhousehold interviews. DHHS-NCHS.Vital andHealth Statistics,Series 10. Continuing survey;household interview, National probability sani-ple.Lipid Research Clinics. Prevalence of dyslipi-demias in defined populations,andcholesterollevels in hypercholesterolemic men and womenbetween 35-59 years. DHHS-National Heart,Lung, and Blood Institute (NHLBI). Continu-ous reporting froth 10 international clinics.Hypertension Detection and Follow Up Pro-gram. Nutrition related risk factors among per-sons athighriskof coronary and vasculardiseases.DHHS-NHLBI.NHLBI-(NIH)Hypertension Task Force Reports, Numbers8and 9. One time survey.MultipleRiskFactorInterventionTrial(MRFIT). Testing whether nutrition and otherrisk reduction interventions in men 35-54 yearsofage who are above average risk of death fromcoronary disease, can yield significant reductioninmortalityfromcoronaryheartdisease.DHHS-NHLBI. Report due 1983.Marketing Researchey.Prevalence andtrends of breastfeeat one week of age.Marketing Research Department, Ross Labora-tory, Illb I umb us, Ohio. Reported inPediatrics,November 1979. Cont. uing survey;representa-tivesample ofshorthospitals; recall re-sponse of mothers after six months.Nationwide Food Consumption Survey (NFCS).Food intake of individualsandhouseholds.Na-tionalFood ConsumptionSurveyReport.USDA-Consumer and Food Economics Insti-tute, Human Nutrition Center (HNC). Collectednationally about every 10 years since 1935.National survey of sample of households.National Survey of Family Growth (NSFG).Prevalenceofbreastfeeding.DHHS-NCHS,Vital and Health Statistics,Series 23, selectedreports. Interview survey of 10,000 women in.National probability sample representing Ameri- ,can women 15-44 yeats of age.Nutrient Composition Data. Tabular analysis ofnutrient composition of specific food products.\USDA- Consumer and Food Economics Insti- tute. Agriculture Handbook Number 8:Com-Position of FoodsRaw, Processed and Pre-pared.Continuous reporting.Food Labeling. Use of nutrition labeling, nutri-tion content;- impact of numerous regulatoryactions related tonutritionlabeling. DHHS-,Food and Drug Administration (FDA). Contin-uing surveys.Consumer Price Index (CPI). Price changesacross Nation for a fixed market basket of foodsand services. Department of Labor-Bureau ofLabor Statistics (BLS). Monthly CPI Reports....Continuing survey; National sample.Nutrition surveillance report. Selected indices ofnutritional status from ten selected States, healthdepartment clinics, WIC screening, and HeadStart Programs. CDCNutrition Surveillance Re-.ports.96FINS-Centerfor Disease Control (CDC).Continuous reporting frOm selected sources..National Menu Census. Tabulation of about 460food items sold away from home as to "good,"slow," or "never sell," including demographicdataInstitutions Magazine.Chicago, IllinoisReporting annually in April 1st issue ofInsytutions.Continuing survey, National sample ofeating establishnients.Nutritional Status Monitoring System (NSMS)Comprehensive National nutrition status moni-toring system to be developedand implementedjointly by DHHS and USDA. A coordinatedsystem drawing on health and other vital sta-tistics from DHHS, and food use and consump-tion data from USDA and DHHS. DHHS-Officeof the Assistant Secretary for Health (OASH),Nutrition Coordinating Office.b. To State acrd/or local levelNational Vital Registration SystemMortality. Deaths by cause (including fetaland infant mortality), by age, sex, and race.dKNCHSVital Statistics of theUnited Stat

80 es,Vol. II, and NCHSMonthlyVita! Statist
es,Vol. II, and NCHSMonthlyVita! Statistics Reports.Continuing report-ing-from States; National full count. (ManyStates issue earlier reports.)-- Natality. Births andbirth rates by place ofoccurrsoce and by the mother's place ofresidcpce, age, race and parities. DHHS-NCHS`.. NCHSVital and Health Statistics,Series 21, selected reports, and MonthlyVital StatisticsReport. Birth data obtainedfrom certificates of live births to U.S. resi-dentsfiled throughout the United States.Birth rates calculated on the basis of thenumber of women 14-49 years of age resid-ing in the_respective areas enumerated incensus years, and estimated for inter-censusyears.National MorbidityAndMortality ReportingSystem. Numbers of 46 reportable. diseases (in-cluding .foodborne' outbreaks)deaths in121.U.S. cities. DHHS-CDC. CDCMorbidity andMortality Weekly Report,and annual reports.Morbidity:continuousreportingfromStatehealth departments on basis of physjcian reports.(Completeness of reporting varies greatly, sincenot all cases receive medical care and not alltreated conditionsarereported.)Mortality:continuous reporting; -volunteer panel of healthdepartments in 121 U.S. cities, full count.Selectedhealthdata. DHHS-NCHS. NCHSStatistical Notes for Health Planners.Compila-tions and analysis of data to State level.Area ResourceFile(ARF). Demographic,health facility and manpower data at State andcountylevelfromvarioussources. DHHS-Health Resources Administration.Area Re-source File: A Manpower Planning and Re-search Tool,DHHS-HRA-80-4, Oct 79. Onetime compilation.a PHYSICAL FITNESS, AND EXERCISE1. Nature and Extent of the ProblemThe health benefits associated with regular physicalfitness and exercise have not yet been fully defined.Based on what is now known it appears that substan-tial physical and emotional benefits,.direct Ind indi-rect, are possible. Yet most Americans do not engagein appropriate physical activity, either during recrea-tion or in the course of their work. For the purposesof this discussion, t`appropriate physical activity" re-yfers to exercise which involves large-muscle groups indynamic movement for periods of 20 minutes or_longer, three or more days per week, and which isperformed at an intensity requiring 60 percent orgreater of an individual's cardiorespiratory capacity.Exercise to improve flexibility and muscular strengthmay reduce the frequency of musculoskeletal problemsand is an important supplement- to cardiovascularconditioning activities.a.Health implicationsMostle feel better when they exercise.Physic'inactivity can result in decreased physi-cal worg capacity at all ages, with concomit-ant decrin physiologic function and healthstatus._.-,Physical invityis associated with an in-creased riskdeveloping obesity and its diseasecorrelates.Physical inactivity is associated with increasedrisk of coronary h art disease.Appropriate physiiil activity may be a valuabletool intherapeutic regimens for control andamelioration (rehabilitation) of obesity, coro-,nary heart disease, hypertension,diabetes, mus-culoskeletaiproblems,respiratorydiseases,stress and depression/anxiety. Such physical ac-tivity, however, is still not routinely prescribedfor the treatment of these conditions.b.Status sad Oa*.,Though physical fitness and exercise activitieshave increased in recent yearsand over 50percent of adults reported regular exerciseinpopular opinion pollsgenerous estimates placetfitproportions of regularly exercising adultsages 18 to 65 at something over 35 percent.Regular runners include approximately 5 per-t of all Americans over age 20, and10 per-t ofmen aged 20 to 44.About 36 percent of adults ages 65 and olderwere estimated in 1975 to take regular walks.Only about a

81 third of children and adolescentsages 10
third of children and adolescentsages 10 to 17 are estimated t9 participate indaily school physical education programs, andthe share is declining..Many high school programs focus on competi-tive sports that involve a 'relatively small pro-portion of students.Though growing, the awareness of the healthbenefits of regular exercise is limited.Only a small proportion (about 2.5 percent) ofcompanies and institutions with greater than 500employeesofferfitness programsfortheirworkers.Certain groups demonstrate disproportionatelylow rates of participation in appropriate physicalactivity, including girls and women,ser peo-ple, physically and mentally handica.peopleof all ages, inner city and rural residents, peopleof low socioeconomic status "d residents ofinstitutions.,2. Prevention/Promotion Measuresa.Potential measure*Education and information measures include:using television and radio public serviceannouncements to provide information onappropriate physical activity and its benefits;providing information in school and college-based-programs;providing information in health care deliverysystems, including incorporation of queriesabout exercise habits into the routine clini-cal history;encouraginglealth care providers, especiallyin HMOs, community health centers andother organized settings, to prescribe appro-priate exercise in weight loss regimens as acomplementary treatment modality in themanagement of several chronic diseases,andto give patients 65 years and older, and thehandicapped more detailed information onappropriate physical activity together withwarnings about starting up exercise too fast;adopting an exercise comnt by com-munity service agencies (sas the Ameri-can Red Cross, the Ame can Heart Asso-ciation);78 assuying that all programs and materials re-lated to diet and weight loss have an activeexercise component;tailoring education programs to the needsand characteristics of specific populations.Service measures include:providing physical fitness and exercise pro-grams to school children, and ensuring thatthose programs emphltsize activities for allchildren rather than just competitive sportsfor relativel! few;providing physical fitness, and exercise pro-grams in colleges;pr viding worksite-based fitness programswhiare linked to other health enhance-ment cponents (e.g., smoking cessation,nutrition improvement) and which have anactive outreach effort;incorporating exercise and fitness protocolsas regular clinical tools of health providers.Technologic measures include:increasing the availabit oefioexisting facili-ties and promoting thepment of newfacilities by public, private and corporateentities (e.g., fitness trails, bike paths, parks,upgrading existingfacilities,especiallyininner city neighborhoods, and involving thepopulation to be served at all levels of plan-ning.Legislative and regulatory measures include:city council support for bicycle and walkingpaths for use in trips to work and school;developing and operating local, State andNational park facilities which can be usedfor physical fitness activities in urban areas;increasing the number' of school-mandatedphysical education programs that focus onhealth-retated physical fitness;,establishingState and localcouncils onhealth promotion and physical fitness;allowing expenditure of funds for fitness-relatedactivities under Federally fundedprograms guided by Federal regulations.Economic measures include:tax incentives for the private-sector to offerphysical fitness programs for employees;encouraging employers to permit employeesto exercise on company time and/or givingemployeei flexible time for use of facilities;offering- health and life insurance policieswith reduced premiums for those

82 who par-ticipate in regular vigorous phy
who par-ticipate in regular vigorous physical activity.b.Relative strength of the 'measuresPrograms which Are most likely to be successfulin recruiting new participants to appropriatephysical activity include those which offer serv-80ices and facilities to individuals, and economicincentives to groups and individuals.On the other hand, programs which can moreeasily be implemented include those related tothe provision of public information and educa-tion and improving the linkages with otherhealth promotion efforts.The effectiveness of all measures is handicappedby the limitation in knowledge with respect to:the relation between exercise and physicaland emotional health;the optimum types of exercises for variousgroups of people with special needs;the appropriate way to measure levels ofphysical fitness for various age groups.3..Specific Objectives for 1990Improved health statusIncreased levels of physical fitness may con-tribute to 'reduced heart and lung diseaserates, possibly reduced injuries among theelderly, and, more broadly, an enhancedsense' of well-being which may reinforcepositive health behaviors in other areas. Cur-rently,however, fewquantifiablehealthstatus objectives for physical fitness and ex-ercise can be developed.Reduced risk factorsAVa.By ,1990, the proon of children and\adolescents ages 10 t17 panic/plating reg-ularly in appropriate p ysical activities, par-ticularly cardiorespiratfitness programswhich can be carried inadulthood, shouldlie greater-than 90 perc nt. (Baseline dataunavailable.)\b.By 1990, the proportiork of children andadolescents ages 10 to 11 participating indaily school physical education programsshould be greater than 60. percent.(In1974-75, the share was 33 percent.)c.By 1990, the proportion of adulk 18 to 65_participating regularly in vigorous physicalexercise should be greater than 60 percent.(In 1978, the proportion' who regularly ex-'ercise was estimated at over 35 percent.)d.By 1990, 50 percent of adults 65 years andolder should be engaging inappropriatephysical activity, e.g., regular walking, swim-ming or other aerobic activity.(In 1975,about 36 percent took rear walks.)Increased public/professionawarenesse.By 1990, the proportion of adults who canaccurately identify the 'variety and durationof exercise thought to promote most effec-tivelycardiovascularfitnessshouldbegreater than 70 percent. (Baseline data un- .available.).By 1990, the proportion of primary carephysicians who include a careful exercisef. history as part of their initial examinationof new patients should be greater than 50percent. (Baseline data unavailable.)Improved services/protectiongBy 1990, the proportion of employees ofcompanies and institutions with more than500 employees offering employer-sponsoredfitness programs should be greater than 25percent.(In 1979, about 2.5 percent ofcompanies had formally organized fitnessprograms.)rImproved surveillance/evaluation systemsh.By .1990, 'a methodology for systematicallyassessing thephysical fitnessof childrenshould be established, with at least 70 per-cent of children and adolescents ages 10 to17 participating in such an assessment.i.By 1990, data should aft available withwhin to evaluate. the short and long-term.health effects of participation. in programs pfappropriate physical activity.By 1990, data should be available ,to evalu-ate the effects of participation in programsof physical fitness on job performance andhealth care costsk.' By 1990, data should be available for regu-Ninnonitoring of National trends and pat-terns of participation in physical activity,Including participation in public recreationprograms in,community facilities.1.4. Principal AssumptionsIncreased physical activi

83 ty by the Anierican publicwillin overall
ty by the Anierican publicwillin overall improvements in healthPersonal commitment to enhance health will becomea prominent factor promoting increased participa-tion in exercise activities in the United States.Voluntary agencies, private corporations and"gov-ernment will expand th,5ir commitment toplfysicalP/fitness programs..Private in1ustry and retailers will support activitiespromoting physical fitness, which will also promoteincreased sales of their products.Environmental, cultural and behavioral differencesinfluenceattitudes toward, and participation in, reg-ular exercise.Inner city residents wilt continue to have fewer ade-quate facilities and appropriate activity programs.SpeciaLatiention will be required to make gains inparticipation among lower socioeconomic groups.There will be a reversal of the trend in reductionsof school-baied programs aimed at promoting physi-cal fitness. However, these programs will not neces-j/Isarily be founded in the traditional physical educa-tion mold.'New school-based programs will embrace activitieswhich expand beyond competitive sports.The increasing costs associated with health care wilt,compel putilic pOlicy to emphasize measures such asphysical fitness to enhance health.Reduced levels of physical fitness in the work forcemay result in increased absenteeism from acute ill-ness and,rdingly, decreased productivity. Thus,employers haincentives for offering physical fit-ness prog_stheir employees.5. Data Sourtesa.To NatiOnsd level onlyHealth Interview Survey (HIS). Extent of regu-lar exercise; job related physical activity; regularparticipation in exercise DHHS-National Centerfor Health Statistics (NCHS).NCHS Vital andHealth Statistics,Series I,selected reports, andAdvance Data from Vitnd Health Statistics,No78-1250. rContinugsurvey;National..,probability sample.Extent of regular exercise.(ion-workrelatedonly.) Regular participation in exercise reportedin household survey, and self-reported changeover previous year. Survey for General Mills,conducted by Yankelovich, Skelly and White.Family Health in an Era of Stress.GeneralMills, Inc., 9200 Wayzata Boulevard, Minne-apolis, Minnesota, 1979. One time survey;,Na-tional probability sample..Extent of regular exercise. (Non-work relatedonly.) Survey for Pacific Mutual Life InsuranceCompany, conducted by Louis Harris and As-sociates, Inc.Health Main enance,1978. PacificBeach, Cali-fornia,.Mutual Life Insurance, NePublic attitudes regarding physal fitness. Atti-tudes, knowledge and behavior regarding physi-cal fitness and exercise. Survey for Great Watersof France, conducted by Louis Harris and Asso-ciates, IncThe Perrier Study; F!ness inAnter------ica,1979 One time survey; representative sam-ple and special sample of runners.b. To State and/or local level84 _178Exercise programs in schools. Student enroll-ment in physical fitness activities; program con-tent and scheduling. Councils on Physical Fit-ness, seleited States only. ,Student rysical fitness levels. Councils on Phys-ical Fitness, selected States only.1,s,A CONTROL OF STRESS ANDVIOLENT BEHAVIOR1. Nature and Extent of the ProblemSome stress may be beneficial. On the other hand,stressful conditions can result in substantial dysfunc-tion. Public perception of the role of stress as a con-tributor to major illness and diminished quality of lifefocused considerable attention upon the need to pro-vide practical and 'ethical means of favorably influ-encing this pervasive condition of 20th century life.'As used here, the term stress refers4p those pressuresand tensions (whether behaviorally, biologically, eco-nomically or environmentally induced) which; unlesssuitably managed, can lead to psychological or physio-logi

84 cal maladaptations manifested in phenome
cal maladaptations manifested in phenomena suchasfatigue, headache, obesity, 'absenteeism,illness,accident-proneness or violence.Because the socioeconomic impact °Contemporarypsychosocial stress and its biologicdevaitOion is prob-ably enormous, comprehensive public health programsaimed at stress management are of high priority. How-ever, It would beunwise to mount extensive programson the basis of beliefs rather thanevidence. The majorresponsibility and challenge for a stress managementstrategy is to find the means to identify individuals orgroups especially vulnerable tostress,to providehealth professionals and file public with whateveraccurate information exists on stress identification andmanagement and, when the answers are not known,to formulate the questions that will offer the bestchance for obtaining rational answers.Violent behaviorin its Many formsexacts ahuge toll on America's physical andmental health.Suicide and homicide lead tq thousands of prematuredeaths-annually. Assault, indluding rape and child andspouse abuse cause much injury and emotional suffer-ing. Numerous factors underlie these violent forms ofbehavior. Health prograls alone cannot deal withthese factors. Many majOmaspects of American social .structure are involvedthe family, the community, thesystem of stratification, theNducational sthe economic structure. Much remains unown re-garding means of reducing mortality associated withviolent behavior. Even in the absence of such informa-tion important steps can be taken.a Health implicidossEvidence linking psychosocial and behavioralfactors to major health disorders seems persua-sive enough to justify the conclusion that stressis importantly involved. However, there is a8379clear need to study and evaluate the interactionof psychological, environmental andlogicalfactors in laboratory, clinical, indHal andschool settings.There is much evidence that many causes ofstress (situational external demands, challeng-ing life event ) have clearly measurable physio-logic and p chological effects.Usually,ever,reactions or responses tostress are short-term; homeostasis is restoredthrough various coping mechanisms withoutperceptible damage.Much remains to be elucidated about the vari-ability of people's vulnerability to stress, includ-ing their developmental histories, their psycho-logical defenses and coping capabilities. Whilemost people face life's stresses with appropriateresistances, a minority do not. For these highlysusceptible groups and individuals, stress inter-vention programs would be desirable.Whether stress becomes a problem for any givenindividual depends on a combination of factors,unique to that person, that may bolster resist-ance and/or- resilience. Also, any individual'sperception of stress and reaction to it may varywithtime,circumstanceand environmentalfactors.Some groups in the population appear to beparticularly vulnerable to stress overload (ado-lescents, the elderlyi the unemployed, workersin certain occupations, people who experiencemajor disruptions in their lives such as desp of/*spouse or job change.).Stress may function as a precipitator of dysfunc-tion or illness, as a predisposing factor or as asustaining factor in chronic conditions, or as aprecipitator of violent behavior.Evidence on the disease effectsof stressisstrongest for depression, coronary heart disease,peptic ulcer, asthma and diabetes.Evidence is also available regarding the rela-tionship of stress to mental health problems,substance abuse, accidents, lower back pain,terminal renal failure, skin rashes, tuberculosis,multiple sclerosis, cancer and childhood strep-tococcal infections.Unmanaged stress plays a major role in suicidesand homicides wh

85 ich are leading causes of deathamong you
ich are leading causes of deathamong youth in the 15 to 24 age group. Stress is also related to family violence, includ-ing child abuse.A possible major mechanism for the relationshipof stressful life events on certain disease statesis through suppression of the normal immuneresponse of the organism. However, preciseknowledge of the mechanisms relating stress topsychological and physical dysfunctionis notclearly identified.b.Status sad treadsIn one recent National survey, 82 percent ofthose polledindicatedthat they "need lessstress in their lives."In 1978 there were 4,100 deaths from suicideamong people ages 15 to 24.'''.In recent years suicide his ranked as the ninthleading cause of death for all age groups. Itranks as the second leading cause of deathamong youths 15 to 24. Increasingly it is alsoan important cause of death among the aged.It is estimated that 200,000 to 4 million casesof child abuse occur each year and that 2,000children die each year in circumstances suggest-ing abuse or neglect.Hundreds of thousands of cases of violent (buttlude Instances of spouse abuse and rape.on-fatal) assault occur each year. These in-The death rate from homicide among black,males ages 15 to 24 Increased from 46.4 per100,000 population in 1960 to 72.5 in 1978.Minonty groups have a greater risk of deathfrom homicide than whites An estimated 60 to80 percent of homicides occur as the result ofpersonal' disagreements and conflicts. Firearmswere used in 63 percent of murders occurringin 197/. with handguns used in half.There are few(If any)definitive measuresidentified of the prevalence of harmful stress.There is increasing public awareness that stressmay be harmful.The public has limited accurate knowledge andinformation about what can be done to control(reduce) stress. This leads to simplisticr-ceptions and techniques which may be hafuland/or impede successful long -term man e-ment.2. Prevention/Promotion MeasuresPrograms Qf any nature directed at stress managementmust first relate to the individual perception, motiva-tion, evaluation and response to the stress. A sense ofwell -being and good stress management usually ac-company ,some combination, of the following life cir-cumstances: job satisfaction; people who provideaffection and mutual assistance; adequate income;sense of belonging to a social group; time for self;physical fitness; adequate sleep; and freedom fromdisease.84Certain approaches seem prudent for the manage-ment of stress:individually focused efforts (ercise, relaLationtechniques, /adequatesleep,neral "self-care",improved psychological copinmecnisms);social group focused efforts (aid, self-helpsupport groups);societallyorinstitutionallyeffortstochangeunsatisfactory environmentconditionssuch as overcrowded housing, pollution, stressfulworking' conditions; to modify social norms orvalues such ain relation to smoking and drinking;and to inform the public regarding the role ofstress.off-A major aim is to enhance dignity, and thus to pro-vide the will to strive for self-management and self-mastery.It appears that violent behavior, while occurring inall-strata of American society, exacts a far greater tollamong minority and other economically deprivedgroups in the United States. Thus many measureswhich would improve the economic and social positionof these groups might' well be accompanied by a reduc-tion of rates of homicide.a.Potential measuresEducation and information measures inclUde:increasing the public's awareness, throughplanned campaigns utilizing the appropriatemedia, that stress can be an antecedent ofillness and that stress management can be animportant component 6f health;creating new educational pathways for de-veloping ._enhancedpro

86 fessionalskillsinbio-behavioral fields o
fessionalskillsinbio-behavioral fields of medicine and publichealth;developing the capacities of health care pro-fessionals in stress diagnosis and manage-ment;helping parents recognize and deal withstress;training secondary, elementary and pre-.schoolteacherstoincludediscussion ofstress recognition and management in schoolhealth curricula;training of police in handling calls involvingdomestic and interpersonal disputes whichwould potentially lead to violent behavior;,public education, especially for high riskgroups, on steps to take to reduce risks ofrape;training all "helping" professionals regard-ing signs which indicate high risk for suicide;e-tielping the public be aware of, indicators ofpossible suicide.See Pregnancy and Infant Health.Service measures include:hbtlines for People under acute stress (sui-cide, child abuse prevention);' 'AVstressmanagen)ntmews in work places;stress management programs targeted to ado-lescents, parents and the elderly;stress appraisal arlalysts (self-administeredor performed by a legitimate objectiVr out-)side source);professional and social support systems toassist in resolution of stressful life events,including mutual aid and self-help groupssuch as Reach for Recovery, child abusingparents, bereavement groups, single,groups;-information and counseling with regard toindividually appropriate leisure and stress-reducing activities including exercise;a variety of self-help relaxation and bio-feedback techniques, which can be individ-ualized in concert with a diversity of life-styles and work requirements;psycho-physiologic tests to aid in assistingemployees who are having difficulty adjust-ing to their work and to their co-workers;support services for inevitable or necessarylife change eventsespecially in relation todeath,separation,job changes and geo-graphic relocation;domestic crisisteams to defuse domesticdisputes;targeting the above measures to high riskpopulations and individuals with low copingabilities;evaluating intervention efforts;follow-up services for persons who have at-tempted suicide;shelters for abused wives (and husbands);training all health (and other human serv-ices--including educattnal) personnel tobe alert to evidence ofild abuse.Technologic measures include:actions by employers, labor and governmentto reduce stress-creating work environments;reducing stress41 aspects of the environ-ment such as noise pollution and overcrowd-ing.Legislative and regulatory measures include:activities to create employment opportunitiesfor youth.;action to limit the availability of handguns,to reduce homicides and suicides.that occurduring stressful periods;strengthening mandatory child abuse report-ing laws.b.Relative strength of th measureThe relative strength of potential stress inter-vention efforts (measures) is not yet known.Stress reduction and management often requireFbehavioral changes, but most physicians andother health professionals are not traillip in as-3.85sisting their patients to modify their lifestyles orbehavior..Many stress prevention measures11 for exten-sive modNations in public attitu es anti com-plex cultural reappraisals atalllevels, publicand ptivate. These cannot be expected to takeplace quickly..At a minimum, vig rous efforts at early detec-tion and assistance'11 be necessary at commonsites where this is possiblei.e., schools andworksite.Little is known about the relaitive strength ofpotential efforts to reduce rates of violent be-havior. There is some evidence thatsuicideprevention and rape prevention efforts do havean impactat least with certain populations.Specific Objectives for 1990 or EarlierImproved health status-'a.By .1990, the death rate from homicide. amongblack males ag

87 es 15 to 24 should be reducedto below 60
es 15 to 24 should be reducedto below 60 per 100,000. (In 1978, the homi-cide rate for this group was 72.5 per 100,000.)b. By 1990, injuries and deaths to children in-flicted by abusing parents should be reduced by,,at least 25 percent. (Reliable baseline data un-availableT-estimates vary from 200,000 to 4million cases of child abuse 'occurring each yearin this country.)c.By 1990, the rate of suicide among people 15 to24 shdiffd be below 11 per 100,000. (In 1978,the suicide rate for this age group was 12.4 per100,000).Reduced risk factorsCertain risk factors for stress are well-identified.Some have been addressed in the sections onFamily Planning (unintended pregnancies), Oc-cupational Safety and Health, Misuse ofAico-hol and Drugs, and Physical Fitness and Exer-cise. Other risk factors-for stress such as thoseimbedded inLamily history and majorlifechanges, areeasily controlled or quantifiedand therefore, are not specified as measurableobjectives.d.By 1990, the number of handguns in privateownership should have declined by 25 percent.(In-1978, the tota4 number of handguns in pri-vate ownership was estimated to be 30 to40million.)Increased public/professional awarenesse.By 1990, the proportion of the population overthe age of 15 which can identify an appropriatecommunity agency to assistin coping with astressful situation should be greater than 50percent. (Baseline data unavailable.)f.By 1990, the proportion of young people ages15-to 24 who can identify an accessible suicideprevention "hotline" should be greater than 60percent. (Baseline data unavailable.)I g.By 1990, the proportion of the primary carephysicians whh take a careful history related topersonal stress and psychologie0 coping skillsshould be beater than 60 percent. (Baselinedata unavailable.)Improved services/protectionh.By 1990, to reduce the gap in mental healthservices, the number of persons reached by mu-tual supportself-help groups should doublefrom 1978 basele figures. (In 1978, estimatesranged from 2.5 o.5 million; depending on thedefinition of such groups.)By 1990, stress identificatton and control shouldbecome integral components of the continuum--11 health services offered by organized healthprograms. ( Baseline data unavailable.)By 1990, of the 500 largest U.S. firms, the pro-portionoffering work-based stressreductidnprograms should be greater than 30 percent.(Baseline data unavailable.)Improved surveillance/evaluation systemskBy 1985, surveys should show what percentageof the U S. population perceives stress as ad-versely affecting their health, and what propor-tion of these are trying to use apisropriate stresscontrol techniques.I.By 1985, a methodology should have been de-veloped to rate the major categories of occupa-tion in terms of their environmental stress loads.m. By 1990, the existing knowledge base throughscientific inquiry about stress effects and stressmanagement should be greatly enlarged.nBy 1990; the reliability of data on the incidenceand prevalence of child abuse and other formsof family violent/ should be greatly increased.4. Principal AssumptionsMuch of stress and stress-related illness is the resultof fundamental socioeconomic status over which thehealth system has limited control.Further research will establish the relationship ofstress to illness.Research willidentify and demonstrate effectivestress-control measures.The role of physical fitness and nutrition in success-fully managing stress will be better understood,186Various health care systems will be willing to assistpatients in making the changes in their lifestylesthat may be necessary to reduce stress and to im-prove copin&with stress..Health professionals, health organizations, inkustryand labo

88 r will devote increased attention to und
r will devote increased attention to under-standing the relation of stress to illness and to vio-lent behavior, as well as to better methods of stressreduction and management.-Medical and nursing schools will offer instructiontargeted at understanding the pathophysiology ofstress and its management; training df other healthprofessionals will also include stress education, aswill continuing education proirams for all healthprofessionals..Hotlines and community support groups will proveeffective in aiding individual efforts to cope withpersonal crises.Actions at the individual and commuifity levels willfoster measures to reduce the availability of hand-guns.Actions will be ton at the Federal, State, and locallevels to increase the employment opportunities foryouth.5. Data Sourcesa. To National level onlyNational Vital Registration SystemMortality.Deaths by cuse (including. homicides and sui-cides), by -a', race, and sex. DHHS-NCHS.NCHS Vital Statiitics of the United States, Vol-ume II, and NCHS Monthly VitalStatistics'Re-`ports Continuing reporting from States; full Na-tional count (Many States issue earlier reports).,Public attitudes regarding stress. Perceptions ofhow problems of everyday life relate to healthand mental health. Survey for General Mills,conducted by Yankelovich, Skelly and White,Inc. Family Health in an Era of Stress. GeneralMills, Inc., 9200 Wayzata Boulevard, Minne-apolis, Minnesota. One time survey; Nationalprobability sample.b. To State and/or local levelNo data sources unless questions- on State orlocal household interview surveys.. a,2a.4!6.t.)ACKNOWLEDGEMENTSPreparation of this 'document was a joint effort of the Center for Disease Control and the Health, Resources Administrtion, coordinated by the Office of Disease PreSitntion and Health Promotion. Contributions wereade by a widetyof agencies, and individaals,listed below. Special acknowledgement should be given to the staff,ork of Kitharine:G.Bauerancl Martha Katz'of the Office of Disease Prevention and Health Promotion; Julia M. Fur, James VG. Strattonand Dennis Tolsm'a of the Center for Dis6 ase Control; Laureiscarsonnnon, Peggy McMan, andCheryl Polanskyof the Health Resonices AdministratiOn.; and Ronald° W. Wilson ot theational Center for Heh Statistics.4-PARTICIPATING AGENCIESPublic Health Service (HHS)Alclbhol, Drug Abuse, and Mental Health AdministrationGerald L. Kleiman, M.D., Administrathr,Center for Disease Control..:liVilliam H. Feege, M.D., DirectorFood and Drug Administration-fere Goyan, Ph.D., ComMissioner/Health Resources Administration-Henry A. Foley, M.D., AdministratorHealth ServicesAdthinistrsenGeorge I.-ythcott, M.D., AdministratorNational Institutes of 4-lealthDonald S. Fredrickson, M.D., Director %Office of AdolescentPregnancy.11111rensLotla Mae Nix, Ed.D.,'DirastorOffice of Dental AffairsJohn C. Greene, D.M.D., Chief Dental OfficerOffice of Disease Preiention and HePromotionJ. Michael McGinnis, M.D., Deputy Assistant Secretaryfor HealthOffice of Environmental Affairs.James F. Dickson, III, M.D., Senior AdvisdrOffice of Health Maintenance OrganizationsHoward` Viet, DirectorOffice of Health Planning and EvaluationSusanne Stoiber, Deputy Assistant Secretary for HealthOffice of Health Resettick, Statistics, and TecogYRuth S. Hanfl, Deputy Kssistant Secretary far-ithrational Center for Health Services Research.,&raid Replitthal, Ph.D., Director ANational denier for Hekth StatisticsDorothy P. Rice; Iiirectork4,Office of Intergovernmental AffairsAlonzo S. Yerby, M.D., DeputyAs istairt Secretary forHealth##Office of International H IthJohn H. Bryant,DeputyHealthOffice of PopuErnest PetersoHealthAssistant Secretary fortion AffairsActing Deputy Assistant Secre

89 tary forOfficaPublic Affairs,Mort Lebow,
tary forOfficaPublic Affairs,Mort Lebow, DirectorOffice on Smoking and HealthJohn M. Pinney, DirectorHealth Care Planning Administration ((CIS)Howard Newman, AdministratbrOffice ortiaailagiDevelopoent Services (HHS)CesaA. ferales,AssistantSecretaryforDeverwent ServicesSocial Securidmipistration (HHS)William J. D 'ver, Commissioner .Department ofgricultureCarol Tucker Foreman, Assistant Secretaryand Consumer ServicesConsumer Product Safe CommissionSusan B. King, ChairmanrDepartment of DefenseJohn H. Moxley, HI, M.D., .Assistant Secretary forsHealth Affairsk;Department of Educationa If.Florett'a D. McKenzie, -Acting Deputy Assistant Secre»tary, Office of School ImprovemeiztEnvironmental Protektion Agency11..Douglas M. Comic; Amittistrator87Humanfor Food Federal Trade CommissionMichael Pertschuk; ChaiDepartment of Housing andrban DevelopmentFather Geno Baroni, Assistant Se'cretary for Neighbor-hoods, Voluntary Associations and Consumer Protec--PionD4pditment of the InteriorMargaret G.. Maguire, Deputy Director, Heritage, Con-servation, and Recreation Service41*Department of LaborEula Bingham, Ph.D., Assistant Secretary for Occupa-tional Safety and HealthDepartment of TransportationJoan Claybrook" Administrator,National HighwayTraffic Safety AdministrationDepartment of the TreasuryORichard J. Davis, Assistant Secretary for Enforcement..and Operationsr-The following jndividuals particjpated in various stages of ate development of the d%ument. Chairpersons and Recordersof the 15 Work Groups of the 1979 Atlanta Conference are noted with an asterisk.Herbert K. Abrams, M.D., M.P.H.Health Sciences CenterThe University of ArizonaMichael Adams, M.D.Office of Program Planning and EvaluationCenter for Disease ControlChung-Hae AhnOffice of International Health*Offir,e Of the Assistant Secretary for HealthE. H. Ahrens, Jr., MThe-Rockefeller UniMrsityDavid T. Allen, M.D.Department of Public HealthState of TennesseeArchie E. Allen4 Domestic Operations OfficeACTION*Myron AlliiiianDn S., M.P.W.Bureau of Community Dental Programs'City of-Boston.Ronald Altman, M.D.New Jersey Departm'ent of HealthGeorge R. Anderson, M.D.?Buieau of State Health Planning andResource DevelopmentTexas Departrfent of HealthLinda Andreasen.DivisiQu of HealthANevadaDepartment of Human Resources'Nicholas A. 4shforct,J.D.canter for Policy Alternatives'Massachifsetts Institute of TechnologyDearvA. Austin, Ph.D.Lincoln Public Schoels\Lincoln, NebraskaKaren J. Axnick, R.N.''.Department of Inflection ControlStanford University Hospital.0Matilda A. BabbitzSchool of Public HealthUniversity of South CarolinaJohn BagroskyOffice of Smoking and HealthU.S. Public Health ServiceLillian BajdaDepartment of HealthState of New JerseyNed E: Baker, M.P.H.Health Planning Association of Northwest OhioSusan Sorem BakerOffice of Health*Planning and EvaluationU.S. Public Health ServiceWendy Baldwin, Ph.D.National Institute of Chila Health andHuman DevelopmentNational Institutes of HealthLinda BalogSchool of Public HealthUniversity of South CarolinaAlbert Balows, Ph.D.-Bureau of.LaboratoriesCenter for Disease ControlDiLe BarhyteAmerican Public Health AssociationKathryn E. Barnard, R.Alf Ph.D.University of Washington40t.Seattle, WashingtonCarolyn BarnesBureau ofTrainingCenter for Djsease Control*Helen B: Barnes, M.D.Department of Obstetrics and Gynecology'PrUniversity of Mississippi Medical Center"Patricia Z. Barry, Dr.P.1-I..Department of Health Admini ipponFniversity of North Carolina8860. James R. Beall,Ph .D.U.S. Department of LaborLynn Beasley.Pahnetto-LowcountrytHealth Systems Agency, Inc,.Summerville, South C/rolinaDan E. Beauchamp, Ph.D.School of Public HealthUniversity of North CarOlinaRuth A. BehrensCenter fo

90 r Health PromotionAmerican Hospital Asso
r Health PromotionAmerican Hospital AssociationSelina Bendix, Ph.D.Department of City PlanningCity and County of San FranciscoIra BernsteinCollege of MedicineUniversity of VermontDonald A' BerrethOffice of enformationCenter for Disease ControlFay R. Biles, Ph D.Deparimint-Of Health and Safety Education-Kest State UniversityHenry Blackburn, M.D.Universityof Public HealthUniversity of MinnesotaI.Chris Bladen.Office of the Assistant Secretary for Plarthing and-EvluationDepartment of Health and Human Services*Howard T. Blane,.Ph.D.University of PittsburghRonald G. Blankenbaker, M.D.Indiana State Board of Health ,Nkkplaskovich, Jr., PNaa &nal Institute forCenter for Diipase Co.D.tional Safety and HealthN,AWilliiitlL. Blockstein, Ph.D.niniversy of Wisconsin.1,AFrank P. BoldenND.C. Public SchoolsWashington, D.C.*Richard J. Bonnie, L.L.B.School of LawUniversity of VirginiaJoyce Borgmeyer, A.D..Iowa State Department of HealthGilbertiPBotvin, Ph.D.American Health FoundationSusan BoucherDivision of Cancer PreventionBaltimore City Health DepartmentFrank Bowyer, D.D.S.American Dental AssoCiatick .Philip S. Bradman, MilBureau of EpidemiologyCenter for Disease ControtRobert C. Bradbury, Ph,D.Central Massachusetts Health Systems AgencyShrewsbury, MassachusettsWindell R. Bradford°Bureau of State ServicesCenter for Disease Control..IfAllen G. Brailey, Jr., M.D..Personnel DepartmentBurlington Northern*ElainE Bselt,,=National Cancer InstituteNational Institutes of HealthoftsTameroDivisioNeva a DepartBrink, R.D., M.P.H.th.ent of Human ResourcesSeiko Baba BrodAmerican PublWashington, DJosaph H. Blount --NBureau of State cervicesCenter for Disease Co,ntrol, ,*William B. Bock, D:D.S.Ituiteau of State ServicesCenter for Disease ControlF. James BoeM.P.H.-Department Ofuman Resourcestate of North Carolina116° 'caBogner, Ph.D..th Services Aciministratioa,-----".)Health Associationrooks.Office of Toxic SubstancesEnvironmenteProtectipn ,AgencyWayne G. BrownBureau of TrainingCenter for Disease ControlAudrey K. Brown, M.D...Downstate Medical Center'Brooklyn, New York.,aSara Brown, Ph.D.Select Panel on the Promotion of Child Health..110894eHelen B. Brown, Ph.D.Cleveland ClinicCleveland, Ohio Csrichd Bryanalth Service ,HeSeices AdministrationDawn BAmerican HeDallas, TexasAssociation4Elsworth R. Buskirk, Ph.D.Loaboratory for Human Performance ResearchPennsylvania State University,Earl B. Byrne;M.b.Biyn Mawr, PennsylvaniaHarry P. Cain, II, Ph.D.American Health..Planning AssociationAntonio CalarcoButte County Defirtment of HealthChico, CaliforniaDavid Calkins, M.D.Office of the-Seeretary-Department-of Health and Human ServicesC.-Wayne Callaway,Nutrition Coordinating Committee-U.S. Public Health Serviceoseph CaineronNational Highway Traffic Safety CommissionU.S. DePartment of TransportationMiriam M, Campbell; M.P.H.Health Education ConsultantOrono,. Milne---";-Richard Carleton M.D.The_}.4eMorial/ 'Pawtucket,Rhode Island-r.Paula L. Casey,Food and-Nutrition ServiceU.SSbe artment of AgriculturtCharlotte CSitz, M D.National Institute of Child Health and humanDevelopment.National Institutes of Health.Dewey Cederbladei,-American Social Health Associationamen W. Clark, Jr..eriCan Optometric Associationhington, DC._iLinda Clemmings.American Public HealthssociationCarl F. Coffelt, M.D.County Health DeentLos Angeleis CaliforniaDennis L. Colaciuo, Phb.PepsiCo,. IncorporatedValerie ColemanHeritage Conservation and Recreation ServiceU.S. Department of the InferiorDurward R. Collier, D.D.S., M.P.H.Department of Public HealthState of Tennessee .,Gera ColloskyBlue Cross and Blue ShieldOucagorIllinois-.Bonnie A. Connors\./American College of Obstetricians and GynecologistSC:Carson ConradThe President'

91 s Council on PhysiCal Fiiness and Spoils
s Council on PhysiCal Fiiness and Spoils.James*P. Cooney, Jr., PhD.-Office of the Center Direct9rNational Center for Health StatisticsJohn A.11. ,Cooper, M.D.AssociationflfAmerican Medical. CollegesDon B.Industrialeration EngineeringUniversity of MichiganDaniel ChatfieldOhio Department of Healthlames Chin, M.D.California_ Department of Health ServicesWilliam B. Cissell, Ph.D.hoot of Public and Allied Healtht Tennessee State Urliversity-Ray A. Ciszek, Ed.D.ccan eforHealchthyAVereitioh.--catio-qaiti M; COppage, R.N., 'M.P.H.Bureau-Of TrainingwCenter *Disease Control,Robert 1) Corwin, M.D.American Heart Associatibn,.Audrey CfossOffice of the Secretaryt.U.S. Departtnent of AgricultureillvJeffrey F. CrossNational EnvirOnmeatalkie,alth Association andFerris State CollegeJames W.Curran, M.D.Bureau of State Services.Center for Disease ControlRussell W. Curi, D.V.M.4Division of DisePreventionlowa,Departmenif HealthIrvin M. Cushner, M.D.U.S. Public Health Service'I'DavidDammannAcA.7141..andSuzanne Dandoy, M.D., M.P.H.Arizona)epartment of Health Services84 1/441.'Helen DarlingInstitute of MedicineNational Academy of Sciences',Robert M. Daughem-,,Jr., M.D.,"SubeoMmittee on SmokingAmericarkHeart AssociationAnn Davis, R.N., B.S.N.Overlook Hospital:Surnillit,f4ew JerseyRunyan Deere, WA:P.Cooperative Extension ServiceUniversity of ArkansasJohn B. Delfoff, M.D., M.P.H..Health DepartMentCity of Baltimore.Sarah L. DiamondBureau of Health Educationr for Disease ControlDickeyFood and Nutrition ServiceU.S. Department of Agriculture,Ernest M. Dixon, M.D.`Celanese Corporation*Rona D. DobbinNational Institute fgr Occupational Safety and HealthCenter" or Disease Control.Jane Dolkart:J.D._Division of Advertising PracticesFederal Trade Commission-Chair L. Donahue, Jr.Center for Heala PlanningBoston UniversnSusan E. DonaldBureairof TrainingCenter for Disease ControlDeborah Drudge, Esq.Healthy AmericaWashington, Distria ofolumbiaJames M: Dunning, D.D.S., M.1).1-1:Massachusetts Citizens' Committee for Dental HealthRobert L. DuPont, M.D.Institute for Behavior and Health4nc.Bethesda, Maryland-.Merlin K. DuvaL_M,,..D.Nationalrenter fordietelth EducationSan Francisco, CaliforniaLucy Eddingeroffite of Adolescent Pregnansw ProgramsU.S. Public Health ServiceRobert Edelman, M.D.National Institute of Allergy and Infectious DiseasesNational Institutes of Health.s' Mary Egan, R.D., M.S., M.P.H.ProgramIffor Maternal and Child HealthHealth SeAdministration9187Robert S. Eliot, M.D.Cardiovascular CenterTheniversity of Nebraska Medical CenterE eEllis, M.D..we'AmermanMedical Association and National FounadtionMarch of DimesMary EnigDepartment of ChemistryUniversity of MarylandJames H. Erickson, M.D., M.P.H.Bureau of Medical ServicesN.Health Services administrationCaswell. Evans, D.D.S.,Seattle -King County Department of Public HealthBeth EwyDivision of Cancer PreventionBaltimore, BarylandIvan J. Fahs, Ph.D.Rural SociologistRochester, MinnesotaRobert C. Faine, D.D.S.'Bureau of State ServicesCenter for Disease ControlHenry A. Falk, M.D.Bureau of EpidemiologyCenter for Disease ContiolGerVd FeckBurn Injury Control ProgramNew York State Department of HealthCharles,E.School of Public HealthUniversity of South CarolinaYehudi M. Feldman,' M:D.Bureau of Venereal.Disease ControlCity of4lew York-Department 'of HealthBarry FelriceNational Highway Traffic Safety AdministrationU.S. Department of TransportaJOe Fenwick, D.D.S.Health Planning 4psociationBernice Ferguson, R.N:, M.P.H.Department of HealthState of New JerseyHarry L. Ferguson, M.D., Ph.D.Science and Education AdministrationExtension9U.S. Department of AgricultureConrad P. Ferrara'Bureau of TrainingCenter for Disease ControlClaudia E. Finney, M-.T.

92 , (ASCP)' 1Saint Elizabeth't HospitalWas
, (ASCP)' 1Saint Elizabeth't HospitalWashington, District of Columbiarthwest Ohio. 4.John,R. FlemingSchool of Allied HealthFerris State CollegeGordon FlintBureau of Health EducatiOndenier for Disease ControlDee FlynnBureau of Alcohol, Tobacco, and FirearmsU.S. Department of the TreasuryPeter FraleighHealth Planning Association of Northwest OhioHerman M. Frank-el, M.D.Health Servicfs Research CenterKaiser Foundation Hospitals--Todd M. FrazierNational Institute for Occupational Safety and HealthCenter for Disease ControlJack FrielBu,reau of EpidemiologyCenter for ECsease ControlWendy Frosh, M.S.Union HospitalLynn, MassarhtisettsLois W. Gage, Ph.D.Medical SchoolThe University of Michigan'oeorge oalasso,-Ph.D.National Institute of Arthritis and Metabolic DiseasesNational Institutes of HealthJudy Gartin, R.D.Georgia State UniversityAtlanta, Georg4Kristine M. GebbieHealth DivisionState of OregonStephen D. Gelineau, APRUnion Hospital-Lyim,4Nassac1 usettsIElizabeth C. GibW-- --I--University of WashingtonSeattle, WashingtonDottie Gillon,Division of Health''Nevada Department of Hurnan,ResourcesCharles Gish, D.D.S.Indiaha State Board of Health'-Virginia M. Gladney, R.D., M.P.H.Department of Health ServicesCounty of Los AngelesDavid Glasser, M.D., M.P.H.\BurginafDisease Control.Baltimore Maryland.1.aEdwin M. Gold, M.D.Women and Infants HospitalProvidence, Rhode IslandWillis B. GoldbeckWashington Business Group on HealthWashington, D.C.Frank Goldsmith, M.P.H..New.York State School of Industrial and Labor RelationsCornell UniversityJan Richard Goldsmith, D.M.D.U.S. Public Health ServiceRegion IIAurel Goodwin, Ph.D.Mine Safety and Health AdministrationU.S. Department of LaborJanice GordonFood and Beverages Trades-DepartmentAFL-CIOMillicent GorhamOffice of the Honorable Louis StokesU.S. House of RepresentativesDeane F. Gottfried, NC.D.Northern California Cancer ProgramPalo Alto, CaliforniaStanley N. Craven, M.D.Department of Pediatrics and 04-GYNUniversity of South DakotaGareth M. Green, M.D.Department of Environz4ntal Health SciencesJohns Hopkins UniversityLawrence W. Green, Dr.P.H.Office of Health Informaticia, Health Promotion andPhysical Fitness and Sports MedicineU.S. Public Health ServiceKenneth Greenspan, _M.D.\College of Physicians and SurgeonsColumbia UniversityJoel It Greenspan, M.D.Bureau of EpidemiologyCenter for Disease ControlRoy GTexas ArHealth Systemi Agency, Inc.Irving, TexasBilly G. GriggsBureau- of Health EducationCenter for Disease ControlStephen Grossman, J.D.VA. Scholars ProgramWashington, District Of ColumbiaSusan R. GuamieriBaltimore City Healai"DepartmentDale Hahn`Blue Cross and Blue ShieldChicago, Illinois92\-"'8 Thomas J. Halpin, M D., M.P.H.Bureau of Preventive MedicineObi Department of HealthLee.1.M.D.VA Medical CenterDecatur, GeorgiaJean H. Hankin, Dr.P.H.School of Public HealthUniversity`hf Hawaii at ManoaDea Hanson, R.D.Georgia State UniversityAthknta, GeorgiaRobert L. Harrington, M.D.Permanente Medical GroupSan Jose, CaliforniaJeffrey E, Harris, M D., Ph.D.Departmentof EconomicsMassachutts Institute of TechnologyMichael J. HartfordSchool of NursingGeergetOwn University--L. Howard Hartley, M.D.Committee on ExerciseAmerican Hein Association'William L. Haskell, Ph.D.SchdDI of MedicineSt'lanUniversityDale Hattis. Ph.DMassachusetts Institute of TechnologyPatricia Hausman, M.S.Center for Science in the Public'InterestWashington, D.C.Stephen W. Havas, M.D.National Heart, Lung, and BlsieloinstituteNational Instituteaf HealthVictor M. Hawthorne, M.D.School of Public HealthUniversity of MichiganMaxine Hayes, M.D.o,Hinds-Rankin Orban Health Innovation ProjectBrandon, MassachusettsClark.Heath, Jr., M.D.Burea of EpidemiologyCenfor Disease Con

93 trolHegstedScience and Education Adminis
trolHegstedScience and Education AdministrationC1'U.S. Department of AgricultureHermlin A. Hein,iM.D.Iowa Perinatal ProgramThe University of Iowa HVia& Herbert, M.D., J.SUNY'Dowgstate Medical,Medical CenterA89M. Ward Hinds, M.D., M.P.H.Cancer Center of HawaiiUniversity of Hawaii at ManoaAlan_12. Hinman, M.D.Bureau of State ServicesCenter for Disease ControlRobert S.1-lockwa14, M.D.American Occupational Medical AssociationChicago, IllinoisHap HoddOffice of the Assistant Secretary.for Management"" andBudgetDeparthient of Health and Human ServicesBarbara HollowayBureau of Epidemiology.Center for Disease ControlDebbie Holman, R.N.Outpatient ClinicCenter for Disease ControlPriscilla B HolmanBureau of Health EducationCenter for Disease ControlKing ,K Holmes, M.D., Ph.D.U.S. Public Health Service HospitalSeattle and University of WashingtonFrankHootEnvironmental HealthBiltimoreNarylandJoann Horai, Ph.D.American Psychological AssociationThomas J. HorneBureau of State ServicesCenter for Disease ControlArthur E. Hoyte, M.D.Department of Health AffairsWashington, D.C.Susati HubbardGeorgia State UniversityAtlanta, GeorgiaSara M. Hunt, Ph.D.Georgia State UniversityAtlanta, Georgia*Robert HutchingsOffice on Smoking and Health. U.S. PublicHealth ServiceJames N. Hyde, M.P.H.Division of Preventive Medicine'Massachusetts Department of Public HealthRobert Isman,KeltDental Health ServicesItIlionah County, Oregon1.,93 1110Jack JacksonBureau of State Services.Center forDiseage ControlGeorge J. Jackson, PhD..DiSision of NutritionFood and Drug AdministratiOnAndrew B. James, M.S., Dr. P.H.Department of Public HealthCity of HoustonRonnie S. Jenkins4Georgia Department of Human ResourcesRobert E. Johnson, M.D..Bureau of State ServicesCenter for Disease ControlLloyd D. Johnston, Ph.D..Institute for Social ResearchThe University of MichiganSteven Jonas, M.D...School of MedicineState University of New York at Stoney BrookStep_hen B. Jones (Retired )..Missouri Department of Social ServicesState of Missouri......Barbara L. Kahn,'Departn'ient of Human ResourcesState of North CarolinaJohn T. Kalberer, Jr., Ph.D.Office of the DirectorNational Institutes of HealthNorman M. Kaplan, M.D.The University of Texas Health ScienceCenter at DallasSnehendu B. Kar, Dr. P.H.Center for Health SciencesUniversity of California, Los AngelesStanislavtKasl,Ph.D.School of MedicineYale UniversityJudith Katz'National Foundation March of DimesAbraham J. Kauver, M.D.Denver Department of Health and Hospitals._,Mark KeeneyDepartment of ChemistryUniveriity of MarylandJames A. KeithSchool of Public HealthUniversity of South CarolinaBruce C. Kelley, Ph.D.iDepartmentof Health'PrOvidenr.e, Rhode IslandN,/0t.... Douglas Kellogg, Ph.D.%Bureau of Laboratories'Center for Disease ControlLorin E. Kerr, M.D.Department of Occupational Health.United Mine Workers of America.Samuel Kessel, M.D.U.S. Public Health ServiceAnne Kielifaber, B.S:N.Washington Business Group on Health'Washington, D.C.Major John E. KilleenOffice of the Assistant Secretary of Defense(Health Affairs).Department of DefenseJames R. Kimmey, M.D.Midwest Center for Health PlanningMadison, WisconsinStephen H. King, M.D.Division of Health SciencesPFIS Regional Office (Atlanta)George M. KingmanNational Institute of Environmental Health SciencesNational Institutes of HealthRobert J. KingonBureau of State Servicesr for Disease ContiolJanie Ann Kinney, J.D.um and Nashgton, D.C.Ardine Kirchhofer-Georgia State UniversityAtlanta, GeorgiaJohn Kirscht, Ph.D.School of Public HealthUniversity of MichiganLawrence A. Klapow, Ph.D.State Water Resources Control BoardStatepf CaliforniaStuart A. Kleit, M.D.National Kidney FoundationJohn J., DumbDepartment of EducationState

94 of California.Ruth N. Kn011mueller, R.N.
of California.Ruth N. Kn011mueller, R.N., M.P.H.School of NursingYale UniversitySam Knoxt.American Social Health AssociationDieter Kdch-Weser, M.D.Department of Preventive and Social MedicineHarvard Medical School.(.t94....:.. Ross L. KoeserU.S. Consumer Product Safety CommissionRoz KohnBaltimore City Health DepartmentLloyd J. Kolbe, Ph.D.National Center for Health EducationGretchen Kolsrud, Ph.D.Office of Technology AssesMentU.S. Congressohn M. KornBureau of Health EducationCenter for Disease ControlPaul Kotin, M.D.Johns-Manville CorporationMary Grace Kovar-National Center for Health StatisticsU.S. Public Health ServiceDavid P. Kraft, M.D.University Mental Health ServiceUniversity of MassachusettsDorine G. Kramer, M.D:Bureau of Health EducationCenter for Diseate ControlHelen Krause, M.P.H.District V Health DepartmentTwin Falls, IdahoKatbtleen ICreiss-, M.D.Bureau of EpidemiologyCenter for Disease ControlLawrence J. Kline, Ph.D.. R.S.National Environmental Health AssociationW. Stanley KrugerU.S. Office of EducationSaul Krugman, M.D.Department of PediatricsNevi York University, Medical CenterF. A. kummerowCollege of AgricultureUniversity of Illinois at Urbana-ChampaignKatherine LacyOffice of Disease Prevention and Health-ProtionRobert E. Lamb, D.D.S.Council on Dental Health and Health PlanningArberican Dental AssociationLouis C. LaMotte, Sc.D.Bureau of Laboratoriescenter for Disease ControlJ. Michael Lane, M.D.Bureau of, Smallpox Eradication'Center for Disease ControlHerbert 0. Langford, M.D.7iibe University of Mississippi Medical Center4Laurent P. LaRoche, M.D.Western Electric CompanyJudith H. LaRosa:R.N., M.N.Ec1.4National Heait, Lung, and Blood InstituteNational Institutes of HealthDolores LemonJoint Commission on Accreditation of HospitalsJohn D. Lenton, M.D.VA Medical Center,DecaturtGeorgiaCarl Leukefeld, Ph.D.Division of Resource DevelopmentNational Institute on Drug AbuseCora S. LeukhartBureau of State Servic6Center for Disease ControlGilbert A. LeveilleDepartment of Food Science and Human NutritionMichigan State University'Richard A. Levinson, M.D.Veterans AdministrationRichard Light, M.D..Indian Health ServiceHealth Services AdministrationMarc B. Lipton, Ph.D., M.P.A.Mental Health and AddictionsCity4of Baltimore Health Depirtment,*Frank S. Lisella, Ph.D.Bureau of State ServicesCenter for Disease Controlt.J. William Lloyd, kJ".Occupational Safety and Health AdministrationU.S. Department of LabotKeith R. Long, Ph.D.Co lege of Medicineniversity of IbwaKatherine!"LordOffice of InformationCenter for Disease ControlCliff E. LundbergNational Headquarters for American Red CrossKaren M. LynchSouth Carolina`DepartmentOf Health and EnvironmentalControlJohn C. MacQueen, M.D.Department of Pediatrics.University cf IowaGeorge F. Mallison, M.P.H.Bureau of EpidemiologyCenter for Disease Control95 Arnold M. MalmonMilwaukee Blood Pressure ProgramMilwaukee, WisconsinRobert B. ManckeBureau of Health Education and Information.City of Baltimore Health DepartmentEdgar K. Marcuse, M.D.4,Childred,Orthopedic Hospital and Medical Center/Seattlethuise MarkleyAmerican Public Health AssociationRussell (Bild) MasonIndian Health SericeHealth ServiceslAdministration--James 0. Mason,M.D., Dr. P.H.Utah State Department of HealthKathleet1 A. McBurney, R.D.,.M.P.H.Department of Human Resources,State of NevadaJermyn F. McCahan, M.D.Department of Environmental, Public and OccupationalHealthAmerican Medical Association'David B. McCallum, Ph.D.South Carolina Department of Health and EnvironmentalControlJohn J. McCarthy, Jr.. M DNational Family Planning Federation of America. /Roger McClainIollana State Board of HealthWilliam M McCormack; M.D.Massachusetts State Laboratory Institu

95 t;William J. McCurryDivision of Ppeventi
t;William J. McCurryDivision of Ppeventive Health ServicesPublic Health Service Region IXPhilip R.B. McMaster, M.D.Bureau of LaboratoriesCenter for Disease ControlSimon A. McNeeleyBureau of Elementary and Secondary EducationU.S. Office of Education.DonaldMcNellii,Bureau Of Community Health tiServicesHealth Services AdministrationKrijen W. McNutt, Ph.D.National Nutrition Consortium, Inc.Ro... Mecklenburg, D.D.S.In?Health ServiceHealth*Services Admin' istratirrAntonio S. Medina, M.D., M.P.H.Schbol of Public HealthUniversity of California, Berkeley_Marie C. Meglen, M.S., C.N.M.Department of Health and Environmental ControlState of Solith CarolinaHarold R. MetcalfDrug Enforcement AdministrationDepartment of JusticeAnna Cay MilfeitHealth Systems AgencyPittsburgh, PennsylvaniaNancy Milio, Ph.D.Schooloof NursingThe University of North Carolina at Chapel HillJoan M. MillerProgram Development DepartmentBlue Cross & Blue Shield Associations96*C. Arden Miller, M.D.School of Public HealthUniversity of North CarolinaAnita MillsOffice of Dental AffairsU.S Public Health ServiceLloyd Millstein, Ph D.Food and Drug AdministrationJane MitchamSchool of Public HealthUniversity of South Carolina,J. Henry MontesOffice of Disease Prevention and Health PromotionDebby MooreRegion IVACTION*Lenora Moragne, Ph.D.Nutrition Coordinating OfficeDepartment of Health and Human ServicesDouglas H. Morgan, M.P.A..Department of Health and WelfareCity of NewarkGary E. MorigeauIndian Health ServiceHealth Services AdministrationNaomi M. Morris, M.D.University of Health SciencesThe Chicago Medical School"%ItRobert F. MurphySierra Chlb (New England)Clayton R. Myers, PIS D.National Board of YMCAsNew York, New York Kitty Naing, M.D.Bureau.of Community Health ServicesHealth Services AdministrationRose Navarro.American Public Health AssociationWashingtonD.C.Larry Needham, Ph.D.Bureau of LaboratoriesCenter for Disease ControlJane W. Neese, Ph.D....Bureau of LaboratoriesCenter for Disease ControlMark Nelson, M.D.-Bureau of EpidemiologyCenter for Disease ControlElaine NemotO.American Public Health AssociationWashington, D.C.Robert 0. Nesheim, Ph D.The Quaker Oats CompahyStephen H. Newman, Ed.D.Charlotte Drug Education Center.,,Charlotte, North CarolinaErvin E. Nichols, M.D , FACOGThe American College of Obstetricians 'and GynecologistsWashington, D.C.Patricia K. Nicol, M.D.Department for Human ResourCesCommonwealthof KentuckyElena 0. Nightingale, M.D., Ph.D.Institute of Medicine-.) National Academy ofSciencesJoel L. Nitzkin, M.D.Monroe County Department of HealthRochester, New YorkArthur NorrisNational Center for Toxicological ResearchFood and Drug Administration4CynthiaNorthrep,%M.S.,J.D.Community HealthingUniversity of MarylandHelen H. Nowlis, Ph.D.Offif.e of School HealthU.S. Office of EducationPatricia O'Gorman,National Institute on Alcohol Abuse and AlcoholismAlcohol, Drug Abuse, and Mental HealthAdministration.Godfrey Oakley, M.D.Bureau of EpidemiologyCenter for Disease Control. .0973Robert E. Olson, M.D.School of MedicineSt. Louis University Medical centerGilbert S. Omenn?M.D.Office of Management and BudgetExecutive Office of the PresidentEdward 0. OswaldSchool of Public Health,University of South Carolina 1'Elizabeth Owen4-Heritage, Conservation, and Recreation ServiceU.S. Department of the InteriorFran Owen, M.P.H.South Carolina Department of Health and EnvironmentalControlGeorge M..Owen, M.D.School of Public Health.University of MichiganIllichard L. Parker, D.V.M., M.P.H.Bureau of EpidemiologySouth Carolina Department of Health and EnvironmentalControlAaRuss PateSchool of Public HealthUniversity.of South CarolinaLinwood J. Pearson, M.D.Department of Health.Commonwealth of PennsylvaniaA.

96 M. PearsonDepartment of Food Science and
M. PearsonDepartment of Food Science and Human NutritionMichigan State UniversityTerry F. Pechacek, Ph.D.School of Public HealthUOversity of MinnesotaBarbara PermanYale UniVersityThomas F. A. Plaut, Ph.D.National Institute of Mental HealthNational Institutes of HealthRichard N. Podell, M.D., M.1'11.Overlook Family Practice AssociationOverlook Hospital '(Summit, NJ)Michael R. PollardOffice of Policy Planning and EvaluationFederal Trade CommissionMarion B. Pollock, Ed.D.Department of Health ScienCalifornia State UniversityLawrence E. PoseyBureau of Health EducationCenter for Disease Controlak E. Charlton Prathcr, M.D.Department of Health and Rehabilitative Servi&esState of FloridaRichard A. PrescottHealth Systems Agencrof.South Central ConnecticutShirley S. PrestonAmerican Cancer SocietyJames H. Price, Ph.D., M.P.H., FASHADepartment of Health and Safety EducationopKeversityJean.PriesterU.S. Dep,ent of AgricultureMilton Puziss, Ph.D.National Institute of Allergy and Infectious DiseasesNational Institutes.of HealthDavid L. Rabin, M.D., M.P.H.Georgetown University School of MedicineWashington, D.C.David E. RaleyDirectorate of Aerospace SafetyDepartment of DefenseJohn Rankin, M.D.School of MedicineUniversity 9f WisconsinGil Ratcliff, Jr., M.D.West Virginia committee for Perinatal HealthH. Dickinson RathbunChristian Science Committee on PublicationsBoston, MassachusettsElizabeth B. RawlinsSimmons CollegeWilliam E. Rawls, M.D.Department of PathologyMc Masters UniversityJack RechtNational Safety CouncilJames a RegnierBlue Cross and Blue Shield of MinnesotaRobert L. RetkaNational Institute on Drug AbuseU.S.HealddlipiceGladysReynolh.D.Bureau of State Set-acesCenter for Disease ControlU.S Public Health Service, Region VIIAnn$ M. Rhome, M.P.H., R.N.American Nurses' Association,Houston, TexasGina Ries, R.D.Iowa State Department of Health98Elizabeth W. Riggs, R.N., CNMGeorgia Department of Human ResourcesAtlanta, GeorgiaAdonna A. RileyCommission on Health and WelfareNational PTAaDavid Rimland, M D.V.A. Medical CenterDecatur, GeorgiaWilliam P. Ringo, Ph.D.Birmingham Regional Health Systems AgencyBirmingham, AlabamaHania W. Ris, M.D.Department of Pediatrics'University of Wisconsin Medical SchooleShW. Ritter, Jr.Offif Human Development ServicesDeptment of Health and Human ServicesHilda H. RobbinsMental Health AssociationArlington, VirginiaFrances T. Roberts4Office of Child Day CareState of ConnecticutSusan Roberts, R.D.Iowa Slate Department of HealthH. Clay Roberts.Educational Service District #121Seape, WashingtonJack Robertson, D.D.S.Office of Dental AffairsU.S. Public Health ServiceDonald H. Robinson, M.D.South Carolina Department of Health and EnvironmentaltrolEdward Roccella, Ph.D.National Heart, Lung, and Blood InstituteNational Institutes of HealthRoger W. Rochat, M.D.Bureau of EpidemiologyCenter for Disease ControlAva Rodgers, Ph.D.141/4/tScience and Education AdministratioE e nsionU.S. Department of AgricultureMaria L. RodriguezGuadalupe Family Health ClinicToledo, OhioMilton I. Roemer, M.D..School of Public HealthUsniversity of California, Los AngelesVincent C. Rogers, D.D.S., M.P.H.Bureau of Defital Care94 William N. Rom, M.D., M.P.H.College of MedicineUniversity of Utah*Judith P. RooksOffice of Population AffairsU.S. Public Health ServiceWilliam L. Roper, M.D.Jefferson County Health DepartmentBirmingham, Alabama 'IrPatricia F. Itoseleigh, R.D.,Indian Health ServiceHealth Services AdministrationGerald Rosenthal, Ph.D.National Center for Health Services ResearchJohn Roskis, Pharm. D.Mercer University SouthernAtlanta, GeorgiaJeannie I RosoffAlan Guttmacher InstituteSheldon Rovin, D.D.S., MS.V.A. Scholars ProgramWashington,' D.C.George Rubin, M.D.Bureau of

97 EpidemiologyCenter for Disease ControlD
EpidemiologyCenter for Disease ControlDavid D. Rutstein, M.D.Countway LibraryHarvard UniversityRonald K. St. John, M.D.Bureau of State ServicesCenter for Disease ControlJ--. H. Sammons,M.D.erican Medical Associationago, IllinoisJoseph SampugnaDepartment of ChemistryUniversity of MarylandAnthony V. Sardinas,M.A., M.P.H.Office of PublicHealthState of ConnecticutRoger SargentSchool of Public Health-University of South Carolina*John W. Scanlon, M.D.Columbia Hospital for WomenWashington, D.C.William Schaffner, M.D.Departments of Medicine and PreventiveMedicineVanderbilt University HospitalRenee Schick-Capital Systems Group %.Rockville, Maryland'r--Roger SchmidtAmerican Lung AssociationStephen C. Schoenbaum, M.D.Peter Bent Brigham HospitalBoston, MassachusettsJaA.-Schoenberger, M.D.Ru h-Presbyterian-St. Luke's Medical CenterChi ago, Illinois-Marc Schuckit, M.D.Veterans Administration HospitalSan Diego, CaliforniaMyron G. Schultz, M.D.I,Bureau of EpidemiologyCenter for Disease ControlCatherine Schutt, R.N., M.S.Union HospitalLynn, MassachusettsBarbara Scott, R.D., M.P.H.Division of HealthNevada Department of Human ResourcesRobert H. Selwitz, D.D.S., M.P.H.Region IIIDepartment of Health and Human Services-John C. Sessler, Ph.D.Office of Health Planning and EvaluationU.S. Public Health ServiceIris R. Shannon, R.N., M.S.American Public Health AssociationAlvin P. Shapiro, M.D.Department of MedicineUniversity of Pittsburgh School of MedicineMarion SheehanMetropolitan LifeSusan B. SheltonBureau of TrainingCenter for Disease ControlCecil Sheps, M.D.Health Services Research CenterUniversity of North CarolinaEdward ShmunesSchool of Public HealthUniversity of South CarolinaClyde E. Shorey, Jr..The National Foundation March of DunesNaseeb L ±Shory, D.b.S!"Bureau of Dental HealthAlabama Department of Public HealthCarole J. Sieverson-Metropolitan Health BoarF1St. Paul! Miruiesota-.r,-A. ..-=,Artemis P. Simopoulos, M.D.Nutrition' Coordinating CommitteeNational Institutes of HealthLouis Slesin, Ph.D.Natural Resource Defense CouncilJohn Scott SmallNational Institute of Dental ResearchNational Institutes of HealthJessie M. SmallwoodHealth Systent Agency,, Inc.New Orleans, LouisianaJohnnie W. SmithSouth Carolina Department of Health and EnvironmentalControl*W. McFate Smith, M.D.Department of MedicineUniversity of California at San Francisco 1.Roy G. Smith, M.D.School of Public HealthUniveresity of Hawaii at Manoa.James M. Sontag, Ph.D.National Cancer InstituteNational Institutes of Health. -Harrison C. Spencer, M.D.Bureau of Tropical DiseasesCenter for Disease ControlSpruyt, M.D.Division of Health ServicesNorth Carolina Department of Human ResourcesHarry Staffileno. Jr., D.D.S.The American AcademyOi PeriodontologyRose StamlerThe Medical SchoolNorthwestern UniversityCharles S. (Jack) Star4eyBureau of Training\Center for Disease ControlFredrick J. Stare, M.D.School of Public HealthHarvard UniversityWilliam B:Stason; M.D.School of PubHalthHarvard Univers' y),.Chedwah J. Stein, M.S., RIX.'N.utritidn Unit()region State Health DivisionJeanne M.Igtellm-VVoinen's Occupational Health Resource Center;American Health FoundationPauline G. Stitt, M.D.School of Public Health6University'Of Hawaii at ManoaT. Wayne StottNational Family Planning and Reproductive HealthAssociationAngela Strickland,American Public Health AssociationDavid F. Striffier, D.D.S:School of Public HealthUniversity of MichiganPhyllis E. Stubbs, M.D.Baltimore City Health DepartmentA. T, Sturdivant'Atlanta Area OfficeConsumer Product Safety CommissionMary E. SullivanBureau of Health EducationCenter for Disease ControlJim SummersMetairie, LouisianaJohn David Suomi, D.D.S:Office of Dental -AffairsU.S. Public Health Se

98 rviceJuris, M. Svarcberg, D.M.D., M.P.H.
rviceJuris, M. Svarcberg, D.M.D., M.P.H.Henry J. Austin Health CenterTrenton, New Jersey'*Glen SwengrosPresident's Council on Physical Fitness and SportsDonald A. Swetter, M.D.Indian Health ServiceHealth Services AdministrationC. Barr Taylor, M.D.1Department of Psychiatry, and Behavior ScienceStanford Medical CenterI-, David Taylor'Office of the SecretaryDepartment of Health and Human ServicesAndy TepPer-RainussenOklahoma Health'Systetns Agency, Inc.Stephen Teret, J.D.School of Hygiene and Public HealthrJohns Hopkins UniversityStephen Thacker:M.D.Bureau of Epiderni6logy,Center for Disease ControlCaroline B. Thothas, M.D..School of MedicineJohns Hopkins UniversityFlra L. ThongDepartment of HealthState of Hawaii100i. Hugh H. Tilson, M.D.North Carolina Di Vision of Health ServicesMarian TompsonLa Leche League InternationalCarl Pi. Tyler, Jr.pM.D.Bureau of EpidemiologyCenter for Disease ControlLouise B7 Tyrer, M.D.,Planned Parenthood rederatipn of Anierica, Inc../John E. E. Vanderveen, Ph.D.Division of Nutrition'Food and Drug AdniinistrationtBetty Vanta, R.D.Georgia State UniversityAtlanta, GeorgiaJamese D. Vargo, M.D.VA Medical CenterDecatur, Gecirgia*Tom M. Vernon, M.D.Colorado Department of Health,Murray VincentSchool'of Public HealthUrniversity of South Carolina,John ft. Viren, Ph.D.Office of Health and EnvironmentalResearchU.S. Department of EnergyFrank J. Vocci, Ph.D.Drug Abuse StaffFood and Drug AdministrationThomas M. Vogt, M.D., M.P.H.Kaiser Foundation HospitalsPortland, OregonJane Voicheck, Ph.D.Science and Education AdministriionExtensionU.S. Department of AgricultureHiawatha B. Walker, Ph.D.School of Public and Allied HealthEast Tennessee State University.Lawrence M. Wallack, M.S.School of Public Health,University of California, BerkeleyJulian A. Waller, M.D.Dpartment of Epidemiology andEnvironmental HealthUniversity of Vermont MedicalSchoolEli WaltersEnvironmental Policy InstituteVirginia Lt Wang, Ph.D.School of Hygiene and Public HealthJohns Hopkins Univeri'ityV4*Graham WardNational Heart, Lung and Blood InstituteNational Institutes of HealthBeverlyWare, Dr. P.H.Ford Motor CompanyKenneth E. Warner, Ph4"School of Public HealthUniversity of Michiganfl*David H. Wegman, M.D.School of Public HealthHarvard UniversityJohn H. Weisburger, Ph.D.American Health Foundation-Naylor Dana Institute for Disease PreventionJerrold L. Wheaton, M.D.Riverside County Health DepartmentRiverside, CaliforniaPatricia F. Whitmore, Mr§.W.1-fpDepartment of Mentalalth/Mental RetardationState of TennesseePaul J. Wiesner, M.D.Bureau of State ServicesCenter for Disease ControlK.D. WiggErsIowa state University of Science andTechnologyCharlotte WilenSelect Panel for the Promon of ChildHealthJean C. Wilford.413tireau of TrainingCeliter for Disease ControlJaneWilliamsEnvironmental Policy Institute1 *Jack Wilmore, Ph.D.Department of Physical Education and AthleticsUniversity of ArizonaRonald W. WilsonDivision of Analysis'National Center for Health Statistics1John J. Witte, M.D.Bureau of Health EducationCenter for Disease ControlIlene Wolcott, Ma.Ed.,Worne.a. and Health Round TableWashington, D.C.Frederick S. Wolf, M.D.Alabama Department of Public Health,Joan M.VolleHealth Ediucation CenterMaryland Depatfment of Health and Mental Hygiene George J. Wolnez,,C.S.P., P.E.Sanderson Safety SupplyPortland, OregonSidney WolVetihnDivision ofventionAlcohol, DAbuse, and Mental Health AdministrationCatherlineoteki, Ph.D.Office of Ttchnology AssessrhentU.S. Confess93102William L. Yarber, HSDDepartment54 Health EducPurdue UniversityEleanor A. Young, Ph.D.Department of MedicineUniversity of Texas Health Science CenterSteven Zifferblatt, Ph.D.National Heart, Lung, and Blood InstituteN'ationa