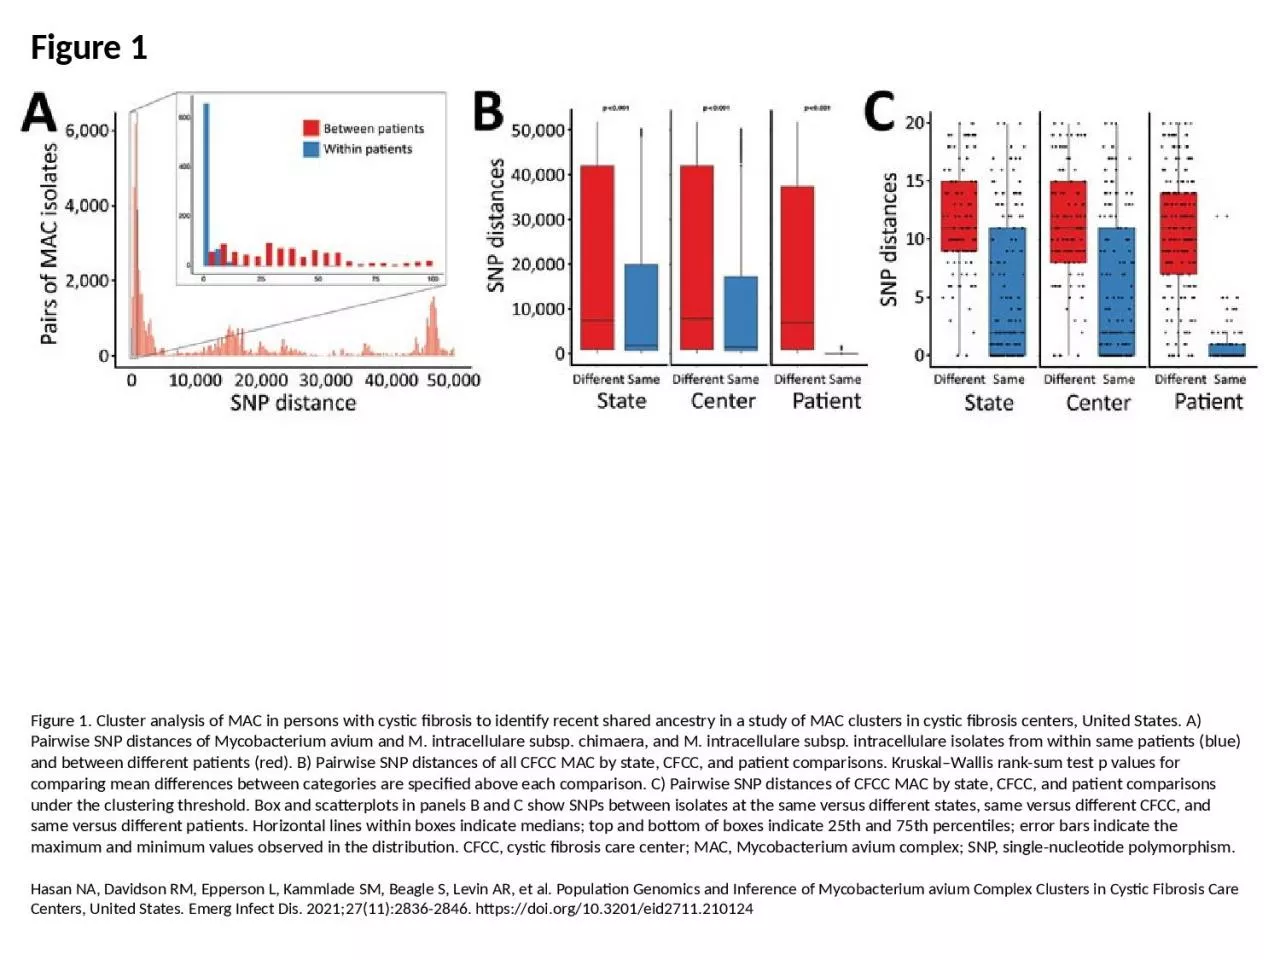
/
Figure 1 Figure 1. Cluster analysis of MAC in persons with cystic fibrosis to identify Figure 1 Figure 1. Cluster analysis of MAC in persons with cystic fibrosis to identify

Figure 1 Figure 1. Cluster analysis of MAC in persons with cystic fibrosis to identify - PowerPoint Presentation

megan
megan . @megan
Follow
66 views
Uploaded On 2023-05-21

Figure 1 Figure 1. Cluster analysis of MAC in persons with cystic fibrosis to identify - PPT Presentation

Hasan NA Davidson RM Epperson L Kammlade SM Beagle S Levin AR et al Population Genomics and Inference of Mycobacterium avium Complex Clusters in Cystic Fibrosis Care Centers United States Emerg Infect Dis 2021271128362846 httpsdoiorg103201eid2711210124 ID: 998732

mac cfcc fibrosis cystic cfcc mac cystic fibrosis snp states patients intracellulare avium mycobacterium pairwise distances clusters subsp comparisons

Share:

Link:

Embed:

Download Presentation from below link

Download Presentation The PPT/PDF document "Figure 1 Figure 1. Cluster analysis of M..." is the property of its rightful owner. Permission is granted to download and print the materials on this web site for personal, non-commercial use only, and to display it on your personal computer provided you do not modify the materials and that you retain all copyright notices contained in the materials. By downloading content from our website, you accept the terms of this agreement.


Presentation Transcript

1. Figure 1Figure 1. Cluster analysis of MAC in persons with cystic fibrosis to identify recent shared ancestry in a study of MAC clusters in cystic fibrosis centers, United States. A) Pairwise SNP distances of Mycobacterium avium and M. intracellulare subsp. chimaera, and M. intracellulare subsp. intracellulare isolates from within same patients (blue) and between different patients (red). B) Pairwise SNP distances of all CFCC MAC by state, CFCC, and patient comparisons. Kruskal–Wallis rank-sum test p values for comparing mean differences between categories are specified above each comparison. C) Pairwise SNP distances of CFCC MAC by state, CFCC, and patient comparisons under the clustering threshold. Box and scatterplots in panels B and C show SNPs between isolates at the same versus different states, same versus different CFCC, and same versus different patients. Horizontal lines within boxes indicate medians; top and bottom of boxes indicate 25th and 75th percentiles; error bars indicate the maximum and minimum values observed in the distribution. CFCC, cystic fibrosis care center; MAC, Mycobacterium avium complex; SNP, single-nucleotide polymorphism.Hasan NA, Davidson RM, Epperson L, Kammlade SM, Beagle S, Levin AR, et al. Population Genomics and Inference of Mycobacterium avium Complex Clusters in Cystic Fibrosis Care Centers, United States. Emerg Infect Dis. 2021;27(11):2836-2846. https://doi.org/10.3201/eid2711.210124