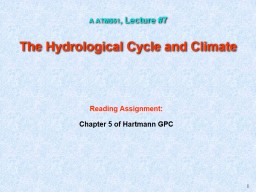
/
A ATM551 , Lecture #7 The Hydrological Cycle and Climate A ATM551 , Lecture #7 The Hydrological Cycle and Climate

A ATM551 , Lecture #7 The Hydrological Cycle and Climate - PowerPoint Presentation

mila-milly
mila-milly . @mila-milly
Follow
65 views
Uploaded On 2023-10-04

A ATM551 , Lecture #7 The Hydrological Cycle and Climate - PPT Presentation

Reading Assignment Chapter 5 of Hartmann GPC 1 Summary of Surface Energy Balance Rnet SWnet LWnet LH SH S L SH E G A w Outline of Todays Lecture 3 Overview of the Global Hydrological Cycle ID: 1022729

surface water runoff precipitation water surface precipitation runoff evaporation energy global air atmospheric vapor land time cycle ice occurs

Share:

Link:

Embed:

Download Presentation from below link

Download Presentation The PPT/PDF document "A ATM551 , Lecture #7 The Hydrological C..." is the property of its rightful owner. Permission is granted to download and print the materials on this web site for personal, non-commercial use only, and to display it on your personal computer provided you do not modify the materials and that you retain all copyright notices contained in the materials. By downloading content from our website, you accept the terms of this agreement.


Presentation Transcript

1. A ATM551, Lecture #7The Hydrological Cycle and ClimateReading Assignment: Chapter 5 of Hartmann GPC1

2. Summary of Surface Energy BalanceRnet (SWnet + LWnet) = LH + SHSLSHEGAw

3. Outline of Today’s Lecture3Overview of the Global Hydrological Cycle: Reservoirs, fluxes, and water balancesEvapotranspirationPrecipitation Runoff

4. The Role of Water in Climate4Water vapor provides the largest greenhouse effectWater and ice clouds reflect sunlight and block OLRLatent heating during precipitation is a major source of energy for the atmosphere Surface evaporation regulates surface temperatureSurface water fluxes (E-P) affect salinity in upper oceans, and thus ocean circulation Ice-albedo feedback is important for climate changeThe water cycle affects the energy cycleA dry atmosphere would have a very different kind of weather and climate with no clouds, no precipitation, no snow and ice. Examples?

5. The Global Hydrologic Cycle(From Trenberth et al., J. Hydrometeorol., 2007)535% land P comes from oceanic E.This amount runs off into ocean. Runoff ratio=0.35P balances 90% oceanic E.10% of the E transported toland and returned by continental runoffT=9days T  3200yrs

6. 6Trenberth et al. (2009, BAMS)It takes ~80W m-2 energy to evaporate 1m of water in a year.H2OH2OThe energy and hydrologic cycles are coupled

7. 7From http://ga.water.usgs.gov/edu/watercyclesummary.htmlEarth’s total amount of water does not change on 103 time scales!Where is the Water?

8. 8An Estimate of the world water reservoirs. Source: MIT OpenCourseWare.Surface area (million km2)Volume (million km 3)Volume (%)Equivalent depth (m)Residence timeOceans and seas 3611,370942,500~4,000 yearsLakes and reservoirs 1.550.13<0.010.25~10 yearsSwamps <0.1<0.01<0.010.0071-10 yearsRiver channels <0.1<0.01<0.010.003~2 weeksSoil moisture 1300.07<0.010.132 weeks to 50 yearsGroundwater 1306041202 weeks to 100,000 yearsIcecaps and glaciers 17.83026010 to 1,000 yearsAtmospheric water 5040.01<0.010.025~10 daysBiospheric water <0.1<0.01<0.010.001~1 week

9. P-E(runoff ratio)

10. P-E

11. =P-E

12. Summary of the Global Water Cycle12Definition: It refers to the movement of water on, above or below the surface of the Earth. Also known as the hydrological cycle. It helps re-distribute water and energy on Earth, greatly affects surface temperature, forms clouds and precipitation, thus playing a critical role for the weather, climate and biosphere on Earth. Main Reservoirs: - Oceans (96%, t103yrs), freshwater on land (2.5%, t=weeks to years ), the atmosphere (<0.01%, t =10days ), the biosphere (<0.01%, t=1week) - Freshwater: 68.6% in glaciers and ice caps, 30% in groundwater, 2.5%in surface water (ice and snow, lakes, soil moisture, etc.)Main Fluxes: - Surface to the atmosphere: evaporation (Ocean: 1176mm/yr; land: 480mm/yr) - The atmosphere to the surface: precipitation (Ocean: 1066mm/yr; land: 748mm/yr) - Atmospheric transport: Ocean to land (40,000km3/yr) - Land to ocean runoff: 40,000km3/yr or 35% of land precipitation (runoff ratio=0.35). Main Physical Processes: - Evaporation (absorbs heat, cools the surface) - Condensation/precipitation (releases heat, heats the air) - Infiltration : flow of water from the surface into the ground (soils). - Runoff : lateral movements of water on landLinked to the global energy cycle: evaporation brings about 80W/m2 of latent heat into the atmosphere. Water vapor and clouds affect atmospheric energy budgets.

13. Surface Water BalancePERWWater StoragedW/dt = P- E - R This applies to local, regional and global scales For long-term mean, dW/dt0, soP - E  R (runoff) How these terms may change under global warming is a major research topic.

14. Atmospheric Water BalancePEDivWWater StoragedW/dt = E- P - Div This applies to local, regional and global scales Global-mean Div=0 and dW/dt0, so P=E globally. R=-Div for steady states in a region. Globally, how much water goes up into the air has to come down to the surface on an annual basis. Div

15. Main Water Cycle Processes: Evaporation Precipitation Runoff

16. Evapotranspiration over LandWang and Dickinson (2012)16Evaporation Limited by 1) water availability, 2) available energy, and3) turbulent mixing

17. Controls of E Vegetation plays a key role by drawing water from deep soils.Energy availability: E is large in daytime and warm seasons Soil water availability: Dry soils reduce EWind speed: Strong winds increase mixing, leading to higher EAir Temperature: higher T is associated with higher Rn and larger stomatal openings in leaves, leading to higher E.Relative humidity: E decreases as RH increases.

18. 18Turbulent Eddy MixingFrom http://www.instrumentalia.com.ar/pdf/Invernadero.pdf

19. Evaporation Process: some water molecules on a water surface may have enough kinetic energy to break the hydrogen bonds and enter the thin layer of air just above the water surface. The vapor molecules are then mixed upward away from the water surface, creating a water flux called Evaporation. This evaporation process is the same over water and ice surface, soil pores, plant tissues, and cloud droplets. E is determined by vapor pressure gradient at the interface: If es*(Ts) > ea, evaporation is occurring (it may form a fog or mist if RH=100%); If es*(Ts) < ea, water vapor is condensing on the surface; andIf es*(Ts) = ea, neither evaporation nor condensation is occurring. Note: ea is determined by how quickly the water molecules are removed from the layer adjacent to the interface by turbulent mixing. Need energy to break up the hydrogen bonds es*(Ts) = saturation vapor pressure for T = TsWaterAir

20. Evaporation Over Oceans20With enough energy, water molecules can leave ocean surfaces and enter the air as vapor, which is mixed upward and horizontally by wind turbulence. This turbulent water flux ( ) can be estimated using various methods (see Smith et al. 1996): - Budget methods - Local covariance methods - Monin-Obukhov Similarity Methods Simplified Bulk Parameterization (Fairall et al. 2003) is commonly used in models, satellite retrievals, and climate analyses: where Cd is a turbulent exchange coefficient, a function of atmospheric stability, the air-sea temperature difference, and wind speed; U is near-surface wind speed; qs is the saturation specific humidity at the sea surface temperature; and qa is the near-surface atmospheric specific humidity. This is the same bulk formula as for surface LH flux.SUNWind

21. Transpiration is the evaporation of water from the vascular system of plants into the atmosphere The transpiration process includes: absorption of soil water by plant roots; translocation of water through the vascular system of the roots, stem, and branches to leaves; movement of water through the vascular system of the leaf to the walls of tiny stomatal cavities, where evaporation occurs. The water vapor in these cavities moves into the ambient air through openings in the leaf surface called stomata. Transpiration Process

22. 22Transpiration from a Lead

23. 23Resistance to Evapotranspiration over Land

24. Theoretical Estimates of E over LandMonin-Obukhov Similarity Theory (MOST): Assumes a constant flux within a layer (of ~100m) above a homogeneous surface. It relates the flux to T and q vertical gradients through its universal stability function. The MOST has an error of 10-20% under ideal conditions. The Penman-Monteith Equation: uses surface radiation, temperature, and humidity data to estimate E (see pp.125-126 of GPC for its derivation): where =latent heat of vaporization, =des/dT, Rn is net surface radiation, G is the heat flux into the ground, rc and rh are the canopy and aerodynamic resistance (see Wang and Dickinson 2012 for details)The P-M Eq. is often used to estimate the E from wet surfaces (referred to as the Potential E, as the resistance from a water-stressed surface is hard to estimate. Net heatingDryness of air

25. Simplified Penman-Monteith Eq. Priestley-Taylor Equation: where =1.2-1.3 for wet surface, but varies with soil moisture. It ignores impacts of VPD and canopy resistance, and considers the effects of Rn and T (through ).FAO Penman-Monteith Eq. for the well-watered hypothetical grass reference crop (Allen et al. 1998): u2=2m wind speed.

26. (Evapotranspiration from a wet surface with unlimited water supply)

27. (for U and RH = constant case)Increased atmospheric demand for moisture  potential drying and drought

28. Zhao and Dai (2015)Model Projected PET Change (%)2070-2099 minus 1970-1999, 14 CMIP5 model average, RCP4.5 scenario

29. Observations of E Eddy Covariance (EC) Method: It measures SH and LH fluxes from their covariance with vertical velocity using rapid response sensors at frequencies ≥10Hz. First used by Australian scientists in the 1950s, now used at 500+ FLUXNET sites. Error range: 5-20%.

30. Observations of E (cont’d) Energy Balance Bowen Ratio (BR) Method: It uses measurements of vertical gradients of T and q to partition the available energy into sensible (H) and latent (E) heat fluxes. Suitable for short vegetation. The Bowen Ratio (Bo) is estimated as The T and q gradients may be small, which could lead to large errors in . E is then estimated from the surface energy balance equation:

31. 31PE over grass ref. cropE over well watered cropE over a natural land areaPotential vs. Actual E

32. Annual Potential Evapotranspiration (mm/yr Source: UNEP) PET represents atmospheric demand for moisture.

33. Actual Surface Evaporation Distribution33

34. Movie 1: Earth: The Water PlanetMovie 2: The Water Cycle

35. Precipitation35Formation:When air cools (e.g., due to ascending), water vapor can become saturated and condense on tiny particles (condensation nuclei) such as dust, ice, or salt. This forms cloudsSmall cloud droplets combine to form larger droplets (coalescence) Some of the droplets collide to form even larger raindrops that can fall out of the cloudsRaindrops have sizes ranging from 0.1 mm to 9 mm in diameter. Hail forms in storm clouds when super-cooled (T<0oC) water droplets freeze. The storm’s updraft (a rising air plume) blows the hailstones into the upper part of the clouds. As the updraft dissipates, the hailstones fall back to the lower part of the clouds. This process can repeat many times until the hailstones become large enough (d>5mm) to fall out of the cloud. Snowflakes form when tiny super-cooled cloud droplets (d10m) freeze.

36. Cause of Precipitation36Frontal activity: Large-scale (≥1000km) stratiform precipitation occurs when air ascents in a synoptic weather system, such as over surface cold fronts, and over or ahead of warm fronts. It can last for hours to days. Warm air Cold air Convection: Convective rain, or showery precipitation occurs during deep convection that forms tall cumulus clouds (cumulonimbus). It usually occurs during warm season over a few km and less than 1hr, but a storm can travel over a long distance for many hours. - Orographic effects: Orographic precipitation occurs on the windward side of mountains and is caused by the rising air motion of a large-scale flow of moist air across the mountain ridge, resulting in adiabatic cooling and Condensation. Lifting of the air is the trigger!

37. Different Phases of Precipitation

38. Two Types of Precipitation: Convective precipitation Stratiform precipitation Needs low-level convergence and upward motionMost of the rain comes from water in surrounding air!

39. Precipitation Characteristics Amount (A): precipitation accumulated over a given time period T (e.g., a month). A is often expressed using a mean rate = A/T (= 75mm/30days = 2.5 mm/day for Station A) Intensity (I): the rate averaged over the precipitating time t, i.e., I= A/t (=75mm/2days =37.5 mm/day for Station A). Events with I > 50mm/day is often called heavy precipitation. Frequency (F): the fraction of the time it rains, F= t/T (=2days/30days = 6.7% for Station A) A = F  I  Same A can be obtained from different combinations of F and I, which is the case for station A and B and for many models!

40. Daily Precipitation at 2 stationsMonthlyAmount 75 mmAmount 75 mmdrought wild fires localwilting plants floodssoil moisture replenishedvirtually no runoffABFrequency 6.7%Intensity 37.5 mm/dayFrequency 67%Intensity 3.75 mm/dayFrom K. E. Trenberth

41. Questions: 1. What causes the large variations over the oceans? 2. Why deserts are located in the subtropics? mm/dayPrecipitation Distribution(Global-mean = 975mm/yr)GPCP = Global Precipitation Climatology Project

42. Evaporation (E) vs. Precipitation (P)42

43. Long-term Mean E – P Difference MapTrenberth et al. (2007, JHM)43

44. Key Differences between P and E44Precipitation occurs only in a fraction of the time, while evaporation occurs all the time, albeit largest around noon; E P t tPrecipitation rates vary greatly in space, while evaporation rates are more uniform, especially over the oceans ;Precipitation occurs at rates usually much larger than evaporation rates; Evaporation cools the surface, while precipitation heats the atmosphere; and Evaporation is controlled mainly by surface heating and wind speed, while precipitation is determined by atmospheric circulation and water vapor content.

45. Ra+Ra

46. On Global-mean Precipitation Rate

47. Ts and Ta are tightly coupled, so Ts and Ta increase together.LH + SH =

48. Ta increases with Ts, but H2Oand thus  also increases with Ts,leading to faster increases in F , which allows atmospheric latent heating or precip. to increase with Ts

49. Runoff and Infiltration49Surface runoff: the water flow on earth’s surface. It occurs only when the soil is saturated or can not absorb water from rain or snow/ice melt fast enough. The flow follows the terrain into streams. Subsurface runoff (or return flow): the lateral water flow below the earth’s surface, usually following the terrain under gravity.

50. 50Soil and Ground Water Processes

51. 51Soil and Ground Water Time Scales

52. Runoff Generation52How much runoff is generated in a storm is a major topic in hydrology. Many factors can affect runoff generation: - soil type affects infiltration capacity - vegetation affects how much rain is intercepted by canopy - slope and catchment size: steep slopes increase runoff, large size reduces the runoff per unit area.

53. Time of Concentration53Time of concentration is a concept used in hydrology to measure the response of a watershed to a rain event. It is defined as the time needed for water to flow from the most remote point in a watershed to the watershed outlet. It is a function of the topography, geology, and land use within the watershed.X

54. Runoff Coefficient:54 Runoff Coefficient: C = Runoff/Precipitation, both in mm depth over unit area and time. C is important for flood control and in Hydrology. Also called runoff ratio on a basin scale.

55. Runoff Ratio Distribution55

56. 56Oki & Kanae, Sci., 2006Global Discharge: ~38,000km3/yr = Global Potential renewable freshwater resource Potential Freshwater Resources

57. Key points of Today’s Lecture 57 The Global Water Cycle: - Main reservoirs and residence times: Oceans (1000yrs), atmospheric water vapor (10days), soil moisture and groundwater (days-decades), the cryosphere (snowpack, ice-cap, glaciers: seasons-1000yrs) - Main fluxes: Evaporation, precipitation, continental discharge, ocean-land moisture transport - Main physical processes: (Each is a research field!) Evaporation, precipitation, runoff- Water balance equations: At the surface: dW/dt = P – E – R; R=0 for global-mean, dW/dt=0 for long-term mean For an atmospheric column: dW/dt = P – E – Div; Div=0 for global-mean and dW/dt0 for annual mean, so P=E in this case. Div is water vapor divergence.- Atmospheric energy constraint on global-mean P rate: Latent heating is balanced by LW cooling (minus SH). Atmospheric LW cooling increases with Ts as surface downward LW flux increases faster than upward LW flux due to water vapor increases with Ts.

58. 58 - Reading Assignments: Chapter 5 of Hartmann GPC - Review my ppt slides Homework Assignments:

59. 59 Next Lecture: Atmospheric Circulation and Climate