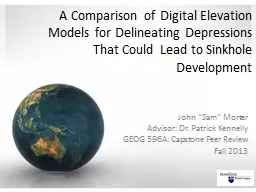
/
A Comparison of Digital Elevation Models for Delineating Depressions That Could Lead to A Comparison of Digital Elevation Models for Delineating Depressions That Could Lead to

A Comparison of Digital Elevation Models for Delineating Depressions That Could Lead to - PowerPoint Presentation

min-jolicoeur
min-jolicoeur . @min-jolicoeur
Follow
346 views
Uploaded On 2018-11-06

A Comparison of Digital Elevation Models for Delineating Depressions That Could Lead to - PPT Presentation

John Sam Morter Advisor Dr Patrick Kennelly GEOG 596A Capstone Peer Review Fall 2013 Overview Background Problem Goal and Objective Study Area and Environment Data Methodology Anticipated Results ID: 718214

florida sinkholes county sinkhole sinkholes florida sinkhole county karst amp study data dems geological stereo depressions spatial surface elevation

Share:

Link:

Embed:

Download Presentation from below link

Download Presentation The PPT/PDF document "A Comparison of Digital Elevation Models..." is the property of its rightful owner. Permission is granted to download and print the materials on this web site for personal, non-commercial use only, and to display it on your personal computer provided you do not modify the materials and that you retain all copyright notices contained in the materials. By downloading content from our website, you accept the terms of this agreement.


Presentation Transcript

Slide1

A Comparison of Digital Elevation Models for Delineating Depressions That Could Lead to Sinkhole Development

John “Sam” MorterAdvisor: Dr. Patrick KennellyGEOG 596A: Capstone Peer ReviewFall 2013Slide2

Overview

BackgroundProblemGoal and ObjectiveStudy Area and EnvironmentDataMethodologyAnticipated ResultsTimelineReferencesSlide3

Background – The Cause of Sinkholes

Sinkholes are a natural geologic hazard that occur over time in soluble bedrock, also known as karst landforms.Sinkholes have occurred throughout Florida.

R

ecently,

sinkhole damage has become a major concern for many Florida

residents.

As a result, several studies are underway by State and Federal Agencies to map the sinkhole risk.

Sinkhole Distribution in Florida

* Provided by Florida Geological Survey Map Series No. 110Slide4

Background – The Cause of Sinkholes

Rainwater mixes with surface matter to form carbonic acid and drains though the surface.

A complex hydrologic system - the aquifer, contributes to the erosion process.

Eventually

, the

underground erosion becomes

so extensive that the surface can no longer support itself and a sinkhole appears

.One

thing that all sinkholes have in common, is the dissolution of the foundation that supports the surface.

(Beck, 1986)Slide5

Background – The Cause of Sinkholes

The two basic types of sinkholes most commonly found in Florida are cover-subsidence and cover-collapse.

Cover- subsidence sinkholes typically form gradually as the surface is made of sand and loose sediments that spall and slide in to openings in the carbonate rock.

(Tihansky

,

1999)

www.saveoursuwannee.orgSlide6

Background – The Cause of Sinkholes

Cover collapse sinkholes occur In areas where the overburden is mostly comprised of clay, or other firm sediments. The underground cavity eventually breaches the surface resulting in an abrupt collapse.

Cover-collapse

sinkholes are the type often reported on by the news media and most people envision when they hear the word sinkhole.

(Tihansky

,

1999)Slide7

Problem

Where sinkholes are going to occur is difficult to predict.The identification of sinkhole formation is a difficult task.

Identifying closed depressions, or saturation zones.

Digital Elevation Models (DEMs) may be useful in some circumstances.

Light Direction and Ranging (LiDAR) data are a challenge to collect and process.

Stereo imagery extracted DEMs may be a viable solution.Slide8

Goals

The goal of this study is to analyze and compare various resolution DEMs of the Suwannee County region and delineate all closed depressions that could be considered indicative to the formation of sinkholes.A key objective in this study is to

also create

a custom stereo

imagery derived elevation

model and evaluate and compare it against the other DEMs.Slide9

Study Area and Environment

For the purposes of this study, I will concentrate on Suwannee County, Florida. Since the 1960’s, 193 sinkholes have been reported in this county.

Suwannee CountySlide10

Study Area and Environment

Suwannee county is exceptionally prone to sinkhole activity due to the permeability of its soil and the high rate of groundwater recharge. After Tropical Storm Debby in June 2012, this county experienced over a hundred sinkholes within a week.

Suwannee CountySlide11

Data

Florida Geological Society’s Sinkhole IndexNational Elevation Data (NED) Set 1/9 (~3 meter spatial resolution)NED Set 1/3 (~10 meter spatial resolution)

NED

Set 1 (~30 meter spatial

resolution)

High resolution (1 foot) stereo aerial imagery

Closed Topographic Depressions – FloridaSlide12

Methodology

Extracting elevation data from aerial stereo imagery

Step 1 – Preprocess and import in to SOCET GXP

Step 2 – Triangulation

Step 3 – Run NGATE

Step 4 – Perform ITE

Step 5 – Mosaic Tiles

(Aerial Index from the FDOT)

www.socetgxp.comSlide13

Methodology

Processing DEMs in ArcGIS Spatial Analyst

NED 1

NED 1/3

NED 1/9

Stereo Derived DEM

“Fill” in ArcMap Spatial Analyst

Subtract original DEM from “Filled” DEM

Select

and re-classify

Export to PolygonSlide14

Methodology

Final Step – Analyze and report results

Perform Zonal Statistical Analysis utilizing the “

t

rue” depressions and each “candidate” depression

Compute statistics on correlation rates for each DEM and points from the Florida Sinkhole IndexSlide15

Anticipated Results

Results of this study will be different sets of products that delineate closed depressions/saturation zones in the Suwannee County region based on each DEM.Products will include maps, shapefile/kmz data layers, spreadsheets, graphs and 3D visualizations.It is anticipated that the results of this study will

help contribute

to the overall effort of mapping sinkhole vulnerability

on

multiple scales and possibly even

be incorporated

in to the State’s comprehensive report.Slide16

Timeline

January

February

March/April

Beyond…

2014

Acquire DEMs from USGS

Receive Stereo Imagery from FDOT

Secure license from BAE for SOCET GXP

Begin initial screening and preprocessing of all data

Derive DEMs from Stereo

Create “Fill-difference” rasters

Analyze with Zonal Stats

Produce maps, shapefiles, kmz overlays and graphs

Produce report and presentation slides

Present report at National conference

Submit case study to Florida Geological Survey

If unable to present prior to end of first quarter… Present report at the first available National conference

Follow-up with FGS and FDEPSlide17

References

Arthur, J. D., Baker, A. E., Cichon, J. R., Wood, A. R., & Rudin, A. (2005). Florida Aquifer Vulnerability Assessment (FAVA): Contamination potential of Florida’s principal aquifer systems. Report submitted to the Division of Water Resource Management, Florida Department of Environmental Protection. Tallahassee: Division of Resource Assessment and Management, Florida Geological Survey.  Beck, B. F., & Sinclair, W. C. (1986). Sinkholes in Florida: an introduction

. Florida Sinkhole Research Institute, College of Engineering, University of Central Florida.

Djokic, D. (2008),

Comprehensive Terrain Processing Using Arc Hydro Tools

, Environmental Systems Research Institute (ESRI) website. http://downloads.esri.com/blogs/hydro/ah2/arc_hydro_tools_2_0_overview.pdf, (accessed 14 Oct 2013).

Doctor, D. H., & Doctor, K. Z. (2012).

Spatial analysis of geologic and hydrologic features relating to sinkhole occurrence in Jefferson County, West Virginia. Carbonates and Evaporites, 27(2), 143–152.Doctor, D.H. and Young, J.A. (2013). An evaluation of automated GIS tools for delineating karst sinkholes and closed depressions from 1-meter LIDAR-derived digital elevation data. In: Land L, Doctor DH, Stephenson JB, editors, Sinkholes and the Engineering and Environmental Impacts of Karst: Proceedings of the Thirteenth Multidisciplinary Conference, May 6-10, Carlsbad, New Mexico: NCKRI Symposium 2. Carlsbad (NM): National Cave and Karst Research Institute, p. 449-458.Fleury, S., Carson, S., & Brinkmann, R. (2008). Testing Reporting Bias in the Florida Sinkhole Database. The Southeastern Geographer, 48(1), 38-52.Gutierrez, F., Cooper, A. H., & Johnson, K. S. (2008). Identification, prediction, and mitigation of sinkhole hazards in evaporite karst areas. Environmental Geology, 53(5), 1007-1022.Rahimi, M., Alexander, E. (2013), Locating Sinkholes in LiDAR Coverage of a Glacio-Fluvial Karst, Winona County, MN, Proceedings of the Thirteenth Multidisciplinary Conference, May 6-10, Carlsbad, New Mexico: NCKRI Symposium 2. Carlsbad (NM): National Cave and Karst Research Institute, p. 469-480. Tihansky, A. B. (1999). Sinkholes, west-central Florida. Land Subsidence in the United States, Galloway D., Jones, DR, and Ingebritsen SE, eds., United States Geological Survey Circular, 1182, p. 121-140.Bell, F. G., & Culshaw, M. G. (2005). Sinkholes and subsidence: Karst and cavernous rocks in engineering and construction. Springer.

Tihansky, A. B., & Knochenmus, L. A. (2001). Karst features and hydrogeology in west-central Florida—a field perspective. US Geological Survey Karst Interest Group, Proceedings US Geological Survey Water-Resources Investigations, St Petersburg, FL

, 198-211. Zisman, E. D. (2001). A standard method for sinkhole detection in the Tampa, Florida, area

.

Environmental & Engineering Geoscience

,

7

(1), 31-50.Slide18

Questions?

Thanks for your time and patience!