/
Census   Housing units  Census    Census   Occupied Census   Housing units  Census    Census   Occupied

Census Housing units Census Census Occupied - PDF document

min-jolicoeur
min-jolicoeur . @min-jolicoeur
Follow
478 views
Uploaded On 2015-05-17

Census Housing units Census Census Occupied - PPT Presentation

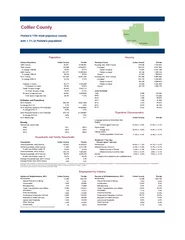
9 327 Owneroccupied 77825 4441799 2000 Census 251377 15982824 Renteroccupied 25148 1896130 change 199000 653 235 Vacant 41563 965018 2010 Census 321520 18801332 Housing units 2010 Census 197298 8989580 change 200010 279 176 Occupied 133179 7420802 ID: 68769

327 Owneroccupied 77825 4441799

Share:

Link:

Embed:

Download Presentation from below link

Download Pdf The PPT/PDF document "Census Housing units Census Census..." is the property of its rightful owner. Permission is granted to download and print the materials on this web site for personal, non-commercial use only, and to display it on your personal computer provided you do not modify the materials and that you retain all copyright notices contained in the materials. By downloading content from our website, you accept the terms of this agreement.


Presentation Transcript

1980 Census 85,971 9,746,961 2015 GDP 14,272,513 839,124,321 1990 Census 152,099 12,938,071 Percent of the State 1.7% % change 1980-90 76.9% 32.7% 2016 GDP 14,926,141 866,730,997 2000 Census 251,377 15,982,824 Percent of the State 1.7% % change 1990-00 65.3% 23.5% 2017 GDP 15,140,542 896,117,037 2010 Census 321,520 18,801,332 Percent of the State 1.7% % change 2000-10 27.9% 17.6% 2018 GDP 15,760,299 924,873,329 Age Percent of the State 1.7% % Under 18 years of age 19.5% 21.3% % 65 years of age and over 26.4% 17.3% Race & Ethnicity % White alone 83.9% 75.0% % Black or African American alone 6.6% 16.0% Housing units, 2000 Census 144,536 7,302,947 % Hispanic or Latino (of any race) 25.9% 22.5% Occupied 102,973 6,337,929 Owner-occupied 77,825 4,441,799 Estimates and Projections Renter-occupied 25,148 1,896,130 2019 Estimate 376,706 21,208,589 Vacant 41,563 965,018 % change 2010-19 17.2% 12.8% Housing units, 2010 Census 197,298 8,989,580 2020 Estimate 387,450 21,596,068 Occupied 133,179 7,420,802 % change 2019-20 2.9% 1.8% Owner-occupied 96,159 4,998,979 Based on 2019 Estimate Renter-occupied 37,020 2,421,823 2025 421,224 23,130,870 Vacant 64,119 1,568,778 2030 451,668 24,426,178 2035 477,168 25,497,950 Units Permitted 2040 498,363 26,428,726 1990 5,846 126,384 2045 517,384 27,266,909 2000 7,970 155,269 2019 Median Age 49.0 41.7 2010 1,259 38,679 2011 1,320 42,360 Density 2012 1,612 64,810 Persons per square mile 2013 2,678 86,752 2000 124.1 296.4 2014 3,610 84,075 2010 160.9 350.6 2015 4,060 109,924 2019 188.6 399.7 2016 3,829 116,240 2017 4,194 122,719 2018 4,386 144,427 Collier County Florida 2019 3,991 154,302 Persons aged 5 and over 33.3% 29.1% Place of birth Foreign born 25.0% 20.5% Veteran status Civilian population 18 and over 9.3% 8.9% Total households, 2000 Census 102,973 6,338,075 Same house 83.5% 84.3% Family households, 2000 Census 71,264 4,210,760 Different house in the U.S. 15.0% 14.6% % with own children under 18 32.8% 42.3% Same county in Florida 8.6% 8.7% Total households, 2010 Census 133,179 7,420,802 Different county in Florida 2.3% 3.1% Family households, 2010 Census 89,276 4,835,475 Different county in another state 4.1% 2.8% % with own children under 18 33.0% 40.0% Abroad 1.4% 1.1% Average Household Size, 2010 Census 2.38 2.48 Average Family Size, 2010 Census 2.84 3.01 Collier County Florida's 16th most populous county with 1.8% of Florida's population Households Collier County Housing Counts Census Population Florida Population Real Gross Domestic Product Collier County Florida Collier County Florida Households and Family Households Population Characteristics According to Census definitions, a household includes all of the people who occupy a housing unit. The occupants may be a single family, one person living alone, two or more families living together, or any other group of related or unrelated people who share living quarters. A family includes a householder and one or more other people living in the same household who are related to the householder by birth, marriage, or adoption. Census counts may be corrected for Census Count Question Resolution (CQR). Collier County Florida Language spoken at home other than English Florida Housing Real GDP (Thousands of Chained 2012 Dollars) Collier County Residence 1 Year Ago Persons aged 1 and over Collier County Number of Establishments 2019 preliminary Collier County Florida Percent of All Establishments 2019 preliminary Collier County Florida All industries 15,336 728,687 All industries 15,336 728,687 Natural Resource & Mining 99 5,301 Natural Resource & Mining 0.6% 0.7% Construction 2,241 75,725 Construction 14.6% 10.4% Manufacturing 326 20,782 Manufacturing 2.1% 2.9% Trade, Transportation and Utilities 2,438 140,766 Trade, Transportation and Utilities 15.9% 19.3% Information 178 11,897 Information 1.2% 1.6% Financial Activities 2,037 77,987 Financial Activities 13.3% 10.7% Professional & Business Services 3,744 174,242 Professional & Business Services 24.4% 23.9% Education & Health Services 1,325 77,515 Education & Health Services 8.6% 10.6% Leisure and Hospitality 1,232 59,068 Leisure and Hospitality 8.0% 8.1% Other Services 1,359 57,596 Other Services 8.9% 7.9% Government 85 6,044 Government 0.6% 0.8% Industries may not add to the total due to confidentiality and unclassified. All industries 151,509 8,878,680 All industries $50,117 $51,761 Natural Resource & Mining 1.9% 0.8% Natural Resource & Mining $31,368 $35,649 Construction 11.4% 6.3% Construction $50,915 $52,926 Manufacturing 3.0% 4.3% Manufacturing $58,627 $63,883 Trade, Transportation and Utilities 18.5% 20.3% Trade, Transportation and Utilities $45,529 $46,237 Information 0.9% 1.6% Information $70,404 $86,109 Financial Activities 5.6% 6.6% Financial Activities $92,642 $77,030 Professional & Business Services 10.8% 15.7% Professional & Business Services $62,314 $63,747 Education & Health Services 14.9% 14.9% Education & Health Services $54,346 $52,050 Leisure and Hospitality 19.6% 14.2% Leisure and Hospitality $31,906 $26,681 Other Services 4.3% 3.2% Other Services $36,601 $37,972 Government 9.1% 12.1% Government $55,838 $55,897 Industries may not add to the total due to confidentiality and unclassified. 1990 60.5% 64.3% 1990 5.5% 6.1% 2000 57.6% 63.7% 2000 3.7% 3.7% 2010 56.1% 62.2% 2010 11.6% 11.1% 2019 58.7% 61.2% 2019 3.1% 3.1% 1990 $4,151,199 $257,571,430 1990 $26,857 $19,763 2000 $10,859,890 $472,238,563 2000 $42,753 $29,428 2010 $20,182,883 $725,074,023 2010 $62,564 $38,474 2011 $21,240,021 $764,633,664 2011 $64,829 $40,047 % change 2010-11 5.2% 5.5% % change 2010-11 3.6% 4.1% 2012 $23,895,153 $793,428,830 2012 $71,913 $41,055 % change 2011-12 12.5% 3.8% % change 2011-12 10.9% 2.5% 2013 $23,535,850 $795,424,889 2013 $69,414 $40,659 % change 2012-13 -1.5% 0.3% % change 2012-13 -3.5% -1.0% 2014 $26,902,171 $856,161,682 2014 $77,455 $43,109 % change 2013-14 14.3% 7.6% % change 2013-14 11.6% 6.0% 2015 $29,640,880 $915,895,494 2015 $83,236 $45,287 % change 2014-15 10.2% 7.0% % change 2014-15 7.5% 5.1% 2016 $30,564,234 $942,461,242 2016 $83,659 $45,684 % change 2015-16 3.1% 2.9% % change 2015-16 0.5% 0.9% 2017 $32,428,403 $1,004,144,269 2017 $87,092 $47,869 % change 2016-17 6.1% 6.5% % change 2016-17 4.1% 4.8% 2018 $35,080,466 $1,066,446,916 2018 $92,686 $50,070 % change 2017-18 8.2% 6.2% % change 2017-18 6.4% 4.6% Earnings by Place of Work ($000s) Median Income 1990 $1,950,823 $161,135,722 Median Household Income $65,675 $53,267 2000 $4,880,690 $308,751,767 Median Family Income $76,528 $64,312 2010 $7,515,678 $438,991,235 2011 $7,751,079 $450,502,115 Percent in Poverty, 2018 % change 2010-11 3.1% 2.6% All ages in poverty 10.6% 13.7% 2012 $7,918,765 $468,412,894 Under age 18 in poverty 18.5% 20.0% % change 2011-12 2.2% 4.0% Related children age 5-17 in families in poverty 17.4% 18.8% 2013 $8,141,056 $482,900,406 % change 2012-13 2.8% 3.1% Personal Bankruptcy Filing Rate (per 1,000 population) Collier County Florida 2014 $9,101,991 $512,381,351 12-Month Period Ending Jun. 30, 2019 1.13 2.07 % change 2013-14 11.8% 6.1% 12-Month Period Ending Jun. 30, 2020 1.10 1.89 2015 $9,857,860 $545,198,370 State Rank 42 NA % change 2014-15 8.3% 6.4% 2016 $10,435,277 $568,197,880 % change 2015-16 5.9% 4.2% 2017 $10,832,422 $601,927,042 % change 2016-17 3.8% 5.9% 2018 $11,636,423 $634,065,871 Under 65 years 77.4% 83.9% % change 2017-18 7.4% 5.3% Under 19 years 88.3% 92.4% 18 to 64 years 73.5% 80.8% Percent Insured by Age Group Collier County Florida Labor Force Health Insurance Status Average Annual Employment, % of All Industries, 2019 preliminary Employment by Industry Page 2 Collier County Florida Florida Average Annual Wage 2019 preliminary Collier County Collier County Florida Collier County Unemployment Rate Florida NonBusiness Chapter 7 & Chapter 13 Per Capita Personal Income Income and Financial Health Collier County Florida Labor Force as Percent of Population Aged 18 and Older Collier County Florida Personal Income ($000s) Collier County Total - All Revenue Account Codes ($000s) $1,154,613.1 $44,214,365.8 Total - All Expenditure Account Codes ($000s) $1,114,156.12 $41,792,449.68 Per Capita $ $3,143.11 $2,223.20 Per Capita $ $3,032.98 $2,101.42 % of Total 100.0% 100.0% % of Total 100.0% 100.0% Taxes ($000s) $386,814.2 $14,725,283.7 General Government Services** ($000s) $229,885.64 $7,105,044.04 Per Capita $ $1,052.99 $740.42 Per Capita $ $625.80 $357.26 % of Total 33.5% 33.3% % of Total 20.6% 17.0% Permits, Fee, and Special Assessments ($000s) $79,891.6 $2,064,228.9 Public Safety ($000s) $245,213.06 $10,202,428.55 Per Capita $ $217.48 $103.79 Per Capita $ $667.52 $513.00 % of Total 6.9% 4.7% % of Total 22.0% 24.4% Intergovernmental Revenues ($000s) $112,955.9 $4,552,371.7 Physical Environment ($000s) $241,437.92 $4,910,992.05 Per Capita $ $307.49 $228.90 Per Capita $ $657.25 $246.94 % of Total 9.8% 10.3% % of Total 21.7% 11.8% Charges for Services ($000s) $346,083.4 $13,745,670.4 Transportation ($000s) $84,482.64 $5,056,604.18 Per Capita $ $942.12 $691.16 Per Capita $ $229.98 $254.26 % of Total 30.0% 31.1% % of Total 7.6% 12.1% Judgments, Fines, and Forfeits ($000s) $2,374.9 $198,680.9 Economic Environment ($000s) $11,094.17 $1,566,748.75 Per Capita $ $6.47 $9.99 Per Capita $ $30.20 $78.78 % of Total 0.2% 0.4% % of Total 1.0% 3.7% Miscellaneous Revenues ($000s) $48,901.1 $1,189,350.3 Human Services ($000s) $15,937.63 $3,545,609.16 Per Capita $ $133.12 $59.80 Per Capita $ $43.39 $178.28 % of Total 4.2% 2.7% % of Total 1.4% 8.5% Other Sources ($000s) $177,592.0 $7,738,780.0 Culture / Recreation ($000s) $76,356.55 $1,704,980.28 Per Capita $ $483.44 $389.12 Per Capita $ $207.86 $85.73 % of Total 15.4% 17.5% % of Total 6.9% 4.1% Other Uses and Non-Operating ($000s) $199,030.85 $6,807,083.14 Per Capita $ $541.81 $342.28 % of Total 17.9% 16.3% ** (Not Court-Related) Court-Related Expenditures ($000s) $10,717.67 $892,959.54 Per Capita $ $29.18 $44.90 % of Total 1.0% 2.1% Crime rate, 2019 (index crimes per 100,000 population) 1,381.4 2,551.1 Place of Work in Florida Admissions to prison FY 2018-19 237 28,782 Worked outside county of residence 8.3% 17.7% Travel Time to Work 62.9 135.7 Mean travel time to work (minutes) 24.7 27.4 State Highway County-Wide Not County-Wide* Centerline Miles 206.2 12,128.1 County 3.5645 0.5925 Lane Miles 700.7 45,030.3 School 5.0830 State Bridges Municipal 0.5409 Number 218 7,044 Special Districts 0.2637 0.6261 *MSTU included in Not County-Wide "County" category State Facilities Buildings/Facilities (min. 300 Square Feet) Number 75 9,630 Square Footage 431,213 66,989,245 Total (state total includes special districts) 61 3,721 Conservation Land (land acres only) Elementary 30 1,878 State-Owned (includes partially-owned) 245,502 5,383,024 Middle 11 575 % of Total Conservation Land (CL) 28.1% 51.6% Senior High 9 713 % of Total Area Land 19.2% 15.7% Combination 11 555 % of Florida State-Owned CL 4.6% State-Managed 213,697 5,486,474 % of Total Conservation Land (CL) 24.4% 52.6% % HS graduate or higher 86.4% 88.0% % of Total Area Land 16.7% 16.0% % bachelor's degree or higher 36.2% 29.2% % of Florida State-Managed CL 3.9% Admissions to prison per 100,000 population FY 2018-19 State Infrastructure Transportation State and Local Taxation 2019 Ad Valorem Millage Rates Collier County Collier County Florida Workers Aged 16 and Over Collier County Florida Florida Quality of Life Crime Collier County * All County Governments Except Duval - The consolidated City of Jacksonville / Duval County figures are included in municipal totals rather than county government totals. Reported County Government Revenues and Expenditures Florida* Expenditures 2017-18 Revenue 2017-18 Collier County Collier County Florida* Collier County School District Florida Educational attainment Persons aged 25 and older Collier County Florida Prepared by:   Florida Legislature Office of Economic and Demographic Research 111 W. Madison Street, Suite 574 Tallahassee, FL 32399-6588 (850) 487-1402 http://edr.state.fl.us November 2020 Page 3 Education Public Education Schools Traditional Setting (2019-20)