/
Exhibit 1 .  More Adults Exhibit 1 .  More Adults

Exhibit 1 . More Adults - PowerPoint Presentation

min-jolicoeur
min-jolicoeur . @min-jolicoeur
Follow
366 views
Uploaded On 2018-03-08

Exhibit 1 . More Adults - PPT Presentation

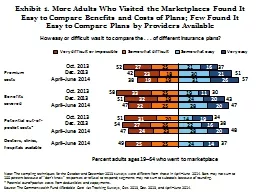
Who Visited the Marketplaces Found It Easy to Compare Benefits and Costs of Plans Few Found It Easy to Compare Plans by Providers Available How easy or difficult was it to compare the ID: 642520

percent adults sum easy adults percent easy sum marketplace care 2014 june april

Share:

Link:

Embed:

Download Presentation from below link

Download Presentation The PPT/PDF document "Exhibit 1 . More Adults" is the property of its rightful owner. Permission is granted to download and print the materials on this web site for personal, non-commercial use only, and to display it on your personal computer provided you do not modify the materials and that you retain all copyright notices contained in the materials. By downloading content from our website, you accept the terms of this agreement.


Presentation Transcript

Slide1

Exhibit 1. More Adults Who Visited the Marketplaces Found It Easy to Compare Benefits and Costs of Plans; Few Found It Easy to Compare Plans by Providers Available

How easy or difficult was it to compare the . . . of different insurance plans?

Percent adults ages 19–64 who went to marketplace

Note: The sampling techniques for the October and December 2013 surveys were different from those in April–June 2014. Bars may not sum to

100 percent because of “don’t know” responses or refusal to respond; segments may not sum to subtotals because of rounding.* Potential out-of-pocket costs from deductibles and copayments. Source: The Commonwealth Fund Affordable Care Act Tracking Surveys, Oct. 2013, Dec. 2013, and April–June 2014.

30

58

37

52

34

51

Benefits covered

Premium costs

Potential out-of-pocket costs*

Somewhat easy

Very easy

Somewhat difficult

Very difficult or impossible

43

5

1

51

42

38

54

47

47

57

38

48

47

49

37

Doctors, clinics, hospitals availableSlide2

Exhibit 2. More Adults Found It Easy to Find Plans They Needed and Could Afford by End of Open EnrollmentPercent adults ages 19–64 who went to marketplace

Note: The sampling techniques for the October and December 2013 surveys were different from those in April–June 2014. Bars may not sum to

100 percent because of “don’t know” responses or refusal to respond; segments may not sum to subtotals because of rounding.Source:

The Commonwealth Fund Affordable Care Act Tracking Surveys, Oct. 2013, Dec. 2013, and April–June

2014.How easy or difficult was it to find . . . ?38

30

56

61

A plan with

the type of coverage you need

A plan you

could afford

Somewhat easyVery easy

Somewhat difficult

Very difficult or impossible

60

36

37

58

46

43

50

54Slide3

Notes: FPL refers to federal poverty level. Bars may not sum to 100 percent because of “don’t know” responses or refusal to respond; segments may not sum to subtotals because of rounding.Source: The Commonwealth Fund Affordable Care Act Tracking Survey, April–June

2014.How easy or difficult was it to

find a plan you could afford?

Percent adults ages 19–64 who went to marketplace

Exhibit 3. More Adults with Lower Incomes Found It Easy to Find an Affordable Plan Than Did Adults with Higher Incomes Somewhat easy

Very easy

Somewhat difficult

Very difficult or impossible

43

49

42

39

36

54

49

52

60

61Slide4

Exhibit 4. More than Three of Five Adults Who Tried to Find Out About Their Eligibility for Financial Assistance or Medicaid Said It Was Easy to Do SoAdults ages 19–64 went to marketplace

Did not try to find out if eligible for financial assistance or Medicaid35%

Don’t know or refused2%

Tried to find out if eligible for financial assistance or Medicaid

63%Did you try to find out if you are either eligible for financial assistance to help pay for your plan, or if you are eligible for Medicaid?

Note: Segments may not sum to 100 percent because of rounding. Source

: The Commonwealth Fund Affordable Care Act Tracking Survey, April–June 2014.

Don’t know

or refused

1%

Very easy33%

How easy or difficult was it to find out if you are eligible for financial assistance or for Medicaid?

Adults

ages 19–64 who went to marketplace and tried to find out

about eligibility for financial assistance

or Medicaid

Somewhat easy30%

Somewhat difficult18%

Very difficult18%Slide5

Notes: Bars may not sum to 100 percent because of “don’t know” responses or refusal to respond; segments may not sum to subtotals because of rounding.Source: The Commonwealth Fund Affordable Care Act Tracking Survey, April–June

2014.Overall, how would you describe your experience in trying to get health insurance

through the marketplace in your state?

Percent adults ages 19–64 who went to marketplace

Exhibit 5. A Majority of Adults Who Visited the Marketplace Rated Their Experience as Fair or PoorGoodExcellent

Fair

Poor

62

52

76

63

55

65

38

47

24

37

44

34Slide6

Adults ages 19–64 who selected a private plan through the marketplace

Exhibit 6. Premiums and Cost Exposure Were the Most Important Factors in Plan Selection

What was the most important factor in your decision about which plan to select?

Note: Segments may not sum to 100 percent because of rounding. * Actual question wording: preferred doctor, health clinic, or hospital included in plan’s network.

Source: The Commonwealth Fund Affordable Care Act Tracking Survey, April–June 2014.Amount of premium38%Amount of deductible and other copayments

34%

Preferred provider* included in network

20%Other

4%

Did not formally select a plan1%

Don’t know or refused4%Slide7

Exhibit 7. Adults with Marketplace Coverage with Incomes Under 250 Percent of Poverty Paid Monthly Premiums Comparable to Those with Employer Coverage

Note: FPL refers to federal poverty level. 250% of the poverty level is $28,725 for an individual or $58,875 for a family of four.

Bars may not sum to 100 percent because of rounding. Source: The Commonwealth Fund Affordable Care Act Tracking Survey,

April–June 2014.

All adultsAdults with incomes below 250% FPLDon’t know or refused

$125 or more

$1 to less than $125

Pays nothing

Percent

adults

ages

19–64 with single policiesSlide8

Exhibit 8. Three of Five Adults with Marketplace Coverage Found It Easy to Pay Their Premiums

Percent adults ages 19–64 who pay all or some of premium

Note: FPL refers to federal poverty level. 250% of the poverty level is $28,725 for an individual or $58,875 for a family of four. Bars may not sum to 100 percent because of “don’t know” responses or refusal to respond; segments may not sum to subtotals because of rounding.

Source: The Commonwealth Fund Affordable Care Act Tracking Survey,

April–June 2014.How easy or difficult is it for you to afford the premium costs for your health insurance?All adultsAdults with incomes below 250% FPLAdults with incomes of 250% FPL or more

Somewhat easy

Very easy

Somewhat difficult

Very difficult or impossible

25

37

38

33

20

44

75

61

62

65

79

54Slide9

Exhibit 9. Adults with Low and Moderate Incomes Who Had Marketplace Coverage Had Deductibles Comparable to Those in Employer Plans

Note: FPL refers to federal poverty level. 250% of the poverty level is $28,725 for an individual or $58,875 for a family of four. Bars may not sum to 100 percent because of

rounding. Source: The Commonwealth Fund Affordable Care Act Tracking Survey, April–June 2014.

Adults with incomes below 250% FPL

Adults with incomes of 250% FPL or morePercent adults ages 19–64

$1,000 or more

$500 to less than $1,000

$1 to less than $500

No deductible

Don’t know or refusedSlide10

Exhibit 10. More Than Two-Thirds of Adults with Marketplace Coverage Rated Their Health Insurance as Excellent, Very Good, or GoodPercent adults

ages 19–64

Note: FPL refers to federal poverty level. 250% of the poverty level is $28,725 for an individual or $58,875 for a family of four. Bars

may not sum to 100 percent because of “don’t know” responses or refusal to respond; segments may not sum to subtotals because of rounding.Source: The Commonwealth Fund Affordable Care Act Tracking Survey,

April–June 2014.Adults with incomes below 250% FPLAdults with incomes of 250% FPL or more7670

91

64

Now thinking about (your current health insurance coverage/all the health insurance you have combined) how would you rate it?

All adults

86

68

12

22

21

20

8

27

Very good

Excellent

Fair

Poor

GoodSlide11

Exhibit 11. A Majority of Adults with Marketplace Coverage Were Confident They Could Afford Care They Needed or Get High-Quality CareHow confident are you that if you become seriously ill you will be

able to . . . ?Note:

Bars may not sum to 100 percent because of “don’t know” responses or refusal to respond; segments may not sum to subtotals because of rounding.Source: The Commonwealth Fund Affordable Care Act Tracking Survey, April–June 2014.

Afford the care you need

Get high-quality care 817060

2

5

84

71

65

36

18

30

38

73

15

27

31

63

Percent adults

ages 19–64

Somewhat confidentVery confident

Not very confident

Not at all confident