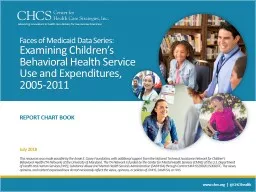
/
Faces of Medicaid Data Series: Faces of Medicaid Data Series:

Faces of Medicaid Data Series: - PowerPoint Presentation

min-jolicoeur
min-jolicoeur . @min-jolicoeur
Follow
351 views
Uploaded On 2018-11-01

Faces of Medicaid Data Series: - PPT Presentation

Examining Childrens Behavioral Health Service Use and Expenditures 20052011 REPORT CHART BOOK July 2018 This resources was made possible by the Annie E Casey Foundation with additional support from the National Technical Assistance Network for Childrens Behavioral Hea ID: 707973

behavioral health care medicaid health behavioral medicaid care children services 2011 service expenditures 2005 children

Share:

Link:

Embed:

Download Presentation from below link

Download Presentation The PPT/PDF document "Faces of Medicaid Data Series:" is the property of its rightful owner. Permission is granted to download and print the materials on this web site for personal, non-commercial use only, and to display it on your personal computer provided you do not modify the materials and that you retain all copyright notices contained in the materials. By downloading content from our website, you accept the terms of this agreement.


Presentation Transcript

Slide1

Faces of Medicaid Data Series: Examining Children’s Behavioral Health Service Use and Expenditures, 2005-2011

REPORT CHART BOOKJuly 2018

This resources was made possible by the Annie E. Casey Foundation, with additional support from the National Technical Assistance Network for Children’s Behavioral Health (TA Network) at the University of Maryland. The TA Network is funded by the Center for Mental Health Services (CMHS) at the U.S. Department of Health and Human Services (HHS), Substance Abuse and Mental Health Services Administration (SAMHSA) through Contract #HHSS280201500007C. The views, opinions, and content expressed here do not necessarily reflect the views, opinions, or policies of CMHS, SAMHSA, or HHS.Slide2

2Since 2005, the Medicaid child population has increased by nearly 12%, yet the number of children receiving behavioral health care has increased by almost 33%.CHART 1. TOTAL POPULATION OF CHILDREN IN MEDICAID COMPARED TO THE TOTAL CHILDREN RECEIVING BEHAVIORAL HEALTH CARE, 2005 - 2011

Children

receiving

behavioral health services

Children receiving

psychotropic

medications

Children receiving

behavioral health care

Children in Medicaid

2005

2008

2011

29.0M

2.79M

30.5M

32.4M

1.96M

2.60M

2.06M

3.62M

2.59M

1.69M

1.84M

2.16M

Source:

Pires

, S., McLean, J., and Allen, K., (2018)

Faces of Medicaid Data Series: Examining Children’s Behavioral Health Service Use and Expenditures, 2005-2011

. Center for Health Care Strategies: Hamilton, NJ

.Slide3

CHART 2. ALL CHILDREN IN MEDICAID USING BEHAVIORAL HEALTH CARE, 2011 (N= 3,617,140)Source: Pires, S., McLean, J., and Allen, K., (2018) Faces of Medicaid Data Series: Examining Children’s Behavioral Health Service Use and Expenditures, 2005-2011

. Center for Health Care Strategies: Hamilton, NJ.

3In 2011, 3.6 million children covered by Medicaid used behavioral health care, and of those children, 2.1 million received psychotropic medications. Of those children receiving these medications, nearly half (47%) received no accompanying behavioral health services.

Using behavioral

health services

N=

2,594,817

Using psychotropic

medication

N=

2,157,045

Behavioral health service

use, no psychotropic medications

N=1,460,095

Behavioral health service use

and

psychotropic medications

N=1,134,722

Psychotropic medications use,

no behavioral health services

N=1,022,323Slide4

CHART 3. CHILDREN USING BEHAVIORAL HEALTH CARE AS A PROPORTION OF TOTAL MEDICAID ENROLLMENT, 2011Source: Pires, S., McLean, J., and Allen, K., (2018) Faces of Medicaid Data Series: Examining Children’s Behavioral Health Service Use and Expenditures, 2005-2011

. Center for Health Care Strategies: Hamilton, NJ.

4Behavioral health accounts for a disproportionate share of Medicaid spending for children, given the relatively small number of children who receive behavioral health care.

Total Children in Medicaid = 32.4MSlide5

CHART 4. MEDICAID ENROLLMENT, BEHAVIORAL HEALTH SERVICE USE, AND EXPENSE BY AID CATEGORY, 2011Source: Pires, S., McLean, J., and Allen, K., (2018) Faces of Medicaid Data Series: Examining Children’s Behavioral Health Service Use and Expenditures, 2005-2011

. Center for Health Care Strategies: Hamilton, NJ.

5Children in foster care and those with SSI/disability eligibility together represent only 8% of the Medicaid child population, but their care accounts for 49% of total behavioral health spending.Slide6

CHART 5. MEDICAID ENROLLMENT, BEHAVIORAL HEALTH SERVICE USE AND EXPENSE BY AGE GROUP, 2011

Source:

Pires, S., McLean, J., and Allen, K., (2018) Faces of Medicaid Data Series: Examining Children’s Behavioral Health Service Use and Expenditures, 2005-2011. Center for Health Care Strategies: Hamilton, NJ.

6

Adolescents, ages 13-18, represent 22% of the overall Medicaid child population, but account for 38% of children in Medicaid using behavioral health services, and nearly 50% of total behavioral health care expenditures.Slide7

CHART 6. USE OF TRADITIONAL BEHAVIORAL HEALTH SERVICES VS. EVIDENCE-BASED SERVICES, 2011Source: Pires, S., McLean, J., and Allen, K., (2018) Faces of Medicaid Data Series: Examining Children’s Behavioral Health Service Use and Expenditures, 2005-2011

. Center for Health Care Strategies: Hamilton, NJ.

7Children in Medicaid are more likely to receive traditional behavioral health services, like outpatient treatment and psychotropic medications, vs. alternative evidence-based approaches.

TRADITIONAL SERVICES

EVIDENCE-BASED SERVICESSlide8

CHART 7. MEDICAID ENROLLMENT AND BEHAVIORAL HEALTH SERVICE USE BY RACE/ETHNICITY, 2011 Source: Pires, S., McLean, J., and Allen, K., (2018) Faces of Medicaid Data Series: Examining Children’s Behavioral Health Service Use and Expenditures, 2005-2011

. Center for Health Care Strategies: Hamilton, NJ.

8Children in Medicaid from racially/ethnically diverse backgrounds are less likely than white children to use behavioral health services.Slide9

CHART 8. COMPARISON OF USE AND EXPENSE FOR CHILDREN’S BEHAVIORAL HEALTH SERVICES IN MEDICAID WITH HIGHEST TOTAL EXPENDITURES, 2011Source: Pires, S., McLean, J., and Allen, K., (2018)

Faces of Medicaid Data Series: Examining Children’s Behavioral Health Service Use and Expenditures, 2005-2011. Center for Health Care Strategies: Hamilton, NJ.9

Residential treatment/therapeutic group care — used by just over 4% of children — account for the largest proportion of expenditures at nearly 22% of total behavioral health expenditures.