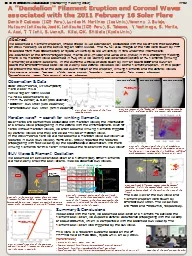
/
Fig1. X-ray light curve of the flare taken by GOES. Fig1. X-ray light curve of the flare taken by GOES.

Fig1. X-ray light curve of the flare taken by GOES. - PowerPoint Presentation

min-jolicoeur
min-jolicoeur . @min-jolicoeur
Follow
410 views
Uploaded On 2016-08-12

Fig1. X-ray light curve of the flare taken by GOES. - PPT Presentation

Abstract We observed a filament eruption whose shape is like a dandelion associated with the solar flare that occurred on 2011 February 16 at the active region NOAA 11158 The H a full disk images of the flare were taken by FMT ID: 444102

wave filament flare euv filament wave euv flare fmt peru waves 2011 filaments observed eruption moreton left oscillation kyoto

Share:

Link:

Embed:

Download Presentation from below link

Download Presentation The PPT/PDF document "Fig1. X-ray light curve of the flare tak..." is the property of its rightful owner. Permission is granted to download and print the materials on this web site for personal, non-commercial use only, and to display it on your personal computer provided you do not modify the materials and that you retain all copyright notices contained in the materials. By downloading content from our website, you accept the terms of this agreement.


Presentation Transcript

Slide1

Fig1. X-ray light curve of the flare taken by GOES.

Abstract

We observed a filament eruption, whose shape is like a dandelion, associated with the solar flare that occurred on 2011 February 16 at the active region NOAA 11158. The H

a

full disk images of the flare were taken by FMT1 relocated from Hida Observatory of Kyoto University to Ica University in Peru under the international collaboration of the CHAIN2-project (see, Morita et al.(M18a) and UeNo et al.(A21a) in this JAS-Spring Meeting). There is no Moreton wave observed in Has, while we identify oscillations/activations of Ha filaments (winking filaments) at distant locations. In the extreme ultraviolet data taken by AIA3 on board SDO4 and EUVI5 on board the STEREO6-Ahead satellite we clearly see coronal waves as well as the filament eruption. In this paper we present the results of the detailed examination of the eruption, winking filaments and the coronal waves.1Flare Monitoring Telescope, 2Continuous H-Alpha Imaging Network, 3Atmospheric Imaging Assembly, 4Solar Dynamic Observatory, 6Extreme-Ultraviolet Imager, 6Solar TErrestrial Relations Observatory

A ''Dandelion'' Filament Eruption and Coronal Waves associated with the 2011 February 16 Solar Flare Denis P. Cabezas (IGP, Peru), Lurdes M. Martínez (Ica Univ.),Yovanny J. Buleje, Mutsumi Ishitsuka, José K. Ishitsuka (IGP, Peru), S. Takasao, Y. Yoshinaga, S. Morita, A. Asai, T. T. Ishii, S. Ueno,R. Kitai, ○K. Shibata (Kyoto Univ.)

Summary & ConclusionsAssociated with the flare, we observed oscillation of a filament. To activate the filament oscillation, we expect a coronal disturbance propagating with the velocity of about 800km/s, which is comparable with the observed EUV velocity. The filament oscillation was triggered by the EUV wave.This work is a research outcome based on the 2nd FMT-WS held at Hida Obs., Kyoto Univ. on July 2011.(References) Harra et al. 2011, ApJL, 737, L4 (CHAIN project) http://www.kwasan.kyoto-u.ac.jp/CHAIN/ (FMT-Peru) http://esi.igp.gob.pe/chain/fmt-peru.html (FMT-WS @Hida) http://www.kwasan.kyoto-u.ac.jp/CHAIN/WS/2011Jul/

Snap shot of the FMT-WS @Hida Obs.

Moreton wave? – search for winking filamentsSolar flares are sometimes associated with Moreton waves, the intersection of a shock wave propagating in the corona with the chromosphere. Even for flares without Moreton waves, we often observe winking filaments triggered by coronal waves and they are called “invisible” Moreton wave.In the 2011-Feb-16 flare we did not observe a Moreton wave but wave-like features in EUVs (EUV waves). Harra et al. (2011) reported the features propagating with fast velocity by the spectroscopic observation. Are there winking filaments for this flare? What about the relation with the EUV wave?

Observation & DataDate: 2011-Feb-16, 14:19UT(Start) Flare class: M1.6Active region: NOAA 11158Full-disk observations by FMT: Ha center, ±0.8A (20s cadence) SDO/AIA: EUV 193A (12s cadence) STEREO/EUVI: EUV 195A (5min cadence)

EUV Waves & Filament OscillationWe observed an activation/oscillation of a filament (S2). Other filaments did not clearly show the oscillations. We also observed EUV waves.

The side view of the EUV wave and filament eruption were taken by STEREO EUVI 195A. The velocities are ~600 and ~250km/s, respectively.

EUV wave front

by AIA (193A)

AIA 193 difference

start of the oscillation

Fig4. Left: wide FOV H

a

image. There are some filaments (S1-S4).

M

iddle: wave front positions, determined by AIA 193A image, are overlaid on an H

a

image.

R

ight

: an example of AIA 193 difference image.

Fig5. Left: temporal evolution of

the oscillated

filament (S2) in the three wavelengths.

Right: light curve of the filament in the three wavelengths. The intensity is calculated for the region with the light blue rectangle in the left panel.

light curve of this region

日本天文学会

2012

年春季年会

(ASJ-Spring Meeting 2012)

A70c

~87°

Fig6. EUV (195A) difference images taken by STEREO-Ahead/EUVI (left). The STEREO-Ahead satellite was located 87 degree ahead of the earth at the time of the flare.

filament

EUV wave

Fig7. Distance-time plot of the EUV wave and

oscillation of filament S2. The GOES X-ray light curve is overlaid.

~

40

0

km/s

*

*

Peru FMT H

a

-0.8A

Peru FMT H

a

+

0.8A

Peru FMT H

a

center

Fig2. H

a

images of the “dandelion” filament eruption taken by FMT-Peru (left: H

a

-0.8A, middle: H

a

center, right Ha+0.8A).

~100km/s

flare

Fig3.

Left: the position of the slit of

Hinode

/EIS. Right: Distant-time diagram of the Doppler velocity for the Fe XIII line along the slit (red/blue: red-/blue-ward movement, respectively).

(

Harra

et al. 2011)