/
Introduction to TK Solver This document begins with a rapid tour of TK Introduction to TK Solver This document begins with a rapid tour of TK

Introduction to TK Solver This document begins with a rapid tour of TK - PDF document

min-jolicoeur
min-jolicoeur . @min-jolicoeur
Follow
385 views
Uploaded On 2016-08-04

Introduction to TK Solver This document begins with a rapid tour of TK - PPT Presentation

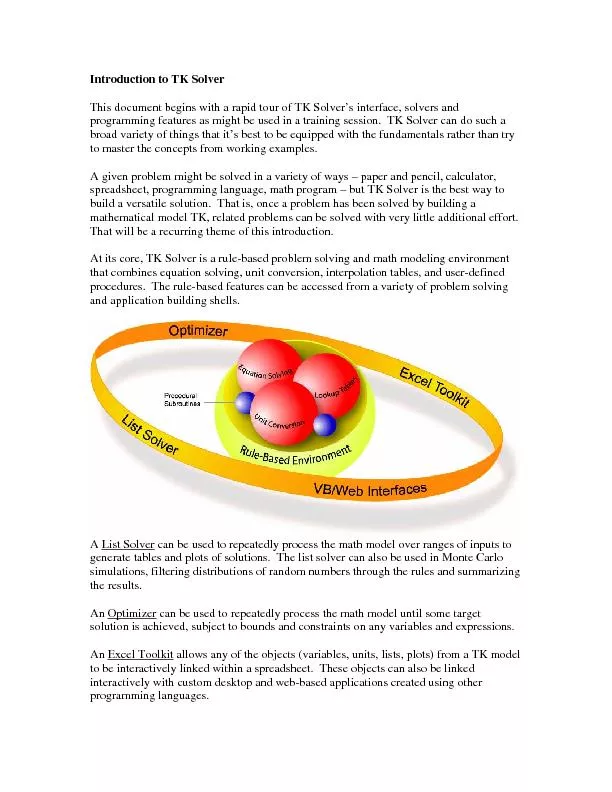
A List Solver e math model over ranges of inputs to simulations filtering distributions of random numbers through the rules and summarizing the results An Optimizer s the math model until some targ ID: 433070

List Solver e math

Share:

Link:

Embed:

Download Presentation from below link

Download Pdf The PPT/PDF document "Introduction to TK Solver This document ..." is the property of its rightful owner. Permission is granted to download and print the materials on this web site for personal, non-commercial use only, and to display it on your personal computer provided you do not modify the materials and that you retain all copyright notices contained in the materials. By downloading content from our website, you accept the terms of this agreement.


Presentation Transcript

Introduction to TK Solver This document begins with a rapid tour of TK Solver’s interface, solvers and programming features as mightthe fundamentals rather than try to master the concepts from working examples. A given problem might be solved in a varietspreadsheet, programming language, math programbuild a versatile solution. mathematical model TK, related problems can be solved with very little additional effort. That will be a recurring theme of this introduction. At its core, TK Solver is a rule-based problem solving and math modeling environment that combines equation solving, unit conversi accessed from a variety of problem solving A List Solver e math model over ranges of inputs to simulations, filtering distributions of random numbers through the rules and summarizing the results. An Optimizer s the math model until some target , units, lists, plots) from a TK model to be interactively linked within a spreadsheet. These objects can also be linked interactively with custom desktop and weprogramming languages. You can also access an object’s properties directly from the worksheets, holding both the ects in a model via the Object Bar. From the left, the Object Bar icons access definitions, and format definitions. The Object Bar also provides quick access to existing plots, tables and comments. Use the Navigation Bar to access TK sheets and create new objects. Use the Object Bar to access existing objects. When you type information into a TK sheet, TK goes into “edit mode”. You see a single entry point. During this time, many of the icons and functionality of TK’s interface are inaccessible. You will see that the icons become When you have completed entry of the information in a particular field, the blinking cursor disappears and the current field is completely highlighted. You are now in “navigation mode”. When you are in navigation mode you have free access to all the icons, menus and interface functionality. TK Solver is a “it” full of many solvers that direction. Here is a list of those solvers. Direct Solver Procedure Processor that allows for solving problems in a performing summations or products, etc. algorithms to a TK model. Given an inputXYZ with the cosines of each of the 100 intermediate values of s. lues of s. ()Next I Suppose we need the output of this procedure to be 2.75 and we need to know the value of C required to make that happen. The Iterative Solver handles it easily. Some TK built-in functions automatically gene. For example, TK Wizard to help set up the differential equatiative Solver can be used to backsolve these integrators to achieve desired results. Here is TK’s solution to the following 2 y1-= 0 2 4 6 8 10 12 14 16 18 20 -3 -2 -1 0 1 2 3Solution 1 Element ….. List Solver that will repeatedly run the entire math model, using lists is one way to generate tables and plots of results. The List Solver can be set up maof a Wizard. The List Solver will call on the Direct and Iterative Solvers at each step of TK rules used to solve fluid flow problems. density(),'T,'Pviscosity(),'T,'P =V4q D2 =NReVD density viscosity =1f 4- 44.4D NRef +log =deltapL fdensity V2 16.085 Here is a plot of the pressure drop vs. the tube diameter. Let’s begin with some practice with the interface. Launch the program. 1. The toolbar automates several of the menu commands. You can see “tool tips” by 2. The Navigation Bar provides fast access to the various sheets. Double click on a sheet name to open it. Sheets can be minimized or maximized by clicking on the icons in the 3. Open the Plot Sheet. Enter p1 in the name column. FACT: TK sheets can hold up to 32,000 objects if necessary! Sheet and try to enter 2ndplot. When you try message. 2ndplot is an invalid name. 6. Click the Context-Sensitive Help button. In this case, TK displays complete information about how to enter names, what characters are valid in names, and other related information. You can also search for other Help topics. When you are finished 7. Press Esc to remove your entry or edit the name so TK can accept it. 8. Press Home to move to the top of the Plot Sheet. Home and End move you to the top and bottom of a sheet. 9. Move the cursor to the Plot Type columAt this point, you have a Line Chart named p1 but you don't have any contents for it yet (data, labels, scales, etc.). 1. Click the right mouse button or press abc as the X-Axis List name. TK created the object automatically on the List 3. Open the subsheet for the list abc (CTRL-D or right mouse click on the list name in subsheet. Enter 1, then cursor down and enteheading. The element column automaticallyon. Most sheets don’t have line numbers, howevgardless of where you are in the program. enter xyz as the name of the Y-Axis List. then close the subsheet. m m 14. These are the same values we entered earlier. Let's add another data point to our h row in the abc list and enter tor in every TK input field. C16. Pull down the Window menu and select . This will help you see all the n. You might also try the 17. Close all the Windows using the Windows Menu. you the trouble of finding and opening individual sheets. It also helps keep the interface from getting too cluttered when you’re working with many different types of objects. Sheet. Highlight the first plot name, View MenuProperties click the right mouse button. Click move from object to object. Element 1 1.5 2 2.5 3 3.5 4 4.5 5 5.5 6 0 10 20 30 40 50 60 70 80 90