/
Morans Autocorrelation Coecient in Comparative Methods Emmanuel Paradis December   This Morans Autocorrelation Coecient in Comparative Methods Emmanuel Paradis December   This

Morans Autocorrelation Coecient in Comparative Methods Emmanuel Paradis December This - PDF document

min-jolicoeur
min-jolicoeur . @min-jolicoeur
Follow
497 views
Uploaded On 2014-12-11

Morans Autocorrelation Coecient in Comparative Methods Emmanuel Paradis December This - PPT Presentation

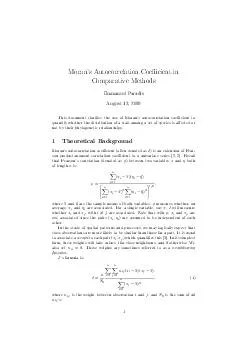
1 Theoretical Background Morans autocorrelation coe64259cient often denoted as is an extension of Pear son productmoment correlation coe64259cient to a univariate series 2 5 Recall that Pearsons correlation denoted as between two variables and bot ID: 22325

Theoretical Background Morans

Share:

Link:

Embed:

Download Presentation from below link

Download Pdf The PPT/PDF document "Morans Autocorrelation Coecient in Compa..." is the property of its rightful owner. Permission is granted to download and print the materials on this web site for personal, non-commercial use only, and to display it on your personal computer provided you do not modify the materials and that you retain all copyright notices contained in the materials. By downloading content from our website, you accept the terms of this agreement.


Presentation Transcript

Moran'sAutocorrelationCoecientinComparativeMethodsEmmanuelParadisAugust12,2020Thisdocumentclari estheuseofMoran'sautocorrelationcoecienttoquantifywhetherthedistributionofatraitamongasetofspeciesisa ectedornotbytheirphylogeneticrelationships.1TheoreticalBackgroundMoran'sautocorrelationcoecient(oftendenotedasI)isanextensionofPear-sonproduct-momentcorrelationcoecienttoaunivariateseries[2,5].RecallthatPearson'scorrelation(denotedas)betweentwovariablesxandybothoflengthnis:=nXi=1(xi�x)(yi�y) "nXi=1(xi�x)2nXi=1(yi�y)2#1=2;wherexandyarethesamplemeansofbothvariables.measureswhether,onaverage,xiandyiareassociated.Forasinglevariable,sayx,Iwillmeasurewhetherxiandxj,withi6=j,areassociated.Notethatwith,xiandxjarenotassociatedsincethepairs(xi;yi)areassumedtobeindependentofeachother.Inthestudyofspatialpatternsandprocesses,wemaylogicallyexpectthatcloseobservationsaremorelikelytobesimilarthanthosefarapart.Itisusualtoassociateaweighttoeachpair(xi;xj)whichquanti esthis[3].Initssimplestform,theseweightswilltakevalues1forcloseneighbours,and0otherwise.Wealsosetwii=0.Theseweightsaresometimesreferredtoasaneighbouringfunction.I'sformulais:I=n S0nXi=1nXj=1wij(xi�x)(xj�x) nXi=1(xi�x)2;(1)wherewijistheweightbetweenobservationiandj,andS0isthesumofallwij's:1 S0=nXi=1nXj=1wij:Quitenotsointuitively,theexpectedvalueofIunderthenullhypothesisofnoautocorrelationisnotequaltozerobutgivenbyI0=�1=(n�1).TheexpectedvarianceofI0isalsoknown,andsowecanmakeatestofthenullhypothesis.IftheobservedvalueofI(denoted^I)issigni cantlygreaterthanI0,thenvaluesofxarepositivelyautocorrelated,whereasif^II0,thiswillindicatenegativeautocorrelation.Thisallowsustodesignone-ortwo-tailedtestsinthestandardway.Gittleman&Kot[4]proposedtouseMoran'sItotestfor\phylogenetice ects".Theyconsideredtwowaystocalculatetheweightsw:ˆWithphylogeneticdistancesamongspecies,e.g.,wij=1=dij,wheredijaredistancesmeasuredonatree.ˆWithtaxonomiclevelswherewij=1ifspeciesiandjbelongtothesamegroup,0otherwise.Notethatinthe rstsituation,therearequitealotofpossibilitiestosettheweights.Forinstance,Gittleman&Kotalsoproposed:wij=1=d ijifdijcwij=0ifdij&#x-390;c;wherecisacut-o phylogeneticdistanceabovewhichthespeciesareconsideredtohaveevolvedcompletelyindependently,and isacoecient(see[4]fordetails).Byanalogytotheuseofaspatialcorrelogramwherecoecientsarecalculatedassumingdi erentsizesofthe\neighbourhood"andthenplottedtovisualizethespatialextentofautocorrelation,theyproposedtocalculateIatdi erenttaxonomiclevels.2ImplementationinapeFromversion1.2-6,apehasfunctionsMoran.Iandcorrelogram.formulaim-plementingtheapproachdevelopedbyGittleman&Kot.Therewasanerrorinthehelppagesof?Moran.I(correctedinver.2.1)wheretheweightswerereferredtoas\distanceweights".Thishasbeenwronglyinterpretedinmybook[6,pp.139{142].Theanalysesbelowaimtocorrectthis.2.1PhylogeneticDistancesThedata,takenfrom[1],arethelog-transformedbodymassandlongevityof vespeciesofprimates:&#x-390;body-c(4.09434,3.61092,2.37024,2.02815,-1.46968)ကlongevity-c(4.74493,3.3322,3.3673,2.89037,2.30259)ကnames(body)-names(longevity)-c("Homo","Pongo","Macaca","Ateles","Galago")2 Thetreehasbranchlengthsscaledsothattherootageisone.Wereadthetreewithape,andplotit:�library(ape)�trnwk-"((((Homo:0.21,Pongo:0.21):0.28,Macaca:0.49):0.13,Ateles:0.62)"ကtrnwk[2]-":0.38,Galago:1.00);"ကtr-read.tree(text=trnwk)ကplot(tr)ကaxisPhylo() Wechoosetheweightsaswij=1=dij,wherethed'sisthedistancesmeasuredonthetree:�w-1/cophenetic(tr)ကwHomoPongoMacacaAtelesGalagoHomoInf2.38095241.02040820.80645160.5Pongo2.3809524Inf1.02040820.80645160.5Macaca1.02040821.0204082Inf0.80645160.5Ateles0.80645160.80645160.8064516Inf0.5Galago0.50000000.50000000.50000000.5000000InfOfcourse,wemustsetthediagonaltozero:ကdiag(w)-0WecannowperformtheanalysiswithMoran'sI:3 �Moran.I(body,w)$observed[1]-0.07312179$expected[1]-0.25$sd[1]0.08910814$p.value[1]0.04714628Notsurprisingly,theresultsareoppositetothosein[6]since,there,thedistances(givenbycophenetic(tr))wereusedasweights.(Notethattheargumentdisthasbeensincerenamedweight.1)Wecannowconcludeforaslighlysigni cantpositivephylogeneticcorrelationamongbodymassvaluesforthese vespecies.ThenewversionofMoran.Igainstheoptionalternativewhichspeci esthealternativehypothesis("two-sided"bydefault,i.e.,H1:I6=I0).Asexpectedfromtheaboveresult,wedividetheP-valuebetwoifwede neH1asI�I0:�Moran.I(body,w,alt="greater")$observed[1]-0.07312179$expected[1]-0.25$sd[1]0.08910814$p.value[1]0.02357314Thesameanalysiswithlongevitygives:�Moran.I(longevity,w)$observed[1]-0.1837739$expected[1]-0.25 1Theoldercodewasactuallycorrect;nevertheless,ithasbeenrewritten,andisnowmuchfaster.Thedocumentationhasbeenclari ed.Thefunctioncorrelogram.phylo,whichcomputedMoran'sIforatreegivenasargumentusingthedistancesamongtaxa,hasbeenremoved.4 $sd[1]0.09114549$p.value[1]0.4674727Asforbody,theresultsarenearlymirroredcomparedto[6]whereanon-signi cantnegativephylogeneticcorrelationwasfound:itisnowpositivebutstilllargelynotsigni cant.2.2TaxonomicLevelsThefunctioncorrelogram.formulaprovidesaninterfacetocalculateMoran'sIforoneorseveralvariablesgivingaseriesoftaxonomiclevels.Anexampleofitsusewasprovidedin[6,pp.141{142].Thecodeofthisfunctionhasbeensimpli ed,andthegraphicalpresentationoftheresultshavebeenimproved.correlogram.formula'smainargumentisaformulawhichis\sliced",andMoran.Iiscalledforeachoftheseelements.Twothingshavebeenchangedfortheend-useratthislevel:1.Intheoldversion,therhsoftheformulawasgivenintheorderofthetaxonomichierarchy:e.g.,Order/SuperFamily/Family/Genus.Notre-spectingthisorderresultedinanerror.Inthenewversion,anyorderisaccepted,buttheordergivenisthenrespectedwhenplottedthecorrelo-gram.2.Variabletransformations(e.g.,log)wereallowedonthelhsoftheformula.Becauseofthesimpli cationofthecode,thisisnomorepossible.Soitistheresponsibilityoftheusertoapplyanytranformationbeforetheanalysis.FollowingGittleman&Kot[4],theautocorrelationatahigherlevel(e.g.,family)iscalculatedamongspeciesbelongingtothesamecategoryandtodif-ferentcategoriesatthelevelbelow(genus).Toformalizethis,letuswritethedi erentlevelsasX1=X2=X3=:::=XnwithXnbeingthelowestone(Genusintheaboveformula):wij=1ifXki=XkjandXk+1i6=Xk+1jwij=0otherwiseknwij=1ifXki=Xkjwij=0otherwisek=nThisisthusdi erentfromtheideaofa\neighbourhood"ofdi erentsizes,butrathersimilartotheideaofpartialcorrelationwherethein uenceofthelowestlevelisremovedwhenconsideringthehighestones[4].Torepeattheanalysesonthecarnivoradataset,we rstlog10-transformthevariablesmeanbodymass(SW)andthemeanfemalebodymass(FW):&#x-278;data(carnivora)&#x-278;carnivora$log10SW-log10(carnivora$SW)ကcarnivora$log10FW-log10(carnivora$FW)5 We rstconsiderasinglevariableanalysis(asin[6]):�fm1.carn-log10SW~Order/SuperFamily/Family/Genusကco1-correlogram.formula(fm1.carn,data=carnivora)ကplot(co1) Alegendnowappearsbydefault,butcanberemovedwithlegend=FALSE.Mostoftheappearanceofthegraphcanbecustomizedviatheoptionoftheplotmethod(see?plot.correlogramfordetails).ThisisthesameanalysisthantheonedisplayedonFig.6.3of[6].Whenasinglevariableisgiveninthelhsincorrelogram.formula,anobjectofclass"correlogram"isreturnedasabove.Ifseveralvariablesareanalysedsimultaneously,theobjectreturnedisofclass"correlogramList",andthecorrelogramscanbeplottedtogetherwiththeappropriateplotmethod:�fm2.carn-log10SW+log10FW~Order/SuperFamily/Family/Genusကco2-correlogram.formula(fm2.carn,data=carnivora)ကprint(plot(co2))6 Bydefault,latticeisusedtoplotthecorrelogramsonseparatepanels;usinglattice=FALSE(actuallythesecondargument,see?plot.correlogramList)makesastandardgraphsuperimposingthedi erentcorrelograms:�plot(co2,FALSE)7 Theoptionsareroughlythesamethanabove,butdonothavealwaysthesamee ectsincelatticeandbasegraphicsdonothavethesamegraphicalpa-rameters.Forinstance,legend=FALSEhasnoe ectiflattice=TRUE.3Implementationinade4Theanalysisdonewithade4in[6]su ersfromthesameerrorthantheonedonewithMoran.Isinceitwasalsodonewithadistancematrix.SoIcorrectthisbelow:�library(ade4)�gearymoran(w,data.frame(body,longevity))class:krandtestMonte-CarlotestsCall:as.krandtest(sim=matrix(res$result,ncol=nvar,byr=TRUE),obs=res$obs,alter=alter,names=test.names)Testnumber:2Permutationnumber:999Alternativehypothesis:greaterTestObsStd.ObsPvalue1body-0.062567892.15233420.0012longevity-0.229904370.34614140.414otherelements:NULL8 Theresultsarewhollyconsistentwiththosefromape,buttheestimatedcoecientsaresubstantiallydi erent.Thisisbecausethecomputationalmeth-odsarenotthesameinbothpackages.Inade4,theweightmatrixis rsttransformedasarelativefrequencymatrixwith~wij=wij=S0.Theweightsarefurthertransformedwith:pij=~wij�nXi=1~wijnXj=1~wij;withpijbeingtheelementsofthematrixdenotedasP.Moran'sIis nallycomputedwithxTPx.Inape,theweightsare rstrow-normalized:wij.nXi=1wij;theneq.1isapplied.Anotherdi erencebetweenbothpackages,thoughlessimportant,isthatinade4theweightmatrixisforcedtobesymmetricwith(W+WT)=2.Inape,thismatrixisassumedtobesymmetric,whichislikelytobethecaselikeintheexamplesabove.4OtherImplementationsPackagesphasseveralfunctions,includingmoran.test,thataremorespeci -callytargetedtotheanalysisofspatialdata.Packagespatialhasthefunctioncorrelogramthatcomputesandplotsspatialcorrelograms.AcknowledgementsIamthankfultoThibautJombartforclari cationsonMoran'sI.References[1]J.M.Cheverud,M.M.Dow,andW.Leutenegger.Thequantitativeas-sessmentofphylogeneticconstraintsincomparativeanalyses:sexualdimor-phisminbodyweightamongprimates.Evolution,39:1335{1351,1985.[2]A.D.Cli andJ.K.Ord.SpatialAutocorrelation.Pion,London,1973.[3]A.D.Cli andJ.K.Ord.Spatialandtemporalanalysis:autocorrelationinspaceandtime.InE.N.WrigleyandR.J.Bennett,editors,Quantita-tiveGeography:ABritishView,pages104{110.Routledge&KeganPaul,London,1981.[4]J.L.GittlemanandM.Kot.Adaptation:statisticsandanullmodelforestimatingphylogenetice ects.SystematicZoology,39:227{241,1990.[5]P.A.P.Moran.Notesoncontinuousstochasticphenomena.Biometrika,37:17{23,1950.[6]E.Paradis.AnalysisofPhylogeneticsandEvolutionwithR.Springer,NewYork,2006.9