/
This Fact Sheet presents highlights from the AARP Public Policy Instit This Fact Sheet presents highlights from the AARP Public Policy Instit

This Fact Sheet presents highlights from the AARP Public Policy Instit - PDF document

min-jolicoeur
min-jolicoeur . @min-jolicoeur
Follow
479 views
Uploaded On 2015-08-18

This Fact Sheet presents highlights from the AARP Public Policy Instit - PPT Presentation

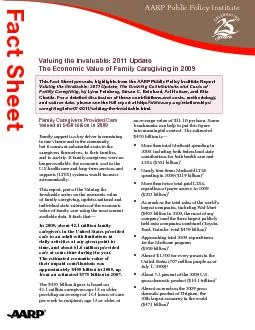
Valuing the Invaluable 2011 Update The Economic Value of Family Caregiving in 2009 Valued at 450 Family support is a key driver in remaining in onex2019s home and in the community million provi ID: 109668

Valuing the Invaluable: 2011 Update The

Share:

Link:

Embed:

Download Presentation from below link

Download Pdf The PPT/PDF document "This Fact Sheet presents highlights from..." is the property of its rightful owner. Permission is granted to download and print the materials on this web site for personal, non-commercial use only, and to display it on your personal computer provided you do not modify the materials and that you retain all copyright notices contained in the materials. By downloading content from our website, you accept the terms of this agreement.


Presentation Transcript

This Fact Sheet presents highlights from the AARP Public Policy Institute Report Valuing the Invaluable: 2011 Update, The Growing Contributions and Costs of , by Lynn Feinberg, Susan C. Reinhard, Ari Houser, and Rita and source data, please see the full report at http://www.aarp.org/relationships/caregiving/info-07-2011/valuing-the-invaluable.html. Valuing the Invaluable: 2011 Update The Economic Value of Family Caregiving in 2009 Valued at $450 Family support is a key driver in remaining in one’s home and in the community, million provided care at some time during the year. their unpaid contributions was approximately $450 from an estimated $375 per week to recipients age 18 or older, at an average value of $11.16 per hour. Some into meaningful context. The estimated LTSS ($361 billion) Nearly four times Medicaid LTSS spending in 2009 ($119 billion) More than twice total paid LTSS, regardless of payer source, in 2009 ($203 billion) As much as the total sales of the world’s largest companies, including Wal-Mart ($408 billion in 2009, the most of any company) and the three largest publicly held auto companies combined (Toyota, Ford, Daimler: total $43 billion) Approaching total 2009 expenditures for the Medicare program ($509 billion) Almost $1,500 for every person in the United States (307 million people as of July 1, 2009) About 3.2 gross domestic product ($14.1 trillion) Almost as much as the 2009 gross domestic product of Belgium, the 20th largest economy in the world ($471 billion) Fsut2ehwwtAARP Public Policy Institute Valuing the Invaluable 2011 Update: The Economic Value of Family Caregiving in 2009 Value of Family Caregivingis population. However, caregiving re�ecting differences in the age structure economic factors. There is also signi�cant among states. Table 1 presents estimates value per hour, hours of care provided, Table 2 compares the total economic value of caregiving to three measures in each state: total Medicaid, LTSS, and home and community-based services (HCBS) spending. Medicaid LTSS spending includes the cost of nursing home care, as well as payments for home care and services provided in assisted living. State-to-state variation in these ratios is mostly due to variation in state Medicaid spending. Total Medicaid spending ranges from less York and the District of Columbia.States differ even more dramatically in Medicaid spending for LTSS, from about exceeded total Medicaid LTSS spending Compared to Medicaid HCBS spending, the economic value of family caregiving was at least twice as high in all states, and more than six times as high in 40 states. Medicaid Long Term Care Expenditures FY 2009 (Cambridge, MA: Thomson Reuters, 2010).www.hcbs.org/moreInfo.php/doc/3325Managed Long-Term Services and Supports Expenditures. (Cambridge, MA: Thomson Reuters2011), http://www.hcbs.org/moreInfo.php/C. O’Shaughnessy, “National Spending for Long-Term Services and Supports (LTSS),” , March 15, 2011.http://www.forbes.com/lists/2010/18/ Medicare Trustees Reporthttps://www.cms.gov/ReportsTrustFunds/downloads/tr2010.pdf.Program, Annual Estimates of the Resident and Puerto Rico: April 1, 2000 to July 1, 2009(NST-EST2009-01), http://www.census.gov/7 U.S. Department of Commerce, Bureau of Economic Analysis, NIPA table 1.1.5, 2009-A. http://www.bea.gov/national/nipaweb/TableView.asp?SelectedTable=5&ViewSeries=NO&Java=no&Request3Place=N&3Place=N&FromView=YES&Freq=Year&FirstYear=2009&LastYear=2009&3Place=N&Update=Update&JavaBox=no#Mid 8 The World Bank, http://data.worldbank.org/indicator/NY.GDP.MKTP.CD? Accessed May 4, 2011.Eiken, Sredl, Burwell, and Gold, Medicaid Long Term Care Expenditures FY 2009; Kasten, Eiken, and Burwell, Medicaid Managed Long-Term Services and Supports Expenditures. In this report, LTSS and HCBS spending includes home health services. Fact Sheet 229, June, 2011 AARP Public Policy Institute, 601 E Street, NW, Washington, DC 20049 www.aarp.org/ppi ppi@aarp.org © 2011, AARP. Reprinting with permission only. Valuing the Invaluable 2011 Update: The Economic Value of Family Caregiving in 2009 Table 1Number of Caregivers and the Economic Value of Caregiving, by State, 2009 Total State Total Value/Total Value $11.50 $11.93 711,000$11.77 $11.70 $11.83 $11.66 $11.03 2,110,000$11.23 $11.16 $11.48 $11.59 $11.25 New York$11.85 $11,700$11.68 11,500,000$11.03 $11.27 Tennessee$11,000Texas$11.37 VermontVirginia$11,700WashingtonWest VirginiaWisconsin$11.49 Wyoming$11.16 Source: Lynn Feinberg, Susan C. Reinhard, Ari Houser, and Rita Choula, Valuing the Invaluable: 2011 Update, The Growing Contributions , Insight on the Issues #51 (Washington, DC: AARP Public Policy Institute, June 2011). Valuing the Invaluable 2011 Update: The Economic Value of Family Caregiving in 2009 Table 2Ratio of Economic Value of Caregiving to Medicaid Spending, by State, 2009 Ratio of Economic Value of Caregiving toTotal Medicaid Medicaid LTSS 11.911.6 New York11.0TennesseeTexas11.4VermontVirginiaWashingtonWest VirginiaWisconsinWyomingMedicaid Long Term Care Expenditures FY 2009 (Cambridge, MA: Thomson Reuters, 2010); and J. Kasten, S. Eiken, and B. Burwell, Medicaid Managed Long-Term (Cambridge, MA: Thomson Reuters, 2011). In these calculations, LTSS and HCBS Fsut2ehwwt