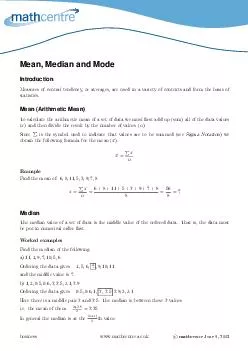
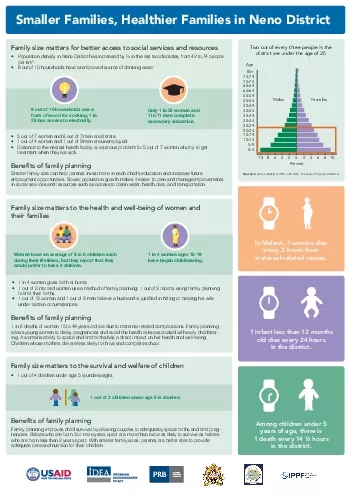
/
4.1 Ideal family size for men by background characteristics Mean ideal 4.1 Ideal family size for men by background characteristics Mean ideal

4.1 Ideal family size for men by background characteristics Mean ideal - PDF document

mitsue-stanley
mitsue-stanley . @mitsue-stanley
Follow
438 views
Uploaded On 2017-02-22

4.1 Ideal family size for men by background characteristics Mean ideal - PPT Presentation

Currently married men Education Ctnrenfly Type of union married Age group Residence Second Number of children women ary or Monog Country 3039 4049 5059 60 Urban Rural None Primary higher amy Po ID: 518455

Currently married men Education Ctn'renfly

Share:

Link:

Embed:

Download Presentation from below link

Download Pdf The PPT/PDF document "4.1 Ideal family size for men by backgro..." is the property of its rightful owner. Permission is granted to download and print the materials on this web site for personal, non-commercial use only, and to display it on your personal computer provided you do not modify the materials and that you retain all copyright notices contained in the materials. By downloading content from our website, you accept the terms of this agreement.


Presentation Transcript

4.1 Ideal family size for men by background characteristics Mean ideal family size preference among currently married men by age, residence, education, type of union and number of children, and among currently married women, Demographic and Health Surveys, 1987-1993 Currently married men Education Ctn'renfly Type of union married Age group Residence Second- Number of children women ary or Monog- Country 30-39 4049 50-59 60+ Urban Rural None Primary higher amy Polygyny 0 1-2 34 5+ Total Total West Africa Burkina Faso 6.1 6.7 8.0 8.6 I 1.0 4.9 8.4 8.6 5.6 3.7 6.9 9.9 6.0 6.3 7.6 9.4 7.8 5.9 Cameroon 8.8 9.5 11.9 13.5 16.6 9.4 12.3 15.3 9.3 6.8 9.8 16.1 8.1 9.3 10.6 13.2 11.2 7.3 Ghana (1988) 6.0 6.7 8.2 9.5 II.1 6.0 8.1 10.4 6.3 5.2 6.8 10.5 6.5 6.2 6.6 9.2 7.6 5.5 Ghana (1993) 4.3 5.1 5.5 6.5 NA 4.1 5.8 7.5 4.7 3.9 5.0 6.7 4.2 4.4 5.2 6.5 5.3 4.7 Mali U U U U U U U U U U U U U U U U U U Niger 10.7 11.6 13.8 t4.2 15.2 11.9 12.8 13.0 11.0 6.9 11.9 15.5 9.3 10.6 12.1 15.9 12.6 8.5 Senegal 8.0 8.9 10.7 11.9 12.1 7.8 11.8 11.7 8.2 5.5 9.0 13.1 6.4 8.0 9.8 12.3 10.4 6.3 East Africa Bumndi 4.7 5.4 6.3 5.7 7.0 4.3 5.5 5.7 5.4 4.1 5.3 7.3 5.2 4.6 5.3 6.7 5.5 5.5 Kenya (1989) 3.9 4.5 4.5 5.3 7.7 4.0 4.9 7.1 4.5 4.1 4.3 6.7 3.9 3.8 4.3 5.3 4.8 4.8 Kenya (1993) 3.8 4.0 4.1 5.0 NA 3.5 4.3 6.0 4.2 3.5 3.9 5.5 3.5 3.6 3.9 4.4 4.1 3.9 Malawi 4.6 5.3 6.3 6.4 NA U U 5.7 5.5 4.7 5.3 7.4 4.3 4.7 5.1 6.9 5.4 5.3 Rwanda 4.2 4.1 4.2 4.6 6.2 3.7 4.3 4.5 4.2 4.0 4.1 5.7 4.0 4.0 4.1 4.7 4.3 4.4 Tanzania 6.5 6.4 8.9 8.5 7.1 6.0 7.9 9.6 7.1 4.7 7.1 9.5 5.6 6.4 7.2 8.8 7.4 6.4 North Aki~ E~pt 2.9 3.1 3.6 3.7 5.0 3.1 3.6 3.9 3.3 3.0 3.3 5.1 2.9 2.7 3.2 4.4 3.3 2.8 Morocco 3.2 3.6 4.3 4.8 5.0 3.6 4.4 4.5 3.8 3.1 4.1 4.5 2.9 3.2 3.9 4.9 4.1 3.9 Bangladesh 2.3 2.4 2,6 2,6 2.9 2.3 2.5 2.6 2.5 2.3 2.5 2.9 2.2 2.3 2.5 2.8 2.5 2.5 Pakistan 4.2 4.0 4.5 4.3 4.3 4.0 4.3 4.4 4.7 3.8 4.2 4.6 4.3 4.0 4.0 4.5 4.2 4.1 NA = Not applicable U = Unknown (not available) tO than urban men. The effect of education also is strongest in West Africa. Surveys in West African countries found that men with no formal education desire at least twice as many children as those with secondary or higher education. In East Africa, North Africa, and Asia, the differ- ences in IFS by educational level are far smaller, except in Kenya and Tanzania. Table 4.2 examines ideal family size among currently married women. Overall, women in West Africa report fer- tility desires that are slightly higher than those of women in East Africa. Women's fertility preferences are lowest in North Africa and Asia. In almost every country, ideal family size increases with the woman's age and the number of her surviving children. Women who live in urban areas, are educated, and are in a monogamous union desire smaller families than their rural, uneducated, and polygynously married peers. Women's fertility desires, like men's, vary more widely in West Africa than in other regions across all the background characteristics examined. Figure 4.1 and the last columns of Table 4.1 compare mean IFS for currently married men and women. Ideal fami- ly size in West Africa is higher for both men and women than in any other region, and the differences between men and women are also much more pronounced there. Men in the West African countries reportedly, on average, desire two (Burkina Faso) to four (Niger and Senegal) children more than women. The second Ghana survey, which found a difference of just 0.6 children, is the exception. In East Af- rica, there is no difference in the fertility desires of men and women, except in Tanzania where men want, on average, one child more than women. The difference between men's and women's fertility desires is extremely small in North Africa and almost nonexistent in Asia. Background characteristics do not account for the dis- parities between men's and women' s fertility desires. When men and women with similar background characteristics are compared, men still want more childrenthan women and the differences are greatest in West Africa. Thus, monogamous- 4.2 Ideal family size for women by background characteristics Mean ideal family size preference among currently married women by age. residence, education, type of union and number of children. Demographic and Health Surveys, 1987-1993 Country Education Type of union Age group Residence Second- Number of children ary or Monog- Polyg- 20-29 30-39 40-49 Urban Rural None Primary higher amy yny 0 I-2 3-4 5+ Total West Faso 5.8 5.6 6.0 6.7 4.5 6.3 6.2 4.8 3.6 5.6 6.2 5.5 5.6 5.9 6.5 5.9 Cameroon 6.9 6.8 7.7 8.5 6.3 8.0 8.9 6.5 5.0 6.9 8.0 6.6 6.8 7.5 8.1 7.3 Ghana (1988) 5.2 5.2 5.6 6.3 4,9 5.8 6.5 4.9 4.1 5.4 5.8 5.3 5.1 5.6 6.0 5.5 Ghana (1993) 4.2 4.4 4.9 5.3 4.0 5.1 5.6 4.2 3.7 4.6 5.1 4.4 4,2 4.8 5.4 4.7 Mali 6.7 6.6 7.2 7.5 5.6 7.3 7.2 5.9 4.0 7.0 6.9 6.2 6.8 6.8 7.6 6.9 Niger 7.6 8.2 9,0 9.3 7.1 8.7 8.7 7.2 5.0 8.5 8.6 7.3 7.9 8.8 9.6 8.5 Senegal 6.2 6.2 6.3 6.5 5.2 6.9 6.6 5.2 4.4 6.1 6,5 5,9 6.0 6.4 6.6 6.3 East 4.7 5.2 5.8 5.8 4.4 5.6 5.6 5.1 4.4 5.5 5.7 5.3 5.0 5.6 6.1 5.5 Kenya (1989) 4.3 4.4 5.0 5.5 4.0 5,0 5.6 4.7 3.9 4.7 5.3 4.4 4.1 4.6 5.4 4.8 Kenya (1993) 4.0 3.7 4.1 4.2 3.1 4.1 5.0 3.8 3.2 3.8 4.4 4.0 3.5 3.8 4.3 3.9 Malawi 4.5 4.7 5.6 6.4 U U 5.5 5.I 4.3 5.2 5.6 4.6 4.7 5.4 6.3 5.3 Rwanda 4.2 4.2 4.5 4.6 3.8 4.4 4,6 4.3 3.7 4.4 4.5 4.0 4.1 4.5 4.6 4.4 Tanzania 5.9 5.8 6.8 7,5 5,7 6.6 7.4 5.9 4.5 6,3 6.9 5.8 5.8 6.4 7.4 6,4 Africa 2.6 2.7 2.9 3.1 2.6 3,1 3.1 2,9 2.5 2.8 NA 2.4 2.5 2.9 3.4 2.8 Morocco 3.2 3.4 3.9 4.5 3.3 4.3 4.2 3.2 2.8 3.9 3.7 3.2 3.1 3.7 4.8 3.9 Asia Bangladesh 2.3 2.4 2.6 2.8 2.3 2.5 2,6 2.5 2.2 2.5 NA 2,2 2,3 2.6 2.9 2.5 Pakistan 4.0 3.9 4.1 4.5 3.7 4.4 4,3 4.0 3.5 4,1 4.3 4.0 3.8 4.0 4.5 4.1 NA = Not applicable U = Unknown (not available) 4.1 Mean ideal family size among currently married men and women, Demographic and Health Surveys, 1987-1993 Africa Faso Cameroon Ghana (1988) Ghana (1993) Niger Senegal Africa Kenya (1989) Kenya (1993) Malawi Rwanda Tanzania Africa Morocco Pakistan ~•s•; ~• ~•: ¸ :,•: •~; i •• • L ~ •• • •~ ( Percent DMen mWomen ly married men consistently report a higher mean IFS than monogamously married women. In Niger, for instance, monogamously married men want 4 children more than monogamously married women (I 1.9 versus 7.2 children). This gap narrows to less than half a child in most countries outside West Africa. Polygyny is often used to explain men's high fertility desires. This analysis suggests that the reverse may be true, that men are using polygyny to achieve their reproductive goals. In Niger, for example, the total fertility rate (TFR) is 7.3, but monogamous men desire 11.9 children, on average, while polygynous men desire an average of 15.5 children. Thus, it would take 1.6 women per monogamous man and 2.2 women per polygynous man to satisfy their average fer- tility desires. In Cameroon, with a TFR of 5.8, monogamous men would require 1.7 women and polygynons men 2.8 women to satisfy their expressed fertility desires of 9.8 and 16.1 children, respectively. Most comparative studies treat sub-Saharan Africa as a homogeneous unit. The results presented here challenge the validity of this assumption. Respondents in West Africa differ from those in East Africa both in their mean ideal family size and in the extent to which men and women share the same fertility desires. The large differences in IFS be- tween men and women in West Africa may have implica- tions for the timing and pace of fertility decline there, par- ticularly if men and women have unequal control over reproductive decisions. Recent trends in Ghana support this argument. The total fertility rate (TFR) in Ghana declined by 14 percent between the two DHS surveys while contra- ceptive use doubled (GDHS, 1994). During that period, male fertility desires fell by more than 30 percent while women's fertility desires fell by less than 15 percent. In fact, the absolute decline in male fertility desires was three times the decline in female fertility desires. Male methods, espe- cially the condom, accounted almost entirely for the in- crease in contraceptive use. While these statistics do not conclusively prove a link between declines in male fertility desires and fertility declines, they do suggest that a thresh- old in fertility decline may be difficult to attain in societies characterized by high fertility desires among men, even if women express very low fertility desires. 31 Fertility Preferences family size (IFS) marks the boundaries of socially acceptable reproductive behavior (Westoff, 1991). Changes over time in ideal family size may indicate shifts in attitude that are believed to precede changes in behavior. Ideal fami- ly size is of limited utility in predicting actual behavior. De- pending on the respondent' s reference point, IFS may repre- sent reproductive behavior under the best or worst possible conditions of childbearing. Individual rationalizations may affect reported numbers of IFS and some have considered this measure to be the most biased indicator of fertility de- sires (Bongaarts, 1990; Pritchett, 1994). Table Since IFS is influenced by current fertility, the re- sponses for desired number of children are biased toward the respondent's actual number of surviving children. Male fertility may be influenced by polygyny levels Mean ideal family size increases with age in every country, but the trend is most pronounced in West Africa. In Cameroon, for instance, ideal family size rises from 8.8 in the 20-29 year age group to 16.6 for men aged 60 years and over. In contrast, ideal family size change Polygynously married men report higher fertility de- sires than monogamously married men in every country, but the difference in their mean IFS ranges from more than 6 children in Cameroon to less than 0.5 in Bangladesh, Morocco, and Pakistan. Polygynous men in West Africa de- sire, on average, at least 3 children more than monogamous men. The only exception is Ghana, where the difference in the fertility desires of polygynous and monogamous men dropped from 3.7 children in the 1988 survey to 1.6 in 1993. In The Rural-urban differences in men's ideal family size are widest in West Africa. Rural men in West Africa generally desire two to four children more than urban men, except in Niger, which has the highest IFS (rural and urban) of all the countries surveyed. In East Africa, rural men generally de- sire one child more than urban men; the exception is Tanza- nia, where rural men desire about two children more, on 28 AND HEALTH SURVEYS COMPARATIVE STUDIES