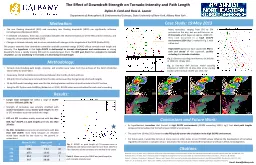
Justin Schultz¹ Mentors Karl Jungbluth² and Dr Mike Chen¹ Department of Geological and Atmospheric Sciences Iowa State University¹ Johnston Iowa National Weather Service² Background Updraft importance ID: 672180 Download Presentation
Dylan R. Card and Ross A. . Lazear. Department of Atmospheric & Environmental Sciences, State University of New York, Albany New York. Motivation. :. T. he . rear flanking . downdraft . (RFD) and secondary rear flanking downdraft (SRFD) .
Mesovortex. Tornadoes. Conducted by:. Robert Frye & Jason . Schaumann. NWS Springfield, MO. Overview. Finish review of confidence builders/. nudgers. as a continuation of the last 2 presentations.
Flood . – any relatively high stream flow overtopping the natural or artificial banks in a water system.. Common Causes:. Long-lasting rainfall over a broad area. Locally intense thunderstorm - generated rainfall.
Chapter 10. Outline . Section 10-1 Introduction. Section 10-2 Scatter Plots. Section 10-3 Correlation. Section 10-4 Regression. Section 10-5 Coefficient of Determination and Standard Error of the Estimate.
5.1.9. You and I are standing next to each other, listening to the exact same steady sound. . Our ears are identical. . You listen for TWICE as long as I do. How does the (average) power compare? (Please average ONLY over the time that the individual is listening!).
Robert . Gilmore Pontius Jr. Clark . University, . USA . rpontius@clarku.edu. Ten-minute . primer for Intensity Analysis.. . Yan . Gao. National University of Mexico, Mexico . yangao98@gmail.com. .
Objective. : To look for relationships between two quantitative variables. Scatterplots. Scatterplots. . may be the most common and most effective display for data. . In a scatterplot, you can see patterns, trends, relationships, and even the occasional extraordinary value sitting apart from the others..
5.1.9. You and I are standing next to each other, listening to the exact same steady sound. . Our ears are identical. . You listen for TWICE as long as I do. How does the (average) power compare? (Please average ONLY over the time that the individual is listening!).
Mary Forsythe, Graeme Kelly, Javier Garcia Pereda. IWW14, 24/04/2018. www.metoffice.gov.uk © Crown Copyright 2017, Met Office. © Crown copyright Met Office.
Published bymitsue-stanley
Justin Schultz¹. Mentors: Karl Jungbluth² and Dr. Mike Chen¹. Department of Geological and Atmospheric Sciences. Iowa State University¹. Johnston, Iowa: National Weather Service². Background. Updraft importance.
Download Presentation - The PPT/PDF document "Correlation between updraft strength and..." is the property of its rightful owner. Permission is granted to download and print the materials on this web site for personal, non-commercial use only, and to display it on your personal computer provided you do not modify the materials and that you retain all copyright notices contained in the materials. By downloading content from our website, you accept the terms of this agreement.
© 2021 docslides.com Inc.
All rights reserved.