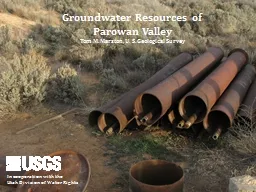
Tom M Marston U S Geological Survey In cooperation with the Utah Division of Water Rights Parowan Valley Approx 160 mi 2 Structural depression between Hurricane fault and the Red Hills Closed surfacewater basin aside from Winn Gap ID: 398123
Download Presentation The PPT/PDF document "Groundwater Resources of Parowan Valley" is the property of its rightful owner. Permission is granted to download and print the materials on this web site for personal, non-commercial use only, and to display it on your personal computer provided you do not modify the materials and that you retain all copyright notices contained in the materials. By downloading content from our website, you accept the terms of this agreement.
Slide1
Groundwater Resources of Parowan ValleyTom M. Marston, U. S. Geological Survey
In cooperation with the
Utah Division of Water RightsSlide2
Parowan ValleyApprox. 160 mi2
Structural depression between Hurricane fault and the Red HillsClosed surface-water basin (aside from Winn Gap)
Little Salt Lake (playa)
Parowan GapHistorically flowing/artesian conditions for large area of central portion of valleyUnconsolidated fill deposits are 1,000+ ft thick
BackgroundSlide3
Background
Previous investigationsThomas, H. E., and Taylor, G.H., 1946, Geology and ground-water resources of Cedar City and Parowan Valleys, Iron County, Utah: U.S. Geological Survey Water-Supply Paper 993.
Approximately
6,000 acre-ft of annual groundwater withdrawalWater-levels relatively stable
Bjorklund
, L. J.,
Sumsion
, C. T., and Sandberg, G. W., 1978,
Ground-water Resources of the Parowan-Cedar City Drainage Basin, Iron County, Utah: Utah Department of Natural Resources Technical Publication No. 60.
Approximately
34,000
acre-
ft
of annual groundwater withdrawal
Water-levels in decline since early 1960’sSlide4
Ongoing Monitoring in Parowan ValleySlide5
Ongoing Monitoring in Parowan
Valley(Water-Levels)Slide6
Ongoing Monitoring in Parowan Valley
(
Withdrawals)
Withdrawal totals based on discharge/power use ratings (1963-present)
Estimates of yearly withdrawals from 1940’s to presentSlide7
ObjectivesDevelopment of an updated groundwater budget for the valley fill aquifer
Evaluation of current groundwater level and storage conditions, and changes since 1975
Evaluation of effects from historic changes in aquifer water levels and storageSlide8
The Water Budget
Basic Components
Recharge
Mountain InfiltrationStream seepage on alluvial fans (non-growing season)
Irrigation
Valley
precip
(
negl
.)
Change in storage
Discharge
Springs
Evapotranspiration (mountain and valley)
Captured runoff
WithdrawalsSlide9
RechargeEstimates of infiltration and runoff will be made using the Basin Characteristics Model (Flint and others, 2007; Flint and others, 2011)
Most
valley recharge likely occurs as seepage on alluvial fans and subsurface mountain block groundwater
Steam seepage to alluvial fans will be evaluated by using historically USGS stream gages on Summit, Parowan, Red, and Little Creeks. Additionally discharge measurements will be made on the four creeks
Need assistance in understanding timing and placement of irrigation distributionsSlide10
Little Creek
USGS 375432112445401
Natural Channel
Little Creek Diversion and Distribution StructureSlide11
Red Creek
Red Creek Reservoir
North Fork Power Diversion
South Fork Power Diversion
Penstock
Penstock
Power Plant
Red Creek Diversion and Distribution Structure
Paragonah
Culinary SpringSlide12
Parowan and Bowery Creeks
USGS 374747112483901
USGS 374754112485501
Parowan Creek Diversion Structure
Penstock
Yankee Meadows ReservoirSlide13
Parowan Power Plant and Distribution
Penstock
Power Plant
Parowan Creek Distribution Structure
Natural Channel
Parowan Creek Diversion StructureSlide14
Summit Creek
USGS 374722112550701
Summit Creek Diversion Structure
Natural Channel
Red Creek Distribution StructureSlide15
Changes in Storage
Rates of storage change will be made on calculated changes in water-levels and estimated aquifer storage properties
Most valley recharge likely occurs as seepage on alluvial fans and subsurface mountain block groundwater
Potentiometric map for Nov. 2012 (complete)Change mapsWater year 20131974-2013
MODFLOW model (GBCAAS) to estimate storage propertiesSlide16
Water-Levels Oct-Nov 1974Slide17
Water-Levels November 2012Slide18
Discharge
Withdrawals from wellsPrincipally irrigation wells
1965 through 2008 110 irrigation wells were visited triennially under the state-wide groundwater use monitoring program
New consumption estimates will be made on these wells (Summer 2013)Flow meters installed on a portion of irrigation wellsEvapotranspirationNatural and Irrigation
Water Quality
Irrigation wells – pH,
SpC
, Temp
Selected 25 wells – Major-ion chemistry, nutrients, stable isotopesSlide19
Irrigation Withdrawals
Rated Wells
Metered WellsSlide20
Evapotranspiration
1974
2004Slide21
Long-term groundwater declines since the mid-1960sUpdated groundwater budgetRe-characterization of aquifer chemistry
Evaluation of effects of decreased water-levelsAccurate measurements imperative to quality of data and decreased uncertainty
SummarySlide22
William Wilson – Summit Creek IrrigationKelly Stones – Parowan City Public Works
Frank Lister – Red Creek IrrigationTony Dalton – Little Creek Irrigation
Acknowledgements Slide23
Tom Marston
U. S. Geological SurveyUtah Water Science Center
801-908-5030
tmarston@usgs.gov