/
Illinois Soil Nitrogen Test (ISNT) Illinois Soil Nitrogen Test (ISNT)

Illinois Soil Nitrogen Test (ISNT) - PDF document

mitsue-stanley
mitsue-stanley . @mitsue-stanley
Follow
386 views
Uploaded On 2016-06-17

Illinois Soil Nitrogen Test (ISNT) - PPT Presentation

Fact Sheet 36 Agronomy Fact Sheet Series Field Crops Extension 1 College of Agriculture and Life Sciences Accounting for i n field sources of nitroge n Plants take up nitrogen N fro ID: 365570

Fact Sheet

Share:

Link:

Embed:

Download Presentation from below link

Download Pdf The PPT/PDF document "Illinois Soil Nitrogen Test (ISNT)" is the property of its rightful owner. Permission is granted to download and print the materials on this web site for personal, non-commercial use only, and to display it on your personal computer provided you do not modify the materials and that you retain all copyright notices contained in the materials. By downloading content from our website, you accept the terms of this agreement.


Presentation Transcript
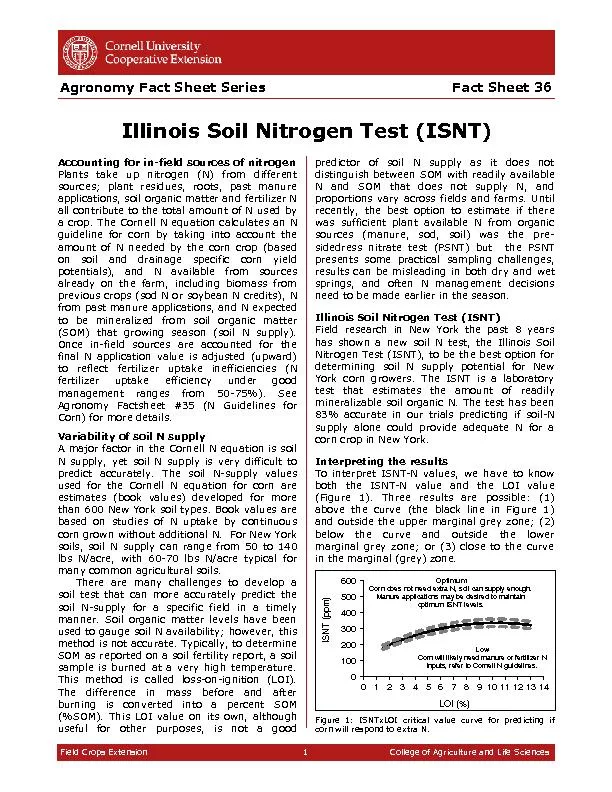
Fact Sheet 36 Illinois Soil Nitrogen Test (ISNT) Agronomy Fact Sheet Series Field Crops Extension 1 College of Agriculture and Life Sciences Accounting for i n - field sources of nitroge n Plants take up nitrogen (N) from different sources ; plant residues , roots, past manure applications, soil organic matter and fertilizer N all contribute to the total amount of N used by a crop . The Cornell N equation calculates a n N guideline for c orn by taking into account the amount of N needed by the corn crop (based on soil and drainage specific corn yield potentials), and N available fr om sources already on the farm, including biomass from previous crops (sod N or soybean N credits), N from past manure applications, and N expected to be mineralized from soil organic matter (SOM) that growing season (soil N supply ). Once in - field sources are accounted for the final N application value is adjusted (upward) to reflect fertilizer uptake inefficiencies (N fertilizer uptake efficiency under good management ranges from 50 - 75%) . See Agronomy Factsheet #35 ( N Guidelines for Corn ) for more details. Variability of soil N s upply A major factor in the Cornell N equation is soil N supply , yet soil N supply is very difficult to predict accurately . The s oil N - supply values used for the Cornell N equation for corn are estimates (book values) developed for more than 600 New York soil types. Book values are based on studies of N uptake by continuous corn grown without additional N . F or New York soils, soil N supply can range from 50 to 140 lbs N/acre , with 60 - 70 lbs N/acre typical for many comm on agricultural soils . There are many challenges to develop a s oil test that can more accurately predict th e soil N - supply for a specific field in a timely manner . Soil organic matter levels have been used to gauge soil N availability ; however , this method is not a ccurate. Typically , to determine SOM as reported on a soil fertility report, a soil sample is burned at a very high temperature . This method is called loss - on - ignition (LOI) . The difference in mass before and after burning is converted into a percent SOM (% S OM) . This LOI value on its own , although useful for other purposes, is not a g ood predictor of soil N supply as it does not distinguish between S OM with readily available N and S OM that does not supply N , and proportions vary across fields and farms . Until recently , the best option to estimate if there was sufficient plant available N from organic sources (manure, sod, soil) was the pre - sidedress nitrate test (PSNT) but the PSNT presents some practical sa mpling challenges , results can be misleading in both dry and wet spring s , and often N management decisions need to be made earlier in the season . Illinois Soil Nitrogen Test (ISNT) Field research in New York the past 8 years has shown a new soil N test, the Illinois Soil Nitrogen Test (ISNT), to be the best option for determining soil N supply potential for New York corn growers. The ISNT is a laboratory test that estimat es the amount of readily mineralizable soil organic N . The test ha s been 83% accura te in our trials predicting if soil - N supply alone could provide adequate N for a corn crop in New York . Interpreting the results To interpret ISNT - N values, we have to know both the ISNT - N value and the LOI value (Figure 1). Three results are possible : (1) above the curve ( the black line in Figure 1) and outside the upper marginal grey zone ; (2) below the curve and outside the lower marginal grey zone ; or (3) close to the curve in the marginal ( grey ) zone. Figure 1 : ISNTxLOI critical value curve for predicting if corn will respond to extra N. 0 100 200 300 400 500 600 0 1 2 3 4 5 6 7 8 9 10 11 12 13 14 ISNT (ppm) LOI (%) Optimum Corn does not need extra N, soil can supply enough. Manure applications may be desired to maintain optimum ISNT levels. Low Corn will likely need manure or fertilizer N inputs, refer to Cornell N guidelines. Field Crops Extension 2 College of Agriculture and Life Sciences (1) Optimum : Above the ISNTxLOI curve T he soil can supply enough N for optimum corn yield and no additional N is needed (small amount of starter N only) . These soils will supply enough N thr oughout the growing season to support optimum corn growth and can quickly mobilize N into a plant available form as soils warm up in June and corn begins to grow rapidly . (2) Low : Below the ISNTxLOI curve The soil alone does not have enough N supply potential to meet crop N needs. These fields will likely show a response to additional N either from fertilizer or manure and the Cornell N equation for corn can be used to estimate how much N will be needed (Agronomy Fact S heet #35). (3) Marginal : In the grey zone Soils falling within the gray dotted lines in F igure 1 are considered marginally adequate in soil N supply . These fields might have enough soil N but additional monitoring is needed. These are good fields for fertilizer test strips. Soil sampling for ISN T Soil s amples for the ISNT can be taken any time during the year , except within 5 weeks after manure spreading or sod/cover crop turnover , with the same sampling and handling methods as used for regular soil samples ( 0 - 8 inch es , see Agronomy Fact Sheet #1). Since sampling procedures are identical, the same sample can be used for regular fertility assessment as well as for ISNT analyses . Results from the ISNT analysis will reflect soil organic N mineralization potential for the next 2 - 3 years. T he sample is best taken in the fall af ter harvest of 1 st year corn before manure application to guide decisions for 2 nd year corn or higher. First year corn after grass/legume sod does not need N beyond 20 - 30 lbs N /acre in the starter (Agronomy Fact S heet #21) . Thus, we do not need to evaluate the ISNT and LOI levels of 1 st year corn fields. Sample submission S oil s amples can be submitted to: Quirine Ketterings Nutrient Management Spear Program Dep t. of Animal Science, 323 Morrison Hall, Cornell University, Ithaca NY 14853 See http://nmsp.cals.cornell.edu to download a sample submission form . Alternatively, samples can be submitted to other lab oratorie s that offer ISNT analysis but for accurate interpretation of the ISNT data for New Y ork growing conditions (i.e. to use Figure 1 ) , make sure the laboratory that you submit samples to has implemented a 2 - h ou r and 500 o C method for determining LOI . B urning at lower temperatures can result in lower LOI estimates possibly resulting in incorrect i nterpretations of the ISNT results . Th e % OM using the 2 - hour and 500 o C method can be converted to % LOI using the following formulas : %LOI = (%OM + 0.23) / 0.7 %OM = (%LOI * 0.7) – 0.23 Conclusion The ISNT can accurately predict soil N - supply capacity for corn in New York , sampling for the ISNT fits nicely into a regular soil sampling protocol (0 - 8 inch depth samples) , and the results can be applied for the following 2 - 3 years of corn. The ISNT has proven to be a useful tool for fine - tuning N applications and reducing purchased N inp uts costs , especially when used together with the corn stalk nitrate test . Ad ditional Resources o Nutrient Management Spear Program Agronom y Fact Sheet Series : nmsp.cals.cornell.edu/index.html o N utrient Guidelines for Field Crop s in New York : nmsp.cals.cornell.edu/guidelines/nutrientguide.html o N ew York State Corn Nitrogen Calculator: nmsp.cals.cornell.edu/software/calculators.html Disclaimer This fact sheet reflects the current (and past) authors’ best effort to interpret a complex body of scientific research, and to translate this into practical management options. Following the guidance provided in this fact sheet does not assure compliance with any applicable law, rule, regulation or standard, or the achievement of particular discharge levels from agricultural land . For more information Nutrient Management Spear Program http://nmsp.c al s.cornell.edu Joe Lawrence , Patty Ristow, Quirine Ketterings, Karl Czymmek 201 2 ( revised )