/
Let’s Let’s

Let’s - PowerPoint Presentation

mitsue-stanley
mitsue-stanley . @mitsue-stanley
Follow
365 views
Uploaded On 2018-01-07

Let’s - PPT Presentation

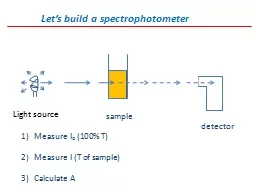
build a spectrophotometer Light source sample detector Measure I o 100 T Measure I T of sample Calculate A Change the monchromator to measure A versus wavelength Light source sample ID: 621179

nadh measure wavelength sample measure nadh sample wavelength time light 100 source enzyme spectrum 400 monochromator concentration trp detector

Share:

Link:

Embed:

Download Presentation from below link

Download Presentation The PPT/PDF document "Let’s" is the property of its rightful owner. Permission is granted to download and print the materials on this web site for personal, non-commercial use only, and to display it on your personal computer provided you do not modify the materials and that you retain all copyright notices contained in the materials. By downloading content from our website, you accept the terms of this agreement.


Presentation Transcript

Slide1

Let’s build a spectrophotometer

Light source

sample

detector

Measure I

o

(100% T)

Measure I (T of sample)

Calculate ASlide2

Change the monchromator to measureA versus wavelength

Light source

sample

monochromator

detector

A

λ

(nm)

Scanning an absorbance spectrum

Resolution will be defined by dispersion

and slit width,

bandpass

≤ 2nm is

sufficientSlide3

Light source

sample

Measure all wavelengths at once

monochromator

Detector array

Diode array spectrometer

Sample receives broad irradiation (i.e., white light)

Dispersion element comes after the sample

Project spectrum onto an array of detectorsSlide4

1) Concentration Proteins

DNA2) Environmental

effects Effect of solvent

pH

Ligand or protein interactions3) Time – resolved measurements Measure time dependent changes TimescalesSome applications of spectrophotometrySlide5

Measuring concentration

Suppose we are studying an enzyme that consumes NADH as part of

its catalytic reaction, we can use the long wavelength absorbance band

of the pyridine

chromophore to measure NADH concentration,and thereby activity. A + H+ + NADH → NAD+ + AH2We know the KM of the enzyme for NADH is 100 μM (and for A, KM =5μM)

We wish to measure the total activity present in a series of extracts.

Measure Vmax

at saturating S, (i.e., NADH & A)[NADH] = 1 mM

(10-fold> KM)Measure A at 340 nm, A =

ε c l A= 6.23 x 10³

M-1 cm-1 (1 x10

-3 M) = 6.23Slide6

Measuring concentration (contd

)

A > 6 means % T < 0.0001 % , 99.9999 % of I

o

absorbedMost spectrophotometers are only linear up to A= 3 Stray lightHow can we fix the problem?Dilute the NADH. What about the pathlength?Measure off the peak.

A

[x] (M)

3

2

1Slide7

The spectrum of NADH

220 300 400

Wavelength (nm)

2.0

1.0

0

A

20

10

0

ε

(mM

-1

cm

-1

)

NAD

+

NADHSlide8

Environmental effects-Solvent perturbation

Trp

in aqueous buffer

b) + co-solvent

e.g., 10% DMSO260 280 300

2.0

1.0

0

A

Wavelength (nm)

E

1

E

2

Blue-shift to

Shorter

λ

Red- shift

Longer

λSlide9

Difference spectroscopy- small changes

Using

trp

in aqueous buffer

as reference, i.e., 100 % T260 280 300Wavelength (nm)

0.1

0

-0.1

Δ

A

0.05

-0.05Slide10

Sample

Trp

+ DMSO

Light source

monochromator

detectors

Reference

Trp

in buffer

Split-beam spectrophotometer

Beam splitter

mirrorSlide11

Light source

sample

monochromator

detector

Split- beam or split

cuvette

1

2

In the two compartments (1 and 2)we have two proteins A and B

that we suppose form a complex,

A + B AB

Place equal volumes of the two protein solutions in the two sides,

Measure this as reference, i.e., 100 %T, then mix and record again,

The difference spectrum is generatedSlide12

Ligand

binding

Cyanide binding to the respiratory enzyme-

cytochrome

c oxidaseWhat we know, cyanide is a potent poison of respiration CN inhibition to respiring mitochondria is instantaneous Blocks electron transfer to O2

[O

2

]

Time (min)

M

S

CNSlide13

Cyanide reaction with

cytochrome

c oxidase

A

Wavelength (nm)

1

0.5

0

400 420 440 460

A=

ε

cl

A

CN

=

ε

CN

cl

E

E-CN

A

430 nm

Time

+CN

0 1 10 100 1000Slide14

0.4

0.2

0

-0.2

-0.4

Δ

A

400 420 440 460

Wavelength (nm)

Time (m)

1000

700

400

100

1

Time-resolved spectroscopy

Isosbestic

points

E + CN

E-CN

3) Reactivity of the enzyme

in vitro

is different from

enzyme

in vivo

4)

Oxidase

exists in multiple states

Related Contents


Next Show more