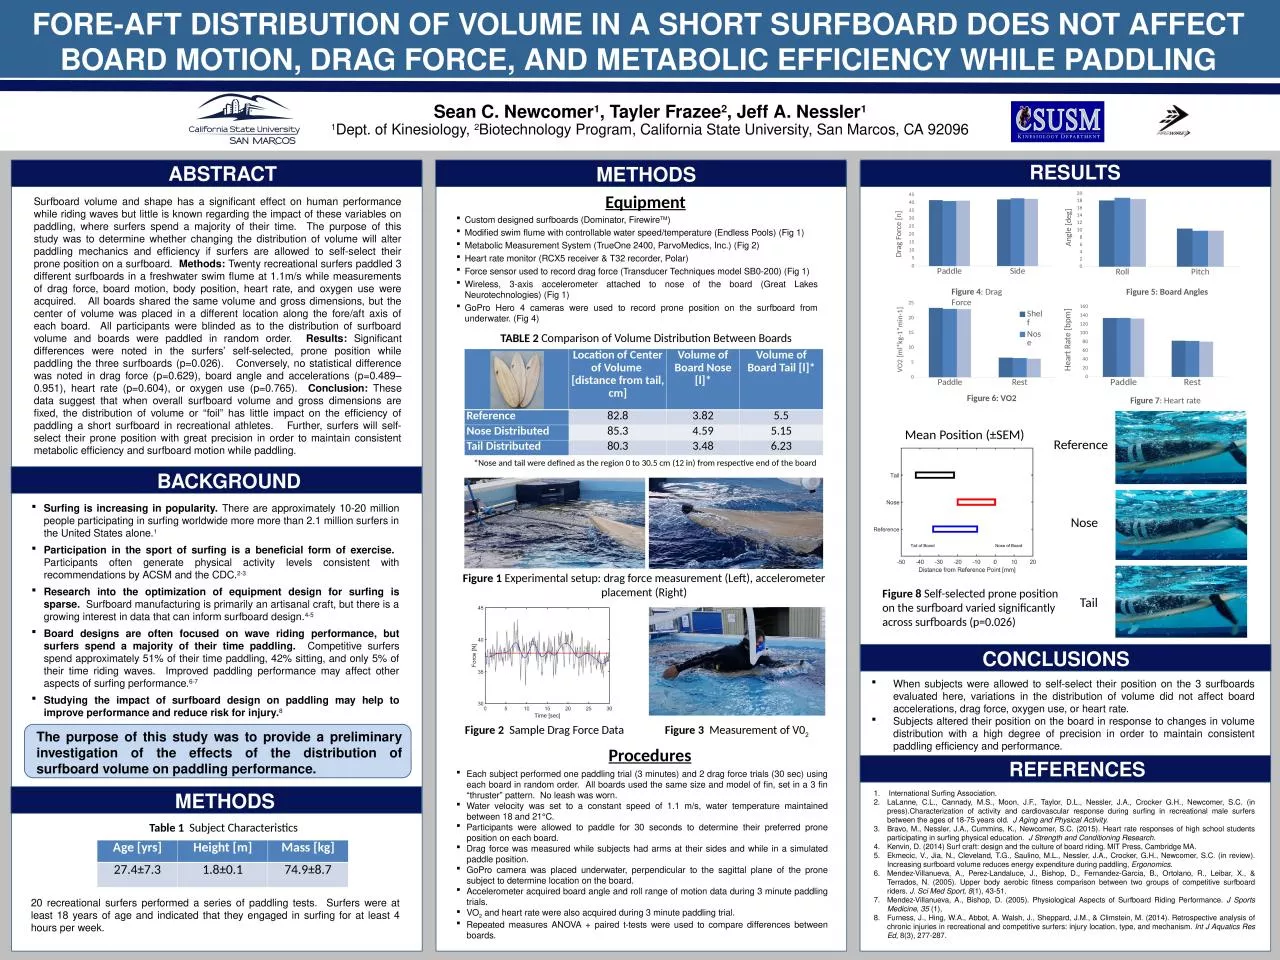
/
FORE-AFT DISTRIBUTION OF VOLUME IN A SHORT SURFBOARD DOES NOT AFFECT BOARD MOTION, DRAG FORE-AFT DISTRIBUTION OF VOLUME IN A SHORT SURFBOARD DOES NOT AFFECT BOARD MOTION, DRAG

FORE-AFT DISTRIBUTION OF VOLUME IN A SHORT SURFBOARD DOES NOT AFFECT BOARD MOTION, DRAG - PowerPoint Presentation

molly
molly . @molly
Follow
66 views
Uploaded On 2023-06-23

FORE-AFT DISTRIBUTION OF VOLUME IN A SHORT SURFBOARD DOES NOT AFFECT BOARD MOTION, DRAG - PPT Presentation

Sean C Newcomer 1 Tayler Frazee 2 Jeff A Nessler 1 1 Dept of Kinesiology 2 Biotechnology Program California State University San Marcos CA 92096 RESULTS BACKGROUND REFERENCES ID: 1002456

paddling volume surfboard board volume paddling board surfboard surfers position drag force surfing distribution performance prone heart rate surfboards

Share:

Link:

Embed:

Download Presentation from below link

Download Presentation The PPT/PDF document "FORE-AFT DISTRIBUTION OF VOLUME IN A SHO..." is the property of its rightful owner. Permission is granted to download and print the materials on this web site for personal, non-commercial use only, and to display it on your personal computer provided you do not modify the materials and that you retain all copyright notices contained in the materials. By downloading content from our website, you accept the terms of this agreement.


Presentation Transcript

1. FORE-AFT DISTRIBUTION OF VOLUME IN A SHORT SURFBOARD DOES NOT AFFECT BOARD MOTION, DRAG FORCE, AND METABOLIC EFFICIENCY WHILE PADDLINGSean C. Newcomer1, Tayler Frazee2, Jeff A. Nessler11Dept. of Kinesiology, 2Biotechnology Program, California State University, San Marcos, CA 92096 RESULTSBACKGROUNDREFERENCESInternational Surfing Association.LaLanne, C.L., Cannady, M.S., Moon, J.F., Taylor, D.L., Nessler, J.A., Crocker G.H., Newcomer, S.C. (in press).Characterization of activity and cardiovascular response during surfing in recreational male surfers between the ages of 18-75 years old. J Aging and Physical Activity.Bravo, M., Nessler, J.A., Cummins, K., Newcomer, S.C. (2015). Heart rate responses of high school students participating in surfing physical education. J Strength and Conditioning Research.Kenvin, D. (2014) Surf craft: design and the culture of board riding. MIT Press, Cambridge MA.Ekmecic, V., Jia, N., Cleveland, T.G., Saulino, M.L., Nessler, J.A., Crocker, G.H., Newcomer, S.C. (in review). Increasing surfboard volume reduces energy expenditure during paddling, Ergonomics.Mendez-Villanueva, A., Perez-Landaluce, J., Bishop, D., Fernandez-Garcia, B., Ortolano, R., Leibar, X., & Terrados, N. (2005). Upper body aerobic fitness comparison between two groups of competitive surfboard riders. J. Sci Med Sport, 8(1), 43-51.Mendez-Villanueva, A., Bishop, D. (2005). Physiological Aspects of Surfboard Riding Performance. J Sports Medicine, 35 (1), Furness, J., Hing, W.A., Abbot, A. Walsh, J., Sheppard, J.M., & Climstein, M. (2014). Retrospective analysis of chronic injuries in recreational and competitive surfers: injury location, type, and mechanism. Int J Aquatics Res Ed, 8(3), 277-287.Surfing is increasing in popularity. There are approximately 10-20 million people participating in surfing worldwide more more than 2.1 million surfers in the United States alone.1 Participation in the sport of surfing is a beneficial form of exercise. Participants often generate physical activity levels consistent with recommendations by ACSM and the CDC.2-3Research into the optimization of equipment design for surfing is sparse. Surfboard manufacturing is primarily an artisanal craft, but there is a growing interest in data that can inform surfboard design.4-5Board designs are often focused on wave riding performance, but surfers spend a majority of their time paddling. Competitive surfers spend approximately 51% of their time paddling, 42% sitting, and only 5% of their time riding waves. Improved paddling performance may affect other aspects of surfing performance.6-7Studying the impact of surfboard design on paddling may help to improve performance and reduce risk for injury.8 Figure 8 Self-selected prone position on the surfboard varied significantly across surfboards (p=0.026)CONCLUSIONSWhen subjects were allowed to self-select their position on the 3 surfboards evaluated here, variations in the distribution of volume did not affect board accelerations, drag force, oxygen use, or heart rate.Subjects altered their position on the board in response to changes in volume distribution with a high degree of precision in order to maintain consistent paddling efficiency and performance. Each subject performed one paddling trial (3 minutes) and 2 drag force trials (30 sec) using each board in random order. All boards used the same size and model of fin, set in a 3 fin “thruster” pattern. No leash was worn.Water velocity was set to a constant speed of 1.1 m/s, water temperature maintained between 18 and 21°C.Participants were allowed to paddle for 30 seconds to determine their preferred prone position on each board.Drag force was measured while subjects had arms at their sides and while in a simulated paddle position.GoPro camera was placed underwater, perpendicular to the sagittal plane of the prone subject to determine location on the board.Accelerometer acquired board angle and roll range of motion data during 3 minute paddling trials.VO2 and heart rate were also acquired during 3 minute paddling trial.Repeated measures ANOVA + paired t-tests were used to compare differences between boards.The purpose of this study was to provide a preliminary investigation of the effects of the distribution of surfboard volume on paddling performance.BACKGROUNDTable 1 Subject Characteristics20 recreational surfers performed a series of paddling tests. Surfers were at least 18 years of age and indicated that they engaged in surfing for at least 4 hours per week.Age [yrs]Height [m]Mass [kg]27.4±7.31.8±0.174.9±8.7EquipmentCustom designed surfboards (Dominator, FirewireTM)Modified swim flume with controllable water speed/temperature (Endless Pools) (Fig 1)Metabolic Measurement System (TrueOne 2400, ParvoMedics, Inc.) (Fig 2)Heart rate monitor (RCX5 receiver & T32 recorder, Polar)Force sensor used to record drag force (Transducer Techniques model SB0-200) (Fig 1)Wireless, 3-axis accelerometer attached to nose of the board (Great Lakes Neurotechnologies) (Fig 1)GoPro Hero 4 cameras were used to record prone position on the surfboard from underwater. (Fig 4)METHODSABSTRACTRESULTSProceduresSurfboard volume and shape has a significant effect on human performance while riding waves but little is known regarding the impact of these variables on paddling, where surfers spend a majority of their time. The purpose of this study was to determine whether changing the distribution of volume will alter paddling mechanics and efficiency if surfers are allowed to self-select their prone position on a surfboard. Methods: Twenty recreational surfers paddled 3 different surfboards in a freshwater swim flume at 1.1m/s while measurements of drag force, board motion, body position, heart rate, and oxygen use were acquired. All boards shared the same volume and gross dimensions, but the center of volume was placed in a different location along the fore/aft axis of each board. All participants were blinded as to the distribution of surfboard volume and boards were paddled in random order. Results: Significant differences were noted in the surfers’ self-selected, prone position while paddling the three surfboards (p=0.026). Conversely, no statistical difference was noted in drag force (p=0.629), board angle and accelerations (p=0.489–0.951), heart rate (p=0.604), or oxygen use (p=0.765). Conclusion: These data suggest that when overall surfboard volume and gross dimensions are fixed, the distribution of volume or “foil” has little impact on the efficiency of paddling a short surfboard in recreational athletes. Further, surfers will self-select their prone position with great precision in order to maintain consistent metabolic efficiency and surfboard motion while paddling.METHODSFigure 1 Experimental setup: drag force measurement (Left), accelerometer placement (Right)Figure 3 Measurement of V02TABLE 2 Comparison of Volume Distribution Between Boards Location of Center of Volume [distance from tail, cm]Volume of Board Nose [l]*Volume of Board Tail [l]*Reference82.83.825.5Nose Distributed85.34.595.15Tail Distributed80.33.486.23*Nose and tail were defined as the region 0 to 30.5 cm (12 in) from respective end of the board Figure 2 Sample Drag Force DataMean Position (±SEM)ReferenceNoseTailFigure 4: Drag ForceFigure 7: Heart rate