PPT-Note: Increases/Decreases in valuations are the average changes for a zone. Individual
Author : motivatorprada | Published Date : 2020-08-03
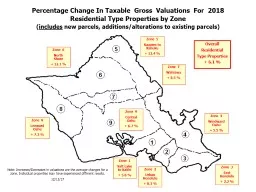
121217 Percentage Change In Taxable Gross Valuations For 2018 Residential Type Properties by Zone includes new parcels additionsalterations to existing parcels
Presentation Embed Code
Download Presentation
Download Presentation The PPT/PDF document "Note: Increases/Decreases in valuations ..." is the property of its rightful owner. Permission is granted to download and print the materials on this website for personal, non-commercial use only, and to display it on your personal computer provided you do not modify the materials and that you retain all copyright notices contained in the materials. By downloading content from our website, you accept the terms of this agreement.
Note: Increases/Decreases in valuations are the average changes for a zone. Individual: Transcript
Download Rules Of Document
"Note: Increases/Decreases in valuations are the average changes for a zone. Individual"The content belongs to its owner. You may download and print it for personal use, without modification, and keep all copyright notices. By downloading, you agree to these terms.
Related Documents