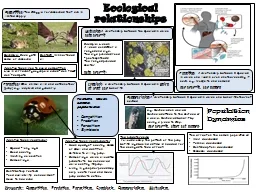
An organisms role in its environment An organisms habitat is the area where it lives In any environment every species fills a unique niche A niche includes the conditions and resources a species needs for survival and how it obtains these resources ID: 353435
Download Presentation The PPT/PDF document "12A Interpret relationships (predation, ..." is the property of its rightful owner. Permission is granted to download and print the materials on this web site for personal, non-commercial use only, and to display it on your personal computer provided you do not modify the materials and that you retain all copyright notices contained in the materials. By downloading content from our website, you accept the terms of this agreement.
Slide1
12A
Interpret relationships (predation, parasitism, commensalism, mutualism, competition) among organismsSlide2
An organisms role in its environment…
An organisms
habitat
is the area where it lives.
In any environment, every species fills a unique niche.
A
niche
includes the conditions and resources a species’ needs for survival and how it obtains these resources.Slide3Slide4
Relationships between OrganismsSlide5
COMPETITION
THE DEMAND BY TWO OR MORE ORGANISMS FOR LIMITED RESOURCES SUCH AS FOOD, WATER OR SHELTERSlide6
PREDATION
INTERACTION IN WHICH ONE ORGANISM CAPTURES AND FEEDS ON ANOTHER ORGANISMSlide7
PREDATOR
LION
THE ORGANISM CAPTURING AND FEEDING ON ANOTHER ORGANISM (THE PREY)Slide8
PREY
HIPPO
ORGANISM BEING EATENSlide9
PARASITISM
SYMBIOTIC RELATIONSHIP IN WHICH ONE ORGANISM LIVES IN OR ON ANOTHER ORGANISM & CAUSES IT HARMSlide10
PARASITE
TICK
ORGANISM LIVING IN OR ON ANOTHER ORGANISM CAUSING IT HARMSlide11
HOST
DOG
ORGANISM BEING HARMED BY PARASITESlide12
COMMENSALISM
SYMBIOTIC RELATIONSHIP IN WHICH ONE ORGANISM BENEFITS & ANOTHER ORGANISM IS NEITHER HARMED NOR BENEFITSSlide13
Whale & BarnacleSlide14
Egrets & CattleSlide15
MUTUALISM
SYMBIOTIC RELATIONSHIP IN WHICH BOTH ORGANISMS BENEFITSlide16
Clown Fish & AnemoneSlide17
Flowers & BeesSlide18
12C
Analyze the flow of matter & E through trophic levels using various models (food webs, food chains, and ecological pyramids).Slide19
AUTOTROPH
aka
PRODUCER
an organism that captures E from sunlight or chemicals & use it to produce its own food
ex: most plantsSlide20Slide21
HETEROTROPH
aka
CONSUMER
an organism that obtains E from the food it consumes
ex: humans, snakes, rhino, jaguarSlide22Slide23
PRIMARY CONSUMERSlide24
SECONDARY CONSUMERSlide25
TERTIARY CONSUMERSlide26
QUATERNARY
CONSUMERSlide27
HERBIVORE
Organism that obtains E from eating plantsSlide28
OMNIVORE
Organism that obtains E by eating both plants & animalsSlide29
CARNIVORE
Organism that obtains E by eating animalsSlide30
DETRITIVORE
aka
DECOMPOSER
Organism that feeds on dead plant & animal material & other dead matterSlide31
SCAVENGER
Animals that eat dead animals
Ex: Vultures, Tasmanian devilsSlide32
FOOD CHAIN
the sequence of who eats whom in a biological community (an ecosystem) to obtain nutrition.
starts with the primary energy
source
Ends with the top predatorSlide33
FOOD CHAIN
Quaternary consumer
Tertiary consumer
Secondary consumer
Primary consumer
ProducerSlide34Slide35Slide36Slide37
FOOD WEB
Let’s put some food chains together…Slide38Slide39
Label the organisms in your notes.
*organisms can have more than 1 label.Slide40
ECOLOGICAL PYRAMID
Represents the producers and consumers in an ecosystem in a pyramid shaped-diagram.Slide41Slide42
Where does all E come from?Slide43
As you go
up
trophic levels,
10% of Energy is lost. Why?Slide44Slide45
Most of the E is available at what level?Slide46Slide47Slide48Slide49
Biological Magnification
the increasing concentration of toxic substances within each successive link in the food chainSlide50
As you go up
trophic
levels, the number contaminants increases. Slide51Slide52
Fill in the boxes with dots to represent the toxic
contaminant
.Slide53
Do your boxes look like this?