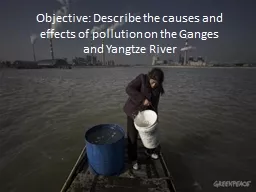
/
RECOGNIZING MEANDERS  TO RECONSTRUCT RIVER DYNAMICS OF THE GANGES E. A RECOGNIZING MEANDERS  TO RECONSTRUCT RIVER DYNAMICS OF THE GANGES E. A

RECOGNIZING MEANDERS TO RECONSTRUCT RIVER DYNAMICS OF THE GANGES E. A - PDF document

myesha-ticknor
myesha-ticknor . @myesha-ticknor
Follow
389 views
Uploaded On 2015-07-26

RECOGNIZING MEANDERS TO RECONSTRUCT RIVER DYNAMICS OF THE GANGES E. A - PPT Presentation

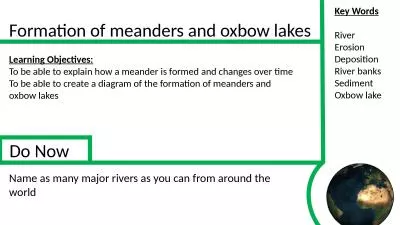
meander wavelength Wchannel width and Qflow discharge In the process of meander formation and displacement neck cutoffs take place so that meander bends are abandoned By comparing older meander ID: 93985

=meander wavelength W=channel width and

Share:

Link:

Embed:

Download Presentation from below link

Download Pdf The PPT/PDF document "RECOGNIZING MEANDERS TO RECONSTRUCT RIV..." is the property of its rightful owner. Permission is granted to download and print the materials on this web site for personal, non-commercial use only, and to display it on your personal computer provided you do not modify the materials and that you retain all copyright notices contained in the materials. By downloading content from our website, you accept the terms of this agreement.


Presentation Transcript

RECOGNIZING MEANDERS TO RECONSTRUCT RIVER DYNAMICS OF THE GANGES E. A. Addink*, M. G. KleinhansFaculty of Geosciences, Utrecht University, PO Box 80115, 3508 TC Utrecht, The Netherlands – (e.addink, m.kleinhans)@geo.uu.nl Commission VI, WG VI/4 KEY WORDS: river metrics, Landsat, Ganges delta, Bangladesh ABSTRACT: The long-term discharge evolution of branches of rivers can potentially be derived from inactive and fossil river meanders using relations between discharge and channel width and meander dimensions. This evolution is relevant for t =meander wavelength, W=channel width and Q=flow discharge. In the process of meander formation and displacement, neck cutoffs take place so that meander bends are abandoned. By comparing older meander bends with bends in the present channel, the change of discharge over time can be inferred. Given that time is needed for a river to adjust meander wavelength to a changing discharge regime, the rate of change relative to the minimum time needed for adaptation can be inferred. 1.3Channel metrics and remote sensingSatellite images show river channels, both active and fossil, very well. Images taken at low discharge moments are superior to images recorded at high discharge moments. Meanders may still be active and carry water, or they may have been abandoned and be in some revegetating state. Spectrally, they can show a wide range of values, thus limiting the viability of spectral analysis to delineate meanders. However, whatever land cover they might have, the shape of both active and fossil meanders is so characteristic that it is easily recognized in images by human eye. Since meanders are to be recognized on their shape, object-based image analysis seems a promising method to delineate them in satellite imagery. Once they have been delineated, their metrics and spectral behaviour can be analysed. For a larger project (in progress), we collected seven scenes from Landsat MSS and TM recorded in 1975, 1990 and 2000. By reconstructing the river dynamics for those years, we will gain insight in the discharge changes in the periods in between. The aim of this paper is the proof of concept that meanders can be delineated in satellite imagery using segmentation techniques. We will demonstrate how the meanders can be extracted from satellite images for a subset of the delta. Figure 1. Location of the study area outlined in black (source ESRI) 2.DATA AND METHODS 2.1Study area The area that we selected to develop the method is located in the western part of the Ganges delta. The largest part lies in West Bengal, India, while the eastern part extends into Bangladesh (figure 1). It measures 70*90 km. The landscape has been shaped by fluvial processes and is a patchwork of fossil meanders cross cut by active channels. The land cover stages of the fossil meanders range from open water to fully revegetated. Land use comprises mainly agricultural and some urban areas. Figure 2. Landsat TM image, 14 November 1990. RGB 453