/
The ASTEX The ASTEX

The ASTEX - PowerPoint Presentation

myesha-ticknor
myesha-ticknor . @myesha-ticknor
Follow
403 views
Uploaded On 2016-10-07

The ASTEX - PPT Presentation

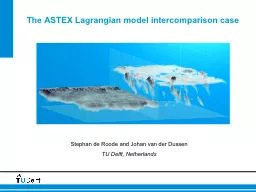
Lagrangian model intercomparison case Stephan de Roode and Johan van der Dussen TU Delft Netherlands The ASTEX First Lagrangian June 1992 Lagrangian evolution of cloudy boundary layer observed ID: 472436

ukmo cloud dharma sam cloud ukmo sam dharma astex les base scm layer ucladales height water large evolution divergence

Share:

Link:

Embed:

Download Presentation from below link

Download Presentation The PPT/PDF document "The ASTEX" is the property of its rightful owner. Permission is granted to download and print the materials on this web site for personal, non-commercial use only, and to display it on your personal computer provided you do not modify the materials and that you retain all copyright notices contained in the materials. By downloading content from our website, you accept the terms of this agreement.


Presentation Transcript

Slide1

The ASTEX Lagrangian model intercomparison case

Stephan de Roode and Johan van der DussenTU Delft, NetherlandsSlide2

The ASTEX First Lagrangian (June 1992)

 Lagrangian evolution of cloudy boundary layer observed  Five aircraft flights

Duration: two days

Flight 1

Flight 2

Flight 3

Flight 4

Flight 5Slide3

ASTEX observed stratocumulus to cumulus transition

Bretherton and Pincus, 1995Bretherton et al, 1995Duynkerke et al, 1995De Roode and Duynkerke, 1997

GCSS case,

1995

EUCREM/GCSS,

Duynkerke et al, 1999

like GCSS ATEX case,

Stevens et al, 2001

Study

of ASTEX First

Lagrangian

wtih

SCM and 2D models

by

Bretherton

et al, 1999

:

"

there

are

substantial

quantitative

differences

in the

cloud

cover and

liquid

water

path

between

models."Slide4

Satellite images Flights 1 and 5

precise position air mass during last flight uncertain

longitude

latitudeSlide5

ObservationsSlide6

Contents

 Motivation LES results Cloud

layer

depth

evolution

analysis

SCM results

Conclusions/outlookSlide7

ASTEX case: motivation

 stratocumulus to cumulus transition controled by - SST,

large-scale

divergence, inversion

stability

-> sensitivity tests

 Use ASTEX

observations to validate LES & SCM results

of a transition

 additional diagnostics

from

LES

-

eddy

diffusivity

,

PDFs

of heat and

moisture

,

mass

flux

statistics

, 3D

fields

Slide8

GCSS

ASTEX A209 case

,

1995

EUCREM/GCSS,

Duynkerke et al, 1999

Only

3~4

hours simulation time

current LES:

 Detailed microphysics

Multiband

radiation

Longer

simulation

time

Motivation

for

a

revised

ASTEX caseSlide9

Model initialization

Model set up and large-scale forcing

Large-scale

forcing

(SST & large-scale

subsidence) from

Bretherton et al.

(1995, 1999)  Model

initialization

from

Flight

2 (A209)

-

Identical

to

first

GCSS ASTEX "A209"

modeling

intercomparison

case

Microphysics

:

drizzle

and

cloud

droplet

sedimentation

Shortwave

and

longwave

radiation

ERA-Interim

Bretherton ERA-40

mean in ASTEX triangle

ERA-InterimSlide10

LES participants

LES model

Institution

Investigator

DALES

TU Delft

de

Roode

UCLA/MPI

MPI

Sandu

UKMO

UKMO

Lock

SAM

Univ

Washington

Blossey

DHARMA

NASA

Ackerman

Warschau

Warschau

KurowskiSlide11

Use SCM version that is identical to the operational GCM

SCM model

Institution

Investigator

RACMO

KNMI

dal

Gesso

EC-Earth

KNMI

dal

Gesso

ECMWF

ECMWF

Sandu

ECMWF-MF

DWD

Koehler

JMA

Japan

Kawai

PDF

based

scheme

Wisconsin

Larson

LMD GCM

LMD

Bony

UKMO

UKMO

Lock

Arpege

Meteo

France

Bazile

/Beau

MPI

ECHAM

SuvarchalSlide12

Contents

 Motivation LES results

Cloud

layer

depth

evolution analysis

SCM results

 Conclusions/outlookSlide13

Cloud boundaries: all LES models give cumulus under stratocumulus

Boundary

layer

too

deep compared

to observationsLast 10

hours of simulations are less

reliable (sponge layer

, coarser vertical

resolution

)

DHARMA

UKMO

SAM

UCLA

DALES

lowest

cloud

base

height

inversion

height

mean

cloud

base

height

DALES:

large

domain are

shownSlide14

Cloud liquid water path

Large

difference

in LWP!

DHARMA

UKMO

SAM

UCLA

DALESSlide15

Cloud cover

DHARMA

UKMO

SAM

UCLA

DALESSlide16

Surface precipitation

DHARMA

UKMO

SAM

UCLA

DALES

180 W/m

2

More heavy and

intermittent

precipitation

on

a

larger

domainSlide17

Entrainment rates in previous LES intercomparison runs

too large?

Heus

et

al

.

(2010) Slide18

Entrainment

Entrainment

rate

doubles

during the second night

Entrainment rate smaller

than during previous

ASTEX intercomparison case. According to

Ackerman

and

Bretherton

this

is

due

to

cloud

droplet

sedimentation

leading

to a

reduction

of

evaporative

cooling

at

cloud

top.

DHARMA

UKMO

SAM

UCLA

DALESSlide19

Liquid water potential temperature

Slight

differences

in the upper part of domain:

- DALES & UCLA

used ASTEX A209

specs with constant lapse

rate - ASTEX Lagrangian:

blend of observations and ERA 40 (needed

for radiation and

single-column

models)

DHARMA

UKMO

SAM

UCLA

DALESSlide20

Total water content

Mean

state

during

first

part of ASTEX Lagrangian is well

represented

DHARMA

UKMO

SAMUCLADALESSlide21

Liquid water content

last part of

simulation

: wrong

cloud

height

DHARMA

UKMO

SAMUCLADALESSlide22

East-west wind component

Change

in

geostrophic

forcing

well implemented

DHARMA

UKMO

SAMUCLA

DALESSlide23

North-south wind component

Do we need a

larger

weakening of the geostrophic

forcing

?

DHARMA

UKMO

SAMUCLADALESSlide24

Vertical wind velocity variance

DHARMA

UKMO

SAM

UCLA

DALESSlide25

Horizontal wind velocity variance

More

variance

at a

larger

horizontal domain

DHARMA

UKMO

SAM

UCLADALESSlide26

Horizontal wind velocity variance

DHARMA

UKMO

SAM

UCLA

DALES

More

variance

at a

larger

horizontal domainSlide27

Total water variance

Larger

horizontal domain

can

contain

more variance

DHARMA

UKMO

SAMUCLA

DALESSlide28

Precipitation

DHARMA

UKMO

SAM

UCLA

DALESSlide29

Jump in downward

longwave

rad

smaller in observationsSlide30

Longwave

down

Presence

of high

clouds

during

latter part of transition.A

larger longwave radiative

cooling rate

will cause a larger

entrainment

rate

and

deeper

boundary

layers

DHARMA

UKMO

SAM

UCLA

DALES

Obs

t

=36hSlide31

Shortwave down

UCLA: Solar zenith

angle

DALES:

Error in radiation

statistics of ASTEX

version of the model

DHARMA

UKMO

SAMUCLADALESSlide32

Estimate large-scale divergence from LES radiation in free atmosphere

Bretherton

and

Pincus

(1995)

Estimated

divergence = 2~3 10-6 s-1

during LagrangianSlide33

w

e (cm/s)LWP (g/m2)

Large-scale

divergence

,

entrainment

(w

e) and liquid

water path

(LWP)

In constant

divergence

run

stratocumulus

vanishes

, and

longwave

radiative

cooling

at

cloud

top

becomes

very

small

Slide34

Cloud cover (cc) and cloud boundaries

 Divergence decreasing: deep solid stratocumulus Divergence constant: shallow cumulus

lowest cloud base

average cloud base

average cloud topSlide35

Contents

 Motivation LES results Cloud

layer

depth

evolution

 SCM results

 Conclusions/outlookSlide36
Slide37

Cloud base height evolution

(

g

/kg)

z

(

m

)

q

sat

cloud

base

q

TSlide38

Cloud base height evolution

(

g

/kg)

z

(

m

)

q

T

cloud

base

q

satSlide39

Cloud base height evolution

(

g

/kg)

z

(

m

)

q

T

cloud

base

q

satSlide40

Tendencies in mixed layer

drizzleSlide41

Cloud base height evolutionSlide42

Cloud base and top height evolution

if

rad

cooling

Positive

w

("

upsidence

")

deepens

cloud

layer

!Slide43

Cloud base and top height evolution

r

c

p

w

q_

zbase= 11.3 W/m2rL

vwq_zbase = 60.0 W/m2

DLW= 74.0 W/m2Div = 5.0 10-6 s

-1zbase = 300 m, zi= 600 m

DqL =5K, Dq

T

= -1.1

g

/kg

increase

with

time of:

-

cloud

top

height

-

cloud

layer

depthSlide44

Example:

Dycoms

r

c

p

w

q_zbase

= 11.3 W/m2rLvwq

_zbase = 60.0 W/m2DLW= 74.0 W/m

2Div = 5.0 10-6 s-1zbase

= 500 m, zi= 800 mDq

L

=12K,

D

q

T

= -9.1

g

/kgSlide45

Contents

 Motivation LES results Cloud

layer

depth

evolution

 SCM

results

Conclusions/outlookSlide46

SCM cloud boundaries

Deepening

of

boundary

layer

is well representedSlide47

SCM LWP

Liquid water path

variation

is

largeSlide48

SCM total cloud coverSlide49

SCM surface precipitation

Similar diffusivities

for

moisture and heat?Slide50

East-west

wind velocitySlide51

East-west

wind velocitySlide52

Liquid

water potential temperatureSlide53

Liquid

water contentSlide54

SCM cloud fractionSlide55

Eddy

diffusivity

Do

SCMs

use

similar diffusivities

for moisture and heat?

LES

results

EUROCS FIRE

stratocumulusSlide56

What did we learnLES models

can reproduce bulk features of the observed cloud transition

-

mean

state and turbulence

structure

Entrainment

rate smaller than in

previous ASTEX intercomparison cases

Negative divergence

halfway the transition causes

deeper

cloud

layers

(

found

from

sensitivity

tests). Slide57

Problems and possible case refinementsToo

deep boundary layer1. change divergence

2.

downwelling

longwave radiation

: check moisture content in free

atmosphere - time varying upper

atmosphere?3. presence of high

clouds during the last part of the Lagrangian

4. domain size

Reduce

geostrophic

forcing

even

further

?

All models

need

to

use

same

initial

profilesSlide58

Outlook/suggestionsLES output

3D fields RadiationAll modelers should

provide a "

fingerprint

" of their

radiative

tranfer code by running

their codes for one

step using a few different thermodynamic profiles and

for different solar zenith

angles

Related Contents


Next Show more