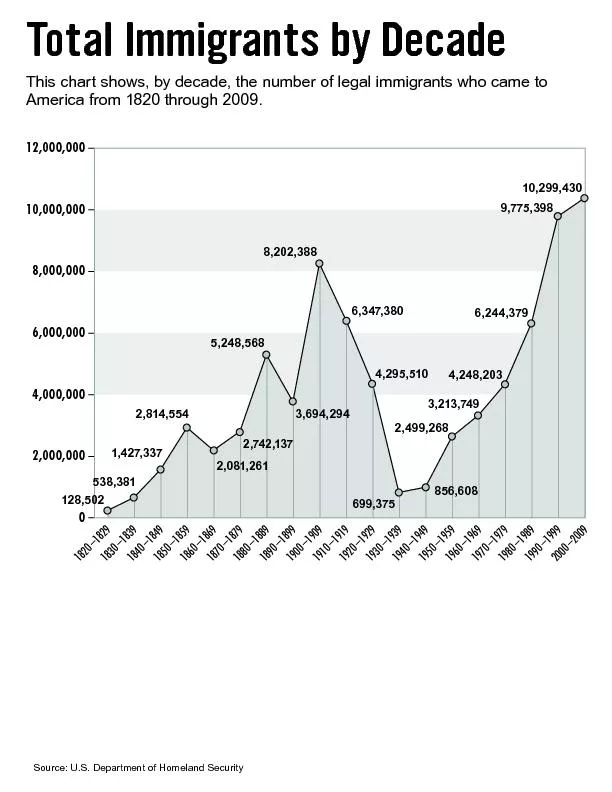
PDF-Total Immiants byDecadeThis chart shows, by decade, the number of lega
Author : myesha-ticknor | Published Date : 2016-03-11
18201501829183015018391840150184918501501859186015018691870150187918801501889189015018991900150190919101501919192015019291930150193919401501949195015019591960
Presentation Embed Code
Download Presentation
Download Presentation The PPT/PDF document "Total Immiants byDecadeThis chart shows,..." is the property of its rightful owner. Permission is granted to download and print the materials on this website for personal, non-commercial use only, and to display it on your personal computer provided you do not modify the materials and that you retain all copyright notices contained in the materials. By downloading content from our website, you accept the terms of this agreement.
Total Immiants byDecadeThis chart shows, by decade, the number of lega: Transcript
Download Rules Of Document
"Total Immiants byDecadeThis chart shows, by decade, the number of lega"The content belongs to its owner. You may download and print it for personal use, without modification, and keep all copyright notices. By downloading, you agree to these terms.
Related Documents