/
Utilizing Nephelometers for Near Roadside Utilizing Nephelometers for Near Roadside

Utilizing Nephelometers for Near Roadside - PowerPoint Presentation

myesha-ticknor
myesha-ticknor . @myesha-ticknor
Follow
349 views
Uploaded On 2018-12-16

Utilizing Nephelometers for Near Roadside - PPT Presentation

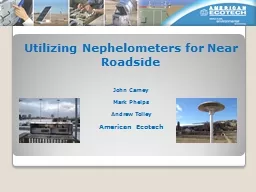
John Carney Mark Phelps Andrew Tolley American Ecotech Roadside Monitoring Nephelometers 101 Light trap Sample outlet Sample inlet Temp RH sensor Measurement bench Reference shutter motor ID: 741985

led light source scattering light led scattering source data nephelometer field particulate monitors evolution visibility range visual particles measurement

Share:

Link:

Embed:

Download Presentation from below link

Download Presentation The PPT/PDF document "Utilizing Nephelometers for Near Roadsid..." is the property of its rightful owner. Permission is granted to download and print the materials on this web site for personal, non-commercial use only, and to display it on your personal computer provided you do not modify the materials and that you retain all copyright notices contained in the materials. By downloading content from our website, you accept the terms of this agreement.


Presentation Transcript

Slide1

Utilizing Nephelometers for Near RoadsideJohn CarneyMark PhelpsAndrew TolleyAmerican EcotechSlide2

Roadside MonitoringSlide3

Nephelometers 101

Light trap

Sample outlet

Sample inlet

Temp RH sensor

Measurement bench

Reference shutter motor

PMT,HV supply,

pre amp

PMT signal

LED module

Pressure sensorSlide4

Nephelometer ReadingsSlide5

Total light extinction = light scattering + light absorption • Light scattering by particles (bsp) - Urban visibility field studies

indicated that particles ≤ to 2.5 microns in aerodynamic diameter (PM2.5) cause the vast majority of light scattering.• Atmospheric, or Rayleigh scattering (bRayleigh)

is natural scattering not related to air

particulate.

Light absorption

-

due

to particles and gases, and is determined by analysis of elemental carbon

.

A

nephelometer

measures the light scattering component of light extinction.Nephelometers 101Slide6

Inverse Megameter (Mm-1) is the direct measurement unit for visibility impairment data. It is the amount of light scattered and absorbed as it travels over a distance of one million meters.Visual range (VR)

- Visual range is an expression of visibility impairment defined as the distance in miles or kilometers at which a large, black object just disappears from view. Visual range values are calculated from direct measurement data, or are estimated directly by observers. Visual range can be calculated from extinction data as follows: Visual Range (km) = 3912 / bext(Mm-1)

Mass Concentration (mg/m

3

µg/m

3

)

Nephelometer UnitsSlide7

The first generation in LED Light Source introduced in 2002

Evolution of LED Light Source

Three WavelengthSlide8

Next Generation of LED Lightsource

Evolution of LED Light SourceSlide9

AdvantagesStable light intensity Stable light wavelength generationBandpass filters not requiredNegligible thermal interference during measurementMinimal mthly maint. (<10

minutes per month!)

Evolution of LED Light SourceSlide10

Disadvantage – Geometry of light source and diffusion lens led to an uneven light distribution within measurement cell

Evolution of LED Light Source

Result – Over estimation of scattering coefficients (by up to 10%)Slide11

Opal Diffuser in front of LED array

Evolution of LED Light Source

Result – Light intensity approaching Lambertian distribution resulting in negligible error.Slide12

New Generation of LED LightsourceFewer LEDs – Three lamps per wavelengthCompact Light SourceFurther reduction in measurement bench heating (between sample and ambient temperature)User adjustable intensity pots (extend lifetime of light source)Fully field serviceableBackwards compatible with older units.

Evolution of LED Light SourceSlide13

Near Roadside MonitoringDust MonitoringForest Fire/Smoke MonitoringPM Correlation MonitoringSolar Energy Site Assessment and Operation

Field ApplicationsSlide14

Near Roadside

I-40 Station – Raleigh

Gas Analyzers (NOx, Ozone)

Particulate Monitors (BAM,

Aethalometer

, Ultrafine)

Samplers (passive, TSP)Slide15

InstallationSlide16

InstallationSlide17

Preliminary DataSlide18

Preliminary DataSlide19

Preliminary DataSlide20

Preliminary DataSlide21

Dust Monitoring

Sydney Dust Storm – September 2009Slide22

New South Wales EPA Air Monitoring NetworkSlide23

Field ApplicationsSlide24

Field ApplicationsSlide25

Field Applications

Victoria EPA Forest Fire alert categories based on PM10 and visibilitySlide26

Smoke Monitoring

Pollutants

Ozone

O3

Ozone

O3

Nitrogen

dioxide

NO2

Visibility

NEPH

Carbon

monoxide

CO

Sulfur

dioxide

SO2

Particles

PM10

Particles

PM2.5Averaging Periods1-houraverage

4-hour

rollingaverage1-houraverage1-houraverage

8-hour

rollingaverage1-houraverage

24-hourrolling

average24-hourrollingaverageSydney East

Randwick

2.51.40.4

0.37

 0.4

24


Rozelle

2.4

1.3

0.5

0.46

0.3


24.9


Lindfield

2.2

1.2

0.5

0.35


0.1

19.8


Chullora

2.5

1.1

0.9

0.39

0.4

0.1

23.4

12.2

Earlwood

2.8

1

0.8

0.43


25

11.6

Sydney North-west

Richmond

2.9

1.4

0.4

1


0

28

17.4

St Marys

4.1

1.8

0.7

5.43


34.7


Vineyard

2.7

1.3

0.3

0.52


0

24.6


Prospect

2.9

1.4

0.6

0.74

0.2

0.1

27.5


Sydney South-west

Bargo

3.7

1.7

0.7

13.12


0.2


Bringelly

3.1

1.5

0.3

2.16


0.1

31.9


Camden

3.1

1.5

0.4

3.17

0.3


37.4

24.7

Campbelltown West

3.2

1.5

0.6

2.2

0.6

0.1

26.4


Liverpool

2.9

1.3

0.6

0.68

0.5


29.1

19.4

Oakdale

4.6

2.9

0.6

11.16


 72.3 IllawarraWollongong3.42.60.31.360.50.131.628.7Kembla Grange420.45.02  66.9 Albion Park Sth4.42.40.66.23 0.162.6 Lower HunterWallsend2.31.40.40.51 0.122.313.1Newcastle2.31.80.50.390.10.927.1 Beresfield1.70.90.70.78 035.5 Central CoastWyong2.9 0.20.50.20.122.214.5Central TablelandsBathurst      63.7 North-west SlopesTamworth      12.7 South-west SlopesAlbury      27.9 Wagga Wagga Nth      72.645.1Upper Hunter - MuswellbrookMuswellbrook  0.5  0.132.313Upper Hunter - SingletonSingleton  1.1  0.128.910.8         Air Quality Index  VERY GOODGOODFAIRPOORVERY POORHAZARDOUS

New South Wales Air Quality October 20, 2013 8:00 – 9:00 AEST Brush Fire EventNephelometer – hourly average based on 1 or 5 minute (high frequency) data, capturing smoke event as it occursSlide27

Smoke MonitoringSlide28

Portable FunctionalitySlide29

Correlation of Nephelometers

Correlation of PM2.5 measurements and scattering coefficients

Puget Sound Clean Air Agency Study – Residential Area

Collocated Instruments:

American Ecotech Nephelometer

Radiance Research (RR) Nephelometer

Partisol (FRM) for PM

2.5

TEOM with PM

2.5

head

TEOM (FDMS-TEOM) PM

2.5

head

BAM 1020 PM

2.5Slide30

FRM vs. Nephelometer

Particulate MonitorsSlide31

FDMS TEOM vs. Nephelometer

Particulate MonitorsSlide32

BAM vs. Nephelometer

Particulate MonitorsSlide33

ResultsNephelometer correlates well(r2 > 0.94) with:The US Federal Reference MethodFDMS-TEOMFEM Beta Attenuation Monitor

Particulate MonitorsSlide34

Continuous Correlation – Aurora Neph and BAM-1020

Particulate MonitorsSlide35

Renewable Energy Field

Courtesy of yesRenewablesSlide36

Site Evaluation involves up to a year long study of site conditions. Parameters to measure include:Solar IntensityLight DurationCloud CoverLight Scattering

Solar Site EvaluationSlide37

Solar Tower

Courtesy AMBLSlide38

Evaluate degree of light scattering of both incoming light and reflected light.Need to evaluate scattering at several levels covering the height of the planned tower

Solar Site EvaluationSlide39

Sue Kimbrough and Richard Snow – USEPA Office of Research and Development

Acknowledgments Slide40

Email: jcarney@americanecotech.comWeb: www.AmericanEcotech.com

Contact information