/
ASCENDS End-to-End System Performance Assessment: Analysis ASCENDS End-to-End System Performance Assessment: Analysis

ASCENDS End-to-End System Performance Assessment: Analysis - PowerPoint Presentation

natalia-silvester
natalia-silvester . @natalia-silvester
Follow
402 views
Uploaded On 2015-12-05

ASCENDS End-to-End System Performance Assessment: Analysis - PPT Presentation

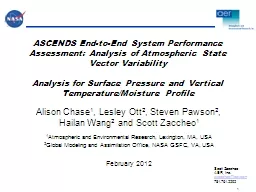
Analysis for Surface Pressure and Vertical TemperatureMoisture Profile Alison Chase 1 Lesley Ott 2 Steven Pawson 2 Hailan Wang 2 and Scott Zaccheo 1 1 Atmospheric and Environmental Research Lexington MA USA ID: 214841

surface analysis comparison pressure analysis surface pressure comparison error forecast model data gfs differences observations temperature vapor water variability

Share:

Link:

Embed:

Download Presentation from below link

Download Presentation The PPT/PDF document "ASCENDS End-to-End System Performance As..." is the property of its rightful owner. Permission is granted to download and print the materials on this web site for personal, non-commercial use only, and to display it on your personal computer provided you do not modify the materials and that you retain all copyright notices contained in the materials. By downloading content from our website, you accept the terms of this agreement.


Presentation Transcript

Slide1

ASCENDS End-to-End System Performance Assessment: Analysis of Atmospheric State Vector VariabilityAnalysis for Surface Pressure and Vertical Temperature/Moisture Profile

Alison Chase

1

, Lesley Ott

2

, Steven Pawson

2

,

Hailan

Wang

2

and Scott Zaccheo

1

1

Atmospheric and Environmental Research, Lexington, MA, USA

2

Global Modeling and Assimilation Office, NASA GSFC, VA, USA

February 2012Slide2

OutlineObjectivesMethodologyNWP model comparisonsNWP analysis

vs

forecast comparisons

Comparisons of

model

data to

in situ

measurements

Summary

Next StepsSlide3

ObjectivesObjectivesDevelop a common set of error characteristics for atmospheric state variables that impact the ASCENDS missionSurface Pressure

(Dry

Air Surface Pressure)

Vertical moisture and temperature profiles

Assist in addressing the question

Are standard analysis/model fields adequate for the ASCENDS mission?

Provide common baseline statistics and metrics for

Use in OSSEs

Instrument sensitive studies

Potentially

provide bounds for

source selection criteria

Note: Contributors are currently working on collecting current analyses into a summary report.Slide4

MethodologyInter-comparison of standard analysis/model fieldsModels Deterministic: ECMWF,GEOS-5, NCEP-GFS and WRF

Ensembles: NCEP-GFS

Scales: 5km-0.5° resolution

Temporal variability: Representative time periods (week/month) for each season

Comparison of standard analysis/model data with

in situ

measurements

Analysis/Models: GFS, MERRA and WRF

analysis

and

forecast fields

Observations: Surface, aircraft and

radiosonde

dataSlide5

Surface Pressure Error CharacterizationExample GFS Analysis

Comparison for 0.5º GFS analysis

-forecast field for single week in January

Typical

difference < 0.8

mbars

however non trivial number of differences excess of 2

mbarsSlide6

Surface Pressure Error CharacterizationExample Model Inter-Comparison

Comparison for MERRA, NCEP and ECMWF global analysis data

Variability in surface pressure are greatest over land and mid-high latitude oceans

Variability of dry and moist surface pressure is similar indicating that water vapor is not the main factor driving surface pressure variabilitySlide7

Model Based

Surface Pressure

Example Error

PDFs/CDFs

Blue

: Absolute differences between ECMWF and MERRA

Red

: Absolute differences between NCEP and MERRA

PDFs of Absolute Differences in Surface Pressure

CDFs of Absolute Differences in Surface Pressure

All Cells

Clear Cells

Solid Line

: GFS analysis-forecast surface pressure

Dotted Line

: GFS analysis-forecast dry air surface pressure

Ocean

Land

Land

OceanSlide8

Surface Pressure Error Characterization

Observations

-Analysis

Comparison

Comparison of

surface observations and

m

esoscale

analysis for ~3 million observations between 2006-07

Comparisons

include adjustments of NWP data to station height based on lapse rateSlide9

T/Water Vapor

Error Characterization

Example Analysis-Forecast

Comparison

Comparison of

January 2009

GFS

analysis – forecast profile data

Unrealistic estimates of temperature and water vapor error characteristics

May however provided reasonable covariance matrices that can be scaled to describe correlated error characteristics for sensitivity studies

Temperature [K]

WV Mixing Ratio [g/kg]Slide10

T/Water Vapor

Error Characterization

Example Observation/

Analysis

Comparison

Comparison of

observations with MERRA analysis data

Temperature and water vapor observation from

radiosonde

and aircraft data

Solid blue profile represents average observation – analysis and horizontal lines indicate one standard deviation.

Dashed red profile represents average differences between observations and input forecast fieldsSlide11

SummarySurface PressureAnalysis – Forecast analysis provide an optimistic estimate observed error

Inter model comparison show non trivial differences between model implementations

Strongly influenced by topography effects

Slight increase in variability of dry-air surface pressure over moist surface pressure

Temperature and Moisture Profile Errors

Analysis – Forecast analysis under estimate observed error

Comparison to

radiosonde

and aircraft data provide better estimate of model errors, but may not adequate capture correlated errors