/
Attribute Expression of using Gray Level co-occurrence Attribute Expression of using Gray Level co-occurrence

Attribute Expression of using Gray Level co-occurrence - PowerPoint Presentation

natalia-silvester
natalia-silvester . @natalia-silvester
Follow
382 views
Uploaded On 2016-06-16

Attribute Expression of using Gray Level co-occurrence - PPT Presentation

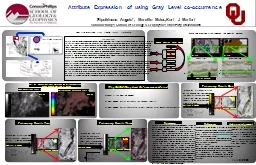
Sipuikinene Angelo Marcilio MatosKurt J Marfurt ConocoPhillips School of Geology amp Geophysics University of Oklahoma Real life examples from Osage County Oklahoma 3D Survey location What is the Goal of GLCM ID: 364745

texture seismic channel slice seismic texture slice channel attributes glcm horizon oswego chester figure 425ms volume time attribute frequency

Share:

Link:

Embed:

Download Presentation from below link

Download Presentation The PPT/PDF document "Attribute Expression of using Gray Level..." is the property of its rightful owner. Permission is granted to download and print the materials on this web site for personal, non-commercial use only, and to display it on your personal computer provided you do not modify the materials and that you retain all copyright notices contained in the materials. By downloading content from our website, you accept the terms of this agreement.


Presentation Transcript

Slide1

Attribute Expression of using Gray Level co-occurrence

Sipuikinene Angelo*, Marcilio Matos,Kurt J Marfurt

ConocoPhillips School of Geology & Geophysics, University of Oklahoma

Real life examples from Osage County Oklahoma

3-D Survey location

What is the Goal of GLCM?

Does GLCM better delineate the channel infill?

Does GLCM better correlated to well control (e.g. porosity-thickness)?

Seismic Data

Interpretation

Flatten

Export Data

Attributes

GLCM Matrix

Interpretation

Petrel

AASPI

Petrel

Time and Horizon slice showing the Chester Channel

AASPI Routine Flow Chart

Time slice

Horizon slice

A’

A

B

B’

425ms

425ms

Test of Conventional RMS Amplitude and Instantaneous Frequency Along Oswego Horizon at 425ms

425 ms

425 ms

Instantaneous Frequency Time slice

RMS Amplitude Time slice

Chester channel

Introduction

Future exploration for hydrocarbons can be aided by looking for small sands using advanced exploration techniques, including seismic attributes, to better delineate sands that are at the limits of seismic resolution. A variety of seismic attributes have been used by the oil industry to better delineate reservoir properties. RMS Amplitude, peak spectral frequency, and coherence are some commercial attributes that companies have long been using. Chopra and Marfurt (2007) provide a good review of the implementation and use of these attributes. For this case study, texture-attribute analysis was used to run on a 3D seismic sub-volume comprised of the zone of interest above the Oswego horizon that delineates the Chester channels. The resulting texture calculations provided a clearer picture of the distribution, volume, and connectivity of the hydrocarbon- bearing facies in the channel- looking reservoir. Figure 4 depicts the GLCM variance, Contrast, and energy. Dissimilarity and homogeneity, entropy, mean and correlation attributes provide complementary images.

These attributes, compared to the conventional instantaneous frequency on the Oswego time slice at 500ms better delineate the Chester channel system above the Oswego horizon. Figure 4a shows most of the high values of variance concentrated on the edges of the Chester channel and most of the low values concentrated away from and in the channel.

I interpret these high variance on the edges of the channel are associated with levies. Figure 4a ), the variance, shows that there is not that much difference from the dissimilarity, but does show more detail along the edges of the channel compared to the dissimilarity. Most of the variables calculated in this ongoing study, look similar to each other; however, each of them have characteristics that can be used as a training data to generate a more sophisticated reservoir model. I propose to correlate these seismic textures to geology using point well control and modern self-organizing map clustering technology (Matos, 2007).

Why GLCM(Gray Level Co-occurrence Matrix?

Preliminary Results One

Figure 4a:

Flattened strata slice of the Oswego horizon showing the Chester channel with poor resolution. Most of the energy appears to be clustered around

(.65 c/s)

or Hz.


Variance + GLCM

425ms

~10ml

Oswego

Horizon slice

~10km

Oswego

Horizon slice

Summary

Figure 4b.

Stratal slice through a Chester channel showing (a) high contrast along the levee complex

.

Contrast + GLCM

Preliminary Results Two

425ms

~10ml

Oswego

Horizon slice

Energy+ GLCM

425ms

Preliminary Results Three

Figure 4c:

The high values of energy are mostly concentrated where amplitudes are disordered as like around the levee complex

References

Bahorich, M. S. and Bridges, S. R., 1992, the seismic sequence attribute map (SSAM): 62nd Annual Internet. Mtg., Soc. SEG, Expanded Abstracts,

92

, 227-230.

Blow, J., 2007, ….? (<

http://www.fp.ucalgary.ca

/

>, last updated February 2007).

Chopra, S., and V. Alexeev, 2006, Applications of texture attribute analysis. to 3D seismic data: The Leading Edge,

25

, 934–940.

Coleou,… 2004.,,,,

Gao, D., 2002, Seismic texture aid exploration: Offshore Angola Journal, .

62

, p.65.


Gao, D., 2003, Volume texture extraction for 3-D seismic visualization and interpretation: Geophysics,

68

, Texture Discrimination based on an optimal utilization of texture features. Pattern recognition vol. 21 no. 2 pp. 141-146.

Acknowledgement

Seismic stratigraphy and seismic geomorphology is based on human interpreter identification of subtle textures, such as onlap, offlap, unconformities, hummocky clinoforms,, and parallelism. GLCM technology is a preliminary attempt at quantifying these relationships for further analysis using a computer. It is important to define and link textures in seismic and stratigraphic domains. In the stratigraphic domain, a texture is a composite function of stratigraphic facies attributes that include, among others, lithology and bed thickness, and sand-to-shale ratio in a mini rock volume (stratigraphic texture element). In the seismic domain, a texture is a composite function of seismic attributes that include, among others, amplitude, frequency, continuity, and waveform of a mini seismic volume (seismic texture element). Texture attributes summarize the properties of the gray-level co-occurrence matrices, the most popular being energy entropy), contrast, and homogeneity Texture attributes, hold significant promise in quantifying geological features such as mass complex transport, amalgamated channels, and dewatering features that exhibit a distinct lateral pattern beyond simple edges.

?

I would like to thank all the sponsors of the Attribute Assisted Seismic Processing and Interpretation Consortium for their support. I also would like to thank my fellow colleagues for their imputes

.

 Zhang Kui, Brad Wallet, Tim Kwiatkowski and Ha Mai thank you.

11/18/2008