/
What is  Valgrind ? For our purposes here, it's a front end for managing a collection What is  Valgrind ? For our purposes here, it's a front end for managing a collection

What is Valgrind ? For our purposes here, it's a front end for managing a collection - PowerPoint Presentation

natalia-silvester
natalia-silvester . @natalia-silvester
Follow
365 views
Uploaded On 2018-02-27

What is Valgrind ? For our purposes here, it's a front end for managing a collection - PPT Presentation

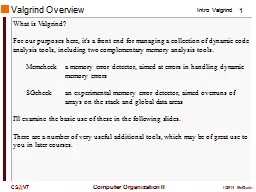
Memcheck a memory error detector aimed at errors in handling dynamic memory errors SGcheck an experimental memory error detector aimed overruns of arrays on the stack and global data areas ID: 637790

bytes 7962 valgrind 30547 7962 bytes 30547 valgrind main int blocks 30506 leak memory malloc error sprintf extensive heap

Share:

Link:

Embed:

Download Presentation from below link

Download Presentation The PPT/PDF document "What is Valgrind ? For our purposes her..." is the property of its rightful owner. Permission is granted to download and print the materials on this web site for personal, non-commercial use only, and to display it on your personal computer provided you do not modify the materials and that you retain all copyright notices contained in the materials. By downloading content from our website, you accept the terms of this agreement.


Presentation Transcript

Slide1

What is Valgrind?For our purposes here, it's a front end for managing a collection of dynamic code analysis tools, including two complementary memory analysis tools: Memcheck a memory error detector, aimed at errors in handling dynamic memory errors SGcheck an experimental memory error detector, aimed overruns of arrays on the stack and global data areasI'll examine the basic use of these in the following slides.There are a number of very useful additional tools, which may be of great use to you in later courses.

Valgrind

OverviewSlide2

Memory Management Errors

#include <stdlib.h>

void f();

int main() { f(); return 0;}void f() { int* x = malloc(10 * sizeof(int)); x[10] = 0;}

Here's a simple C program with an obvious off-by-one access error to an array, followed by a memory leak:Slide3

Out-of-bounds Array Access

Linux>

valgrind

--leak-check=full a1==30506== Memcheck, a memory error detector==30506== Copyright (C) 2002-2012, and GNU GPL'd, by Julian Seward et al.==30506== Using Valgrind-3.8.1 and LibVEX; rerun with -h for copyright info==30506== Command: a1==30506== ==30506== Invalid write of size 4==30506== at 0x4004F7: f (a1.c:14)==30506== by 0x4004D1: main (a1.c:7)==30506== Address 0x4c28068 is 0 bytes after a block of size 40 alloc'd==30506== at 0x4A069EE: malloc (vg_replace_malloc.c:270)

==30506== by 0x4004EA: f (a1.c:13)

==30506== by 0x4004D1: main (a1.c:7)

. . .

. . .void f() { int* x = malloc(10 * sizeof(int)); x[10] = 0;}Slide4

Memory Leak

. . .

==30547== HEAP SUMMARY:

==30547== in use at exit: 40 bytes in 1 blocks==30547== total heap usage: 1 allocs, 0 frees, 40 bytes allocated==30547== ==30547== 40 bytes in 1 blocks are definitely lost in loss record 1 of 1==30547== at 0x4A069EE: malloc (vg_replace_malloc.c:270)==30547== by 0x4004EA: f (a1.c:13)==30547== by 0x4004D1: main (a1.c:7). . .

. . .

void f() {

int* x = malloc(10 * sizeof(int));

x[10] = 0;}Slide5

Out-of-bounds Array Access

. . .

==30547== HEAP SUMMARY:

==30547== in use at exit: 40 bytes in 1 blocks==30547== total heap usage: 1 allocs, 0 frees, 40 bytes allocated==30547== ==30547== 40 bytes in 1 blocks are definitely lost in loss record 1 of 1==30547== at 0x4A069EE: malloc (vg_replace_malloc.c:270)==30547== by 0x4004EA: f (a1.c:13)==30547== by 0x4004D1: main (a1.c:7). . .

. . .

void f() {

int* x = malloc(10 * sizeof(int));

x[10] = 0;}Slide6

The following options are often very useful:--leak-check=fullDisplay of details related to each leak that was detected.--show-leak-kinds=allPossible kinds of leaks include possible, indirect, definite, and reachable.

--track-origins=yes

Track the origins of uninitialized values that have been used.

–vBe verbose...--log-file=filenameWrite valgrind output to specified file instead of stdout.Of course, see the valgrind man page for even more information and options.Some Valgrind OptionsSlide7

Extensive Example: Invalid writes/readsThe following example is derived from a common project used in CS 2506.

Linux>

valgrind

--leak-check=full --show-leak-kinds=all --log-file=vlog.txt --track-origins=yes -v disassem C3TestFiles/ref07.o stu_ref07.asm. . .==7962== Invalid write of size 1. . .==7962== by 0x401575: main (Disassembler.c:225)==7962== Address 0x51f6845 is 0 bytes after a block of size 5 alloc'd==7962== at 0x4C2B974: calloc (in /usr/lib64/valgrind

/

vgpreload_memcheck

-

amd64-linux.so)==7962== by 0x401522: main (Disassembler.c:222)==7962== Invalid read of size 1. . .==7962== Address 0x51f6845 is 0 bytes after a block of size 5 alloc'd==7962== at 0x4C2B974: calloc (in /usr/lib64/valgrind/vgpreload_memcheck- amd64-linux.so)==7962== by 0x401522: main (Disassembler.c:222)

We see that two invalid memory accesses have been detected, each involving one byte.Slide8

Extensive Example: Invalid writes/readsHere are the cited lines of C source code:The logic error is fairly obvious:- 222: a char array of dimension 5 is allocated and zero'd; used in the normal way, this should hold no more than 4 user characters, allowing room for the terminator

- 225: more than 4 characters are written to (and beyond the end of) the array

Label

- 228: since strcpy() depends on the terminator, it reads past the end of the array LabelThis error is pernicious because it did not result in any sort of runtime error (although it may very well have resulted in incorrect results).

. . .

222 char

*Label

= calloc(5, 1);. . .225 sprintf(Label, "%5s%02d:%7s", "V", Index, ".word");. . .228 strcpy(Labels[Line], Label);Slide9

Extensive Example: Uninitialized ValuesValgrind detects a different kind of error:

. . .

==

7962== Conditional jump or move depends on uninitialised value(s). . .==7962== by 0x4010AB: main (Disassembler.c:155)==7962== Uninitialised value was created by a stack allocation==7962== at 0x400B5D: main (Disassembler.c:40)Now, the source of the error in line 155 may be less clear.

.

. .

39

int main(int argc, char** argv) 40 { . . .155 sprintf(

currLine

, "%s%8s",

jT

->Mnemonic

,

Name);

.

. .

One relevant fact is that

sprintf

()

depends on terminators to determine the ends of the two strings it prints...Slide10

Extensive Example: Uninitialized ValuesExamining the creation of the two strings suggests where the problem may lie:Now, in line 149, sprintf() will not write a terminator to Name[].

Therefore, in line 155,

sprintf

() will not find a terminator at the correct place in Name[].As for Mnemonic, we'd have to examine more code to decide if it's a problem as well. . . .

39

int

main(

int argc, char** argv) 40 { . . .137 JType *jT = parseJT(currLine);138 char Name[100]; . . .149

sprintf

(Name

, "%s%02d", "L",

Index

);

.

. .

155

sprintf

(

currLine

, "%s%8s",

jT

-

>Mnemonic,

Name

);

.

. .Slide11

. . .

==

7962== 7 bytes in 1 blocks are definitely lost in loss record 1 of 26

==7962== at 0x4C2B974: calloc (in /usr/lib64/valgrind/vgpreload_memcheck- amd64-linux.so)==7962== by 0x4020B3: parseJTypeInstruction (ParseInstructions.c:178)==7962== by 0x400F51: main (Disassembler.c:137)Extensive Example: Memory LeakValgrind also detects a number of bytes have not been properly deallocated:

. . .

==7962== HEAP SUMMARY:

==7962== in use at exit: 4,842 bytes in 331 blocks

==7962== total heap usage: 331 allocs, 0 frees, 4,842 bytes allocated==7962== ==7962== Searching for pointers to 331 not-freed blocks==7962== Checked 111,584 bytes. . .Here are the details reported for one leak:Slide12

Extensive Example: Memory LeakValgrind also detects a number of bytes have not been properly deallocated:This one's easy to fix, with a little thought about just how we want the responsibilities to be factored into the code.

.

. .

178 char* Code = calloc(7, 1); <--- allocates a block179 opCode = getCode

(MI

); <---

leaks the block

. . .Slide13

Extensive Example: Leak SummaryHere's a less than ideal leak summary:

. . .

==7962== LEAK SUMMARY:

==7962== definitely lost: 3,116 bytes in 233 blocks==7962== indirectly lost: 590 bytes in 96 blocks==7962== possibly lost: 0 bytes in 0 blocks==7962== still reachable: 1,136 bytes in 2 blocks==7962== suppressed: 0 bytes in 0 blocks==7962== ==7962== ERROR SUMMARY: 116 errors from 34 contexts (suppressed: 2 from 2). . .But with Valgrind's help, we should be able to hammer out all of the leaks.Slide14

Bibliography

I used the following sources for the preceding notes:

The Valgrind Documentation Release

, 3.9.0.31 October 2013

http://www.valgrind.org/