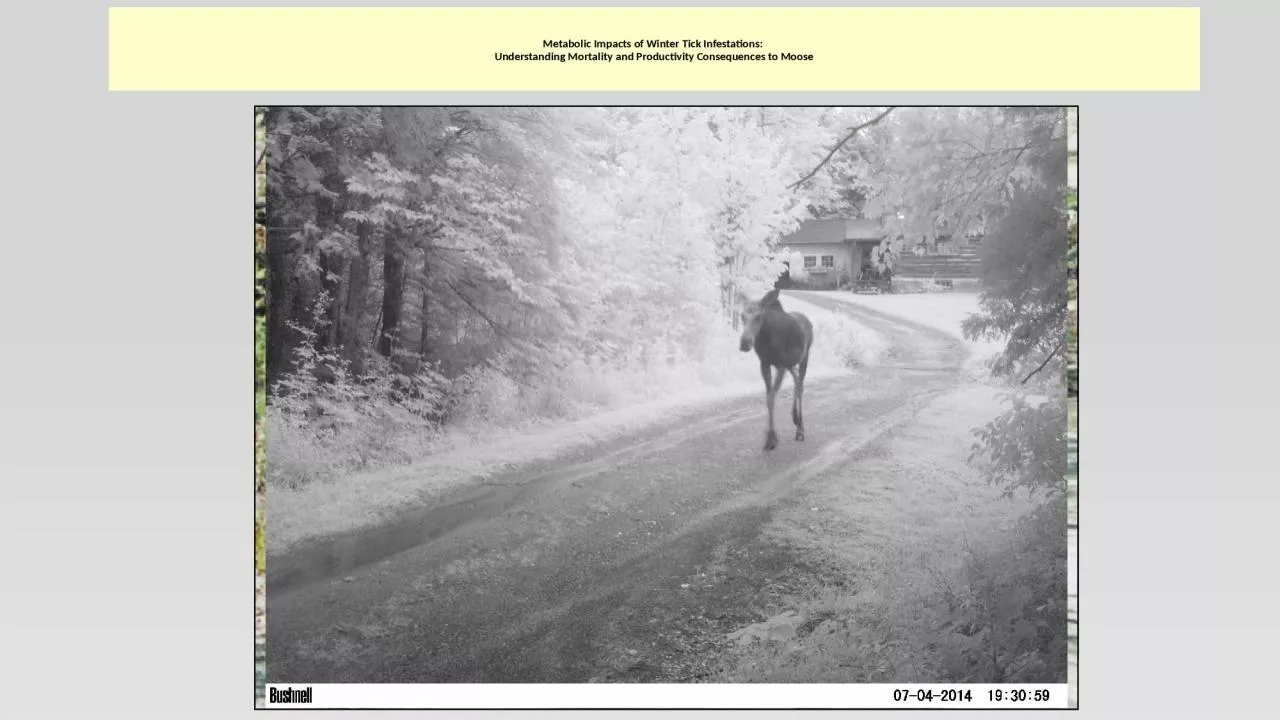
/
Metabolic  Impacts of Winter Tick Infestations: Metabolic  Impacts of Winter Tick Infestations:

Metabolic Impacts of Winter Tick Infestations: - PowerPoint Presentation

natalie
natalie . @natalie
Follow
342 views
Uploaded On 2022-06-11

Metabolic Impacts of Winter Tick Infestations: - PPT Presentation

Understanding Mortality and Productivity Consequences to Moose g Population Modeling New Hampshire 20022005 Model I radiomarked fecundity and Model II harvest fecundity using ID: 917357

cost 000 body amp 000 cost amp body moose tick weight mortality ticks survival model productivity energy calves cows

Share:

Link:

Embed:

Download Presentation from below link

Download Presentation The PPT/PDF document "Metabolic Impacts of Winter Tick Infest..." is the property of its rightful owner. Permission is granted to download and print the materials on this web site for personal, non-commercial use only, and to display it on your personal computer provided you do not modify the materials and that you retain all copyright notices contained in the materials. By downloading content from our website, you accept the terms of this agreement.


Presentation Transcript

Slide1

Metabolic

Impacts of Winter Tick Infestations: Understanding Mortality and Productivity Consequences to Moose

Slide2

gPopulation Modeling: New Hampshire 2002-2005

Model I

(radio-marked fecundity)

and Model II (harvest fecundity) using

(

a)

lower 95% CI of winter survival rate of calves and yearling/adults and

(b)

lower 95% CI of fall survival rate of yearling/adults

a) Model II

(λ=0.98)

b) Model

II (λ=1.01)

Model I (λ=0.97)

Model I (λ=0.95)

NH moose population has dropped about 40-50% since….

who

would of thought

??? Why? The high frequency of winter tick epizootics since 2005 (5 since 2008, 3 successive in 2014-2016).The impacts on calf survival & productivity mimics the worst situation (Model I radio-marked).

Slide3

A continued decline in

corpora

lutea count and body weight of yearling cows occurred from 1988-1998 to 2005-2009 in New Hampshire. Ovulation requires field-dressed weight >200 kg.

Physical Characteristics and Reproduction

We can’t even generate these data anymore…..

Slide4

HIGH MORTALITY IN YOUNG, DELAYED MATURITY, DECLINING BODY WEIGHTS

– CHARACTERISTICS OF A POPULATION WELL ABOVE K/NUTRITIONALLY DEPRIVED

HABITAT QUALITY AND QUANTITY ARE NEAR OPTIMAL

SO WHAT OF HABITAT – 4-16 year regen?

Slide5

FOREST DAMAGE STUDIES – NH, VT, ME


Vigor


Form

R1

R2

R3

R4

Form Totals

F1

0.39

0.110.010.000.51

F20.13

0.130.000.00

0.27F3

0.01

0.010.00

0.00

0.03F40.000.000.000.000.01

F5

0.00

0.01

0.00

0.00

0.02

F6

0.03

0.04

0.00

0.00

0.07

F7

0.01

0.01

0.00

0.00

0.02

F8

0.03

0.04

0.00

0.000.07Vigor Totals0.600.360.010.011.00

Table 2. Proportional distribution of form and vigor ratings as assigned by the

New Brunswick classification protocol in older stands (>30 years old).

The majority of trees were F1/F2 (78%) or R1/R2 (96%) indicating commercial value; 39% had the highest combined rating (F1-R1).

(NOT MUCH HERE…..)

Slide6

Quebec

New

Brun.Maine

New Hamp.

Vermont

MOOSE STUDY SITES IN NEW ENGLAND

Slide7
Productivity & Mortality (2014-2017)

- Productivity of cows- Neonatal survival

Annual survival/mortality Cause of mortality

Slide8
3-YEAR RESULTS (2014-2016)

- ALL WERE EPIZOOTICS (& 2003, 08, 11) - 70% CALF MORTALITY; 15% ADULT - ACUTE ANEMIA & SEVERE WEIGHT LOSS - LOWER CALF MORTALITY IN NORTHERN MAINE (45%)

Slide9

HIGH CALF MORTALITY FROM TICKS CAN OCCUR IN ANY WINTER!

COUNTING TICKS - YOU CAN’T SEE THE LONG TRAIL…

Slide10

“For all moose, but most certainly for calves, ticks suck!” (B. Samuel)

“We” are counting tick loads of 35,000 - >90,000 thousand on calves (conservative estimates)!

Slide11

Volume & Energy Cost of Blood Loss

Severe Tick Load (70,000)-

Calves lose entire blood volume in 3 week period!~15-20% of daily ME in 2 week “surge” to replace blood

They are toast!

Slide12
Protein

Deficit – Calves Peak Protein Loss = 50>100% of daily requirement!!!

Adults: 30-40% of daily requirement (70,000 ticks)

Slide13

ENERGY COST OF GESTATION (DEER)Key Points:

Delayed development addresses protein-deficient winter diet 90+ % of cost in 3rd trimester~75% of cost & lactation occur after spring green-up

MOOSE DO NOT USE THIS STRATEGY!spring green-up occurs after birth

“Winter” forage and body tissues provide

the cost of gestation

and

early lactation.

(Or,

as Jonas taught us –

size matters - sorry Murray….)

Slide14
Some assumptions: 1) Maintain body weight from forage consumption until January

2) Body weight is equal in January and May 2) Period 1 = January & February (60 days) – no gestational cost 3) Period 2 (3rd trimester) = March-May 17 (77 days) – 100% gestational and tick costsBalance = (FMR*+ gestation cost

+ tick cost) – (forage energy) – (tissue/fat energy) 3 Adult Cows: Body Weights = 325 kg (15% body fat), 350 (20%), 375 (25%)

* FMR = field metabolic rate BALANCING GESTATION

& “TICK COST”:

SIGNIFICANCE OF BODY WEIGHT & CONDITION

Slide15
BALANCING GESTATION

& TICKS: SIGNIFICANCE OF BODY WEIGHT & CONDITION Field metabolic rate: FMR = ME (maintenance energy requirement) x 1.1

where ME = 131 kcal/kg0.75/dGestational cost: 1) assumed zero until last trimester (77 days) 2) trimester broken into 3 periods: 21 (1.2 x ME), 28 (1.3 x ME), and 28 (1.6 x ME) daysTick cost (70,000 ticks):

The 3 periods also represent 3 distinct periods of blood loss: pre (10%), engorge (75%), post (15%) = total cost = 41,000 kcalForage consumption: 1% (dry) of body weight 325 kg = 7150 kcal/d; 350 = 7775; 375 = 8250

Fat Energy:

9.4 kcal/g – (325 = 460,600 kcal; 350 = 658,000; 375 = 878,900)

Slide16

Jan 1Mar 1

Mar 21Apr 19

May 18

Largest cows are in deficit in the last

4-week period only (

post-engorgement

):

350 kg = 9259/day

375 kg = 5880/day

Ticks represent 4-8 days of this deficit.

325 kg cow - deficit occurs in early April????

KCAL (fat)

Slide17

Healthy Ghost Moose!

Slide18
So what the hell is going on??? It’s complex…

Protein deficit is problematic during fetal growth phase (30-40% daily deficit– the length of this period is key – size matters)Limits of compensatory growth (non-breeding years increase; <50%)Cumulative physiological impacts (frequent vs. pulsed epizootic events)

Later maturation (surviving calves are severely compromised) Age/size of cows becomes more influential on productivity Individual productivity declines (low twinning rate)

Slide19
What of Climate Change?

1) Tick survival, productivity, and abundance – all increase (except drought years) - longer falls (questing), shorter winters (adult female survival) - ticks cost ~4 days of energy and substantial protein imbalance during fetal growth 2) New moose-tick relationship: continuous/multi-year impacts vs. annual pulses

- higher annual frequency of epizootics3) Moose population: what is the lower “stable/normal” population in face of #2? Management Options?Adjust population goals relative to “new” host-parasite relationship.Reduce moose density to disrupt the “new” host-parasite relationship.Wait, watch, hope….”frost on the pumpkin” will solve our woes!

Slide20
Good Habitat Awaits a “Released Population”