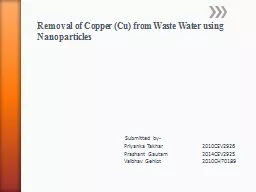
By Majesti Bass Introduction Water is essential for all life on earth unfortunately water is also becoming more contaminated The most common metals found in drinking water are lead and copper exposure to these metals can cause major health effects ID: 781162
Download The PPT/PDF document "The Removal of Metals from Aqueous Solut..." is the property of its rightful owner. Permission is granted to download and print the materials on this web site for personal, non-commercial use only, and to display it on your personal computer provided you do not modify the materials and that you retain all copyright notices contained in the materials. By downloading content from our website, you accept the terms of this agreement.
Slide1
The Removal of Metals from Aqueous Solutions using Green Products
By:
Majesti
Bass
Slide2Introduction
Water is essential for all life on earth; unfortunately water is also becoming more contaminated.
The
most common metals found in drinking water are lead and copper, exposure to these metals can cause major health effects
.
This ongoing problem can be solved by performing an experiment that tests the different removal methods on lead and copper. The results from this experiment will help the water systems for developing countries that might not have the money to pay for expensive removal methods.
Slide3Background
Lead
is the most consumed metal in the United States, consuming over 3.6 billion pounds. (
Draggan
, 2008)
Lead
is used in the production of batteries, glass, ammunition, metal, and can act as a heat stabilizer in plastics and resins.
If
lead is ingested or presented to the skin it could cause serious problems. These problems include malfunction of the blood, kidneys, reproductive system, peripheral system, and central nervous system.
The
action part for lead is fifteen parts per million, which means this is the maximum amount tolerated in water. (EPA, 2012)
Slide4Copper
is introduced to water systems through the corrosion of plumbing systems.
It
can also come from natural deposits of copper which are found in the lining of pipes underground. The highest amount of copper allowed in water is 1.3ppm (Copper Info, EPA).
Some
health hazards associated with the ingestion of copper is gastrointestinal distress, and kidney damage.
Slide5Hypotheses
The research hypothesis for this experiment states that if citrus fruit peel is used to remove the metals lead and copper then most of the metals will be removed.
The null hypothesis states that there will not be a significant difference between the amount of copper or lead removed by using citrus peel.
The predicted outcome of this experiment is that at least 50 percent of the initial lead and copper present in the water will be removed after five treatments of citrus peel.
Slide6Procedure
The citrus fruit being used in this project will be orange peel; these will be rinsed off to remove any dirt on the peel. Then the peel will dried in an oven. Finally the peel will be crushed using a mortar and pestle.
Obtain saw dust
Collect leaves and use the mortar and pestle to crush.
100mL of tap
water
will be obtained for each amount of lead and copper for the remaining number of trials.
Add 10 grams of lead and copper nitrate to 10 individual beakers of water
Next the amount of each metal will be measured by using probes and household water quality test kits
Record the initial amount of each metal
Apply the citrus fruit peel to the 100ml of tap water
Let the citrus peel sit for 30 minutes
Repeat step 7-8 for other absorbents: lemon peel, lime peel, saw dust, and leaves
Record the amount of metal left in water using the appropriate
material
Flow Chart
Slide8Materials
Lead Nitrate
Copper Nitrate
Premium Lead Test Kit
Complete Home Water Quality Test Kit
Lemon
Lime
Orange
Oak Leaves
Sawdust
Knife
Mortar and pestle
Sawdust
Knife
Sieve
Slide9Pictures
Figure 1: This figure depicts lime that has just been peeled, along with the mortar and pestle with crushed orange peel. Other materials such as beakers can also be seen in this figure.
Slide10Pictures
Figure 2: This figure depicts beakers with sawdust, along with a lead water quality test strip.
Slide11Pictures
Figure 3: This figure depicts the researcher pouring the needed amount of metal to the 100mL beakers of water.
Picture
Figure
4:
This figure depicts the settled lemon peel to the bottom of the beaker
Slide13Pictures
Figure
5:
This figure depicts lime peel being used as an absorbent.
Slide14EDD
IV: Absorbents and Metals
Lead
Citrus Fruit peel : orange ,lemon, lime
sawdust, oak tree leaves
Copper
Citrus Fruit peel: orange, lemon, lime
sawdust, oak tree leaves
Control
Lead, Copper
# of Trials
10
10
10
Title: The removal of metals from aqueous solution using green products
DV: Amount of metal removed each time
Constants: Amount of time allotted for absorbent to work, number of trials, tools used to measure removal
Slide15Amount of Change
Figure 1: This graph shows the average amount of lead removed by using each absorbent organic material, over the three trials. The amount of lead removed is measured in milliliters. This shows that sawdust, removed the most amount of lead.
Slide16Amount of Change
Figure 2: This graph shows the average amount of copper removed after using the three absorbents. The amount of copper removed is measured in milliliters. Sawdust removed the most copper.
Slide17Conclusion
D
ata
was not significant, because my p-value of 0.527 is greater than 0.5.
Therefore
I reject my research hypothesis and accept my null hypothesis.
The
insignificance of data could be due to the inaccessibility to proper measurement tools.
Malfunction with analysis equipment
Slide18Future Research
Use
this technique and
teach
it to ambassadors of developing countries , to purify their water in hopes of giving their citizens better health.
Slide19Acknowledgements
Mr
. Scott Bolen for greatly assisting me in coming up with a new research
topic.
Mr
. Hendrix for his supervision throughout my experiment
.
Rockdale
Magnet Fund for providing the necessary funds needed to purchase materials for my project.
M
y
parents for purchasing all the adsorbents that I used in this experiment.
Slide20All About Me
Slide21Personal Achievements
Member of RMSST Student Ambassador Program
Position- Vice President
Recently proctored testing for 8
th
grade applicants
Made A\B Honor Roll for 1
st
semester
Slide22Volleyball
Made the Prep Volleyball list for the Top 50 Juniors list for the class of 2015
#1 Hitter in the State for RCHS
Awarded offensive player of the year
One of the Top 10 Players in the Country
Made the All State Team
Slide23USA Volleyball
Made the Red Youth Continental National Team
Won Gold in High Performance Tournament
Held in Ft. Lauderdale
Met many players from all over the world (Brazil, Australia, New Zealand, Puerto Rico, etc.)
Slide24Slide25Club Volleyball
Player for A5 South Volleyball Club
1
st
player of club to commit to a Division 1 School
Team: 17-1 Joe
Slide26Committed to UGA