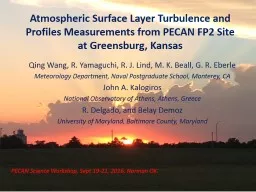
Profile Measurements from PECAN FP2 Site at Greensburg Kansas Qing Wang R Yamaguchi R J Lind M K Beall G R Eberle Meteorology Department Naval Postgraduate School Monterey CA John A Kalogiros ID: 633005
Download Presentation The PPT/PDF document "Atmospheric Surface Layer Turbulence and" is the property of its rightful owner. Permission is granted to download and print the materials on this web site for personal, non-commercial use only, and to display it on your personal computer provided you do not modify the materials and that you retain all copyright notices contained in the materials. By downloading content from our website, you accept the terms of this agreement.
Slide1
Atmospheric Surface Layer Turbulence and
Profile Measurements from PECAN FP2 Site at Greensburg, Kansas
Qing Wang, R. Yamaguchi, R. J. Lind, M. K. Beall, G. R. EberleMeteorology Department, Naval Postgraduate School, Monterey, CAJohn A. KalogirosNational Observatory of Athens, Athens, GreeceR. Delgado, and Belay DemozUniversity of Maryland, Baltimore County, Maryland
PECAN Science Workshop, Sept 19-21, 2016, Norman OK.Slide2
16 m Main Tower
6 m flux tower
3 m scalar tower
Tethered balloon ops
SODAR
Ceilometer
NASA/USMBC site
Greensburg KS is at the south west corner of the PECAN domain
FP2 site is on the east edge of the City of Greensburg and is well exposed to ambient environment away from the city for most wind directions.
NPS towers are at a
location with tall grass.Slide3
16-m main
mast
6-m tripod
3-m scalar tripod
Aspirated T/RH
Office
storage
SODAR
Tethersonde calibration
Tethered balloon and mooring trailer
3-m scalar tripod
Rawinsonde launches by
UMBC
(University
of Maryland, Baltimore
County) and NPS
NPS
Measurement
Components at FP2Slide4
Dusk and night operationsSlide5
LLJ top
LLJ core
Moist Layer
Cool Layer
General Atmospheric Properties from UMBC/NPS Rawinsonde MeasurementsSlide6
LLJ Observed During PECANSlide7
Blending of Measurements for LLJ study
16-m main
mast
Wind (continuous measurements):
6 levels below 16 m
70 to ~1500 m,
Δ
z=35 m
25 to ~150 m,
Δ
z=5 m
Thermodynamics (continuous measurements):
16-m main
mast
11 levels T/RH below 16 m
6 levels T/RH below 2 m
Δ
T > 0 : stable
Δ
T
<
0 :
unstable
Δ
T=T
16m
-T0.11m
Surface temperatureSlide8
Surface Layer Thermal Stratification and Sunrise and Sunset time
Greensburg
KS in
June/July
:
Sunrise: 0620
CDT (
1120
UTC)
Sunset
: 2100
CDT (0200 UTC)ΔT > 0 : stable
ΔT < 0 :
unstable
Solar downward irradiance measurement corresponds well with sunset and sunrise time.Stable surface layer starts 1-2 hours before sunset and ends ~1 hours after sunrise.Slide9
LLJ and Surface Layer Thermal
Stratification (Night and Day)
Δ
T > 0 : stable
Δ
T
<
0 :
unstable
Nighttime strong wind between 425 m and 601 m LIDAR level corresponds
to weak
Δ
T (T
16
-T
0.11
)Slide10
LLJ and Surface Layer Thermal Stratification (Night-Averaged Only)
Δ
T: night time averaged temperature difference between 16 m and 0.11 m
WS
LLJ
: nighttime averaged wind speed between 425 and 601 m from the
Leosphere
LIDAR
Strong LLJ occurs on nights with
weak
surface layer inversion.
Strong LLJ nights
have
Δ
T generally less than 2, with one exception on June 28, the weakest observed LLJ in PECANSlide11
Altitude Variability in LLJ Wind
Surface layer wind speed and the upper layer wind are almost out of phase in their time evolution.
Surface layer wind direction follows the upper air trend well with the expected veering. Slide12
Overall Surface Flux Diurnal VariationsSlide13
LLJ Development and Surface Fluxes
Flux enhancements on nights with LLJSlide14
LLJ Development and Surface Fluxes
Nighttime averaged fluxesCircles denote nights with LLJ, colors refer to different levelsSlide15
LLJ Development and Surface Fluxes
Blue non-LLJ case, red LLJ casesThe fluxes are from the lowest level on the 16 m tower. Nighttime LLJ enhanced surface fluxes are apparent in these figures. Slide16
LLJ Development and Surface FluxesSlide17
NPS Tethered Balloon Measurements of Evening Transition and LLJ Development
0100
: unstable daytime convective BL to stable BL transition
0340
: rapid development of LLJ
T decreases and RH increases as LLJ develops.
Time
Time
Slow evolution
Quick
evolution
Quick
evolutionSlide18
Summary and Conclusions
NPS Meteorology Department successfully made extensive measurements at the FP2 Greensburg site with a combination of fixed level tower-based measurements and tethered balloon and SODAR profiling. The combination of multiple measurements at the FP2 site
is beneficial for obtaining a complete picture of BL and LLJ development. LLJ tends to develop on nights with weak surface layer inversion.The surface layer wind and in the upper level close to the jet core have nearly opposite trend in the evening development. The development of the LLJ above enhances surface flux exchanges.
The tethered balloon measurements revealed rapid boundary layer
temperature decrease and relative humidity increase
during the nocturnal wind development.