/
MICROWAVE FREQUENCY TRANSITIONS REQUIRING LASER ABLATED URA MICROWAVE FREQUENCY TRANSITIONS REQUIRING LASER ABLATED URA

MICROWAVE FREQUENCY TRANSITIONS REQUIRING LASER ABLATED URA - PowerPoint Presentation

olivia-moreira
olivia-moreira . @olivia-moreira
Follow
405 views
Uploaded On 2015-11-06

MICROWAVE FREQUENCY TRANSITIONS REQUIRING LASER ABLATED URA - PPT Presentation

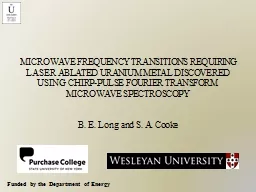
B E Long and S A Cooke Funded by the Department of Energy Background 1981 BalleFlygare Cavity FTMW facilitated the rotational spectroscopic study of transient species 1989 Suenram ID: 185265

laser line 1not microwave line laser microwave 1not mhz requiring cooke ghz resolution experiments frequency ftmw lines energy department

Share:

Link:

Embed:

Download Presentation from below link

Download Presentation The PPT/PDF document "MICROWAVE FREQUENCY TRANSITIONS REQUIRIN..." is the property of its rightful owner. Permission is granted to download and print the materials on this web site for personal, non-commercial use only, and to display it on your personal computer provided you do not modify the materials and that you retain all copyright notices contained in the materials. By downloading content from our website, you accept the terms of this agreement.


Presentation Transcript

Slide1

MICROWAVE FREQUENCY TRANSITIONS REQUIRING LASER ABLATED URANIUM METAL DISCOVERED USING CHIRP-PULSE FOURIER TRANSFORM MICROWAVE SPECTROSCOPYB. E. Long and S. A. Cooke

Funded by the Department of EnergySlide2

Background1981: Balle-Flygare Cavity FTMW facilitated the rotational spectroscopic study of transient species1989:

Suenram, Lovas, Matsumura incorporate a laser ablation source

2005: Pate and co-workers implement a chirp pulse FTMW spectrometer

Great resolution and sensitivity

“Non-specific production source” *

“The search is over” **

* This meeting: Crabtree, McCarthy RE03, see also and

Zaleski

, Stephens, Walker,

Legon

FD09

** Talk FC03, 60

th

ISMS, 2005Slide3

UraniumToxicDust is pyrophoric

Radioactive (a-decay, t

1/2 = 4.46 x 10⁹ years)

Lots of bureaucracy

Factor that has been most

deleterious to my healthSlide4

G. S. Grubbs II, R. A.

Powoski

, D.

Jojola

and S. A. Cooke.

J. Phys. Chem. A

114

(2010) 8009

.

Experiment covers 7 GHz to 18 GHz. Picture credit: C. T. Dewberry.Slide5

Laser onLaser off

OCS

Scale is in MHzSlide6

12050 line. 10 shots.

None of the observed lines exhibit structure.Slide7

U-requiring transitionsFrequency / MHzS/N in O2

S/N in Ar7999.8894

55/115/18798.7844

11/1Not Present9681.3895

3/1Not Present11181.0201

21/1

3/1

11926.976

74/1

21/1

11948.8033

3/1

Not Present

12050.3949

15/1

6/1

12173.5944

11/1

3/1

Assignments not available at present.

Double resonance experiments inconclusive to date.Autofit software finds multiple 3, and 4 line fits.Slide8

UO

3

is T-shapedSlide9

Line Freq / MHz QN’s Obs-Calc 2 11181.019 4 2 2 4 1 3 .148243 6 12440.697 4 2 3 3 3 0 .000000 7 15723.489 5 2 3 5 1 4 -.039173 8 18301.569 8 4 4 8 3 5 -.056911 Expt’lA = 7764.89 MHzB = 5013.92 MHzC = 3054.41 MHzUO3 Calc’d

A = 7767.7 MHzB = 5043.6 MHzC = 3058.0 MHzLine Assigner Fit’s

Look’s great

but

lines are predicted that we don’t see.Slide10

Department of Energy – “Experimentally characterizing the electronic structures of f-electron systems using advanced high resolution Fourier transform microwave spectroscopies”

Stew Novick, Dan Obenchain

, Pete Pringle and all members of the Southern New England Microwave Spectroscopy Consortium.

Oxygen-17/18 experiments will be attempted in the near futureStark experiments

E-band measurements

Acknowledgements

To do:Slide11

http://specfitter.droppages.com/