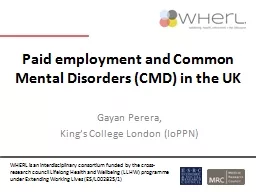
/
Paid employment and  Common Paid employment and  Common

Paid employment and Common - PowerPoint Presentation

olivia-moreira
olivia-moreira . @olivia-moreira
Follow
346 views
Uploaded On 2019-03-13

Paid employment and Common - PPT Presentation

M ental D isorders CMD in the UK Gayan Perera Kings College London IoPPN WHERL is an interdisciplinary consortium funded by the crossresearch council Lifelong Health and Wellbeing LLHW programme under Extending Working Lives ESL0028251 ID: 755863

paid employment status health employment paid health status 1993 cmd 2007 year 2000 2012 london reason 2011 surveys social

Share:

Link:

Embed:

Download Presentation from below link

Download Presentation The PPT/PDF document "Paid employment and Common" is the property of its rightful owner. Permission is granted to download and print the materials on this web site for personal, non-commercial use only, and to display it on your personal computer provided you do not modify the materials and that you retain all copyright notices contained in the materials. By downloading content from our website, you accept the terms of this agreement.


Presentation Transcript

Slide1

Paid employment and Common Mental Disorders (CMD) in the UK

Gayan Perera, King’s College London (IoPPN)

WHERL is an interdisciplinary consortium funded by the cross-research council Lifelong Health and Wellbeing (LLHW) programme under Extending Working Lives (ES/L002825/1)Slide2

Objective of WHerL

How has the relationship between working until and beyond State Pension Age (SPA) and health and

psychological

health changed overtime

. Slide3

ObjectiveTo investigate the association between employment status and

Common Mental Disorder (CMD) in

50-64

year old residents in England and its

stability

over time, taking advantage of

three national mental health surveys

carried out over a 14 year period.Slide4

Number of people of normal pension age and above who remain in work almost doubled

to a total of 1.4 million between the years 1993 and 2011 in England. (ONS, 2012)

P

ercentage

of older People remaining in the workforce has also increased within this time period, from

7.6%

in 1993 to

12.0% in 2011. (ONS, 2012)

Employment and Increase in older populationSlide5

Effect of paid work on health and well-being in later life

Some studies suggest paid employment among older people is beneficial for health and well-being (Adam et al., 2007;

Rohwedder

and Willis, 2010;

Behnke

, 2012;

Bonsang

et al., 2012; Calvo et al., 2013)

Some suggest that it is

detrimental

(Coe and

Zamarro

, 2011) and some that there is

no significant or meaningful relationship

(Coe and

Lindeboom

, 2008; Coe and

Zamarro

, 2011;

Behnke

, 2012;

Calvo

et al., 2013).Slide6

Method

Data: British National Surveys of Psychiatric Morbidity of 1993, 2000 and 2007

Exposure:

Paid

employment

status

Outcome:

CMD the

primary outcome – both ascertained identically in all three surveys (CMD from the revised Clinical Interview Schedule

)

Statistics:

Multivariable

logistic

regressionSlide7

Description of the sample by employment status and year of survey


1993 (n=2,385)

2000 (n=1,871)

2007 (n=1,771)

Variable

In paid Employment

Not in paid Employment

In paid Employment

Not in paid Employment

In paid Employment

Not in paid Employment

Number

1279

1169

1123

751

1111

668

CMD present

126 (9.9)

195 (

16.7

)

130 (11.6)

189 (

25.2

)

134 (12.1)

155 (

23.2

)

Reason for non-employment

Health-related non-employment

265 (22.7)

232 (

30.9

)

170 (25.4)

Other reason

904 (77.3)

519 (69.1)

498 (74.6)

Marital status

Divorced/separated

158 (12.4)

156 (13.4)

223 (19.9)

167 (22.2)

169 (15.2)

124 (18.6)

Married/cohabiting

929 (

73.0

)

766 (

65.9

)

756 (

67.3

)

434 (

57.8

)

795 (

71.6

)

414 (

62.0

)

Single

83 (6.5)

101 (8.7)

85 (7.6)

55 (7.3)

79 (7.1)

61 (9.1)

Widowed

102 (8.0)

140 (12.0)

59 (5.3)

95 (12.6)

68 (6.1)

69 (10.3)Slide8

Description of the sample by employment status and year of survey


1993 (n=2,385)

2000 (n=1,871)

2007 (n=1,771)

Variable

In paid Employment

Not in paid Employment

In paid Employment

Not in paid Employment

In paid Employment

Not in paid Employment

Highest qualification

A-level or above

280 (

21.9

)

124 (10.6)

331 (

29.5

)

133 (17.7)

477 (

43.1

)

161 (24.3)

GCSE/GCE/O-level/other

521 (40.7)

437 (37.4)

362 (32.2)

227 (30.2)

347 (31.3)

195 (29.4)

No qualifications

478 (37.4)

608 (

52.0

)

430 (38.3)

391 (

52.1

)

283 (25.6)

307 (46.3)

Social class by occupation

Professional/managerial/clerical

658 (

51.4

)

539 (46.1)

695 (

61.9

)

396 (52.7)

709 (

63.8

)

375 (56.1)

Skilled/partly skilled

558 (43.6)

541 (46.3)

381 (33.9)

293 (39.0)

344 (31.0)

242 (36.2)

Unskilled

63 (4.9)

89 (7.6)

47 (4.2)

62 (8.3)

58 (5.2)

51 (7.6)Slide9

Description of the sample by employment status and year of survey


1993 (n=2,385)

2000 (n=1,871)

2007 (n=1,771)

Variable

paid

Employment

Non-paid

Employment

paid

Employment

Non-paid

Employment

paid

Employment

Non-paid

Employment

Housing

tenure

Owned with a mortgage

616 (48.2)

279 (23.9)

552 (49.2)

161 (21.5)

471 (42.6)

123 (18.4)

Owned outright

417 (32.6)

518 (44.3)

434 (38.6)

369 (49.3)

484 (43.8)

335 (50.2)

Private or other renter

82 (6.4)

49 (4.2)

44 (3.9)

31 (4.1)

67 (6.1)

35 (5.2)

Social housing

164 (12.8)

323 (27.6)

93 (8.3)

187 (25.0)

83 (7.5)

174 (26.1)

Serious debt in the last year

51 (4.0)

48 (4.1)

49 (4.4)

72 (

9.6

)

37 (3.3)

53

(7.9

)

Seen a

family

doctor

823 (64.3)

883 (

75.5

)

741 (66.0)

559 (

74.4

)

717 (64.5)

498 (

74.6

)

Smoking status

No smoker

315 (24.6)

362 (31.0)

246 (21.9)

219 (29.2)

217 (19.5)

167 (25.0)

Ex-smoker

639 (50.0)

521 (44.6)

633 (56.4)

359 (47.8)

553 (49.8)

306 (45.8)

Current smoker

325 (25.4)

286 (24.5)

244 (21.7)

173 (23.0)

341 (30.7)

195 (29.2)

At-least one ADL impaired

191 (14.9)

427 (

36.5

)

157 (14.0)

330 (

43.9

)

327 (29.4)

351 (

52.5

)Slide10


1993 (n=2,385)

2000 (n=1,871)

2007 (n=1,771)

Adjustments

Reason for non-employment

OR

P value

OR

P value

OR

P value

Model 1: Age, gender and marital status

In paid employment

Ref

Ref

Ref

Health

6.27 (4.46- 8.83)<0.0018.72 (6.25- 12.2)<0.0017.28 (5.01- 10.6)<0.001Other 1.30 (0.96- 1.77)0.091.25 (0.89- 1.77)0.21.48 (1.05- 2.08)0.02Model 2: Model 1+ education, social class, housing tenure and serious debtIn paid employmentRefRefRefHealth5.83 (4.06- 8.38)<0.0017.01 (4.88- 10.1)<0.0015.30 (3.49- 8.04)<0.001Other 1.30 (0.96- 1.78)0.091.24 (0.86- 1.77)0.251.29 (0.91- 1.82)0.16Model 3: Model 2+ smoking status, physical health consultation and ADL impairmentIn paid employmentRefRefRefHealth3.05 (2.05- 4.55)<0.0013.56 (2.36- 5.36)<0.0012.80 (1.81- 4.36)<0.001Other 1.16 (0.85- 1.60)0.351.13 (0.79- 1.64)0.491.09 (0.76- 1.58)0.64

Odds ratios of ‘reason for non-employment’ association with CMD adjusted for various factors for 3 surveysSlide11

The prevalence of CMD was higher in people not in paid employment for health reasons but was not associated with non-employment for other reasons.

Associations had been relatively stable

in strength from 1993 to 2007.

Summary of findingsSlide12

Policy implications

Government and employers should provide support for those are willing to work longer.

Even during economic prosperous times (year 2000), association between non-employment and CMD is high.Slide13

www.wherl.ac.uk

Thank you

Paper submitted to Psychological Medicine.

Authors:

Gayan

Perera

1

, Giorgio Di Gessa

2

, Laurie M. Corna

2

, Karen Glaser

2

, Robert

Stewart

1

1

Department of Psychological Medicine, Institute of Psychiatry, Psychology and Neuroscience, King’s College London, London, United Kingdom

2

Institute of Gerontology, Department of Social Science, Health & Medicine, King’s College London, London, United Kingdom