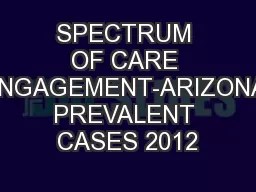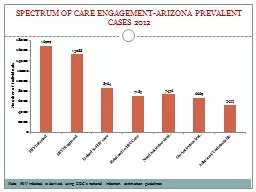
PPT-SPECTRUM OF CARE ENGAGEMENT-ARIZONA PREVALENT CASES 2012
Author : olivia-moreira | Published Date : 2016-06-22
Note HIV infected is derived using CDCs national infection estimation guidelines Definitions HIVInfected Prevalent cases and estimated unaware cases of HIV infection
Presentation Embed Code
Download Presentation
Download Presentation The PPT/PDF document "SPECTRUM OF CARE ENGAGEMENT-ARIZONA PREV..." is the property of its rightful owner. Permission is granted to download and print the materials on this website for personal, non-commercial use only, and to display it on your personal computer provided you do not modify the materials and that you retain all copyright notices contained in the materials. By downloading content from our website, you accept the terms of this agreement.
SPECTRUM OF CARE ENGAGEMENT-ARIZONA PREVALENT CASES 2012: Transcript
Download Rules Of Document
"SPECTRUM OF CARE ENGAGEMENT-ARIZONA PREVALENT CASES 2012"The content belongs to its owner. You may download and print it for personal use, without modification, and keep all copyright notices. By downloading, you agree to these terms.
Related Documents