/
Stratigraphy Stratigraphy

Stratigraphy - PDF document

olivia-moreira
olivia-moreira . @olivia-moreira
Follow
408 views
Uploaded On 2016-08-08

Stratigraphy - PPT Presentation

ABSTRACT 
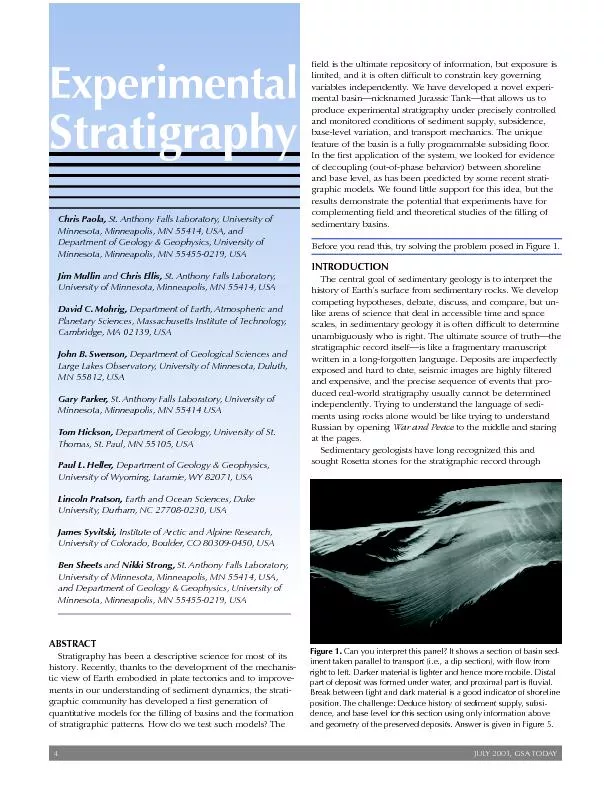
igure 1Can you interpret this panel It shows a section of basin sediment taken parallel to transport ie a dip section with flow frompart of deposit was formed under water and proxim ID: 437800

ABSTRACT igure 1.Can you interpret this

Share:

Link:

Embed:

Download Presentation from below link

Download Pdf The PPT/PDF document "Stratigraphy" is the property of its rightful owner. Permission is granted to download and print the materials on this web site for personal, non-commercial use only, and to display it on your personal computer provided you do not modify the materials and that you retain all copyright notices contained in the materials. By downloading content from our website, you accept the terms of this agreement.


Presentation Transcript

ABSTRACT Stratigraphy igure 1.Can you interpret this panel? It shows a section of basin sed-iment taken parallel to transport (i.e., a dip section), with flow frompart of deposit was formed under water, and proximal part is fluvial.position. The challenge: Deduce history of sediment supply, subsi-dence, and base level for this section using only information aboveand geometry of the preserved deposits. Answer is given in Figure 5. JULY 2001, GSA TODAY studies of modern environments andprocesses. Most of our understanding ofcomes from synthesis of the mainly hori-zontal information we have from mod-ern depositional environments with themainly vertical information provided byancient deposits. A particularly fruitfulstratification) in terms of bed forms andment-depositing flows (Allen, 1984;search, carried out in both field and lab-oratory, has taught us much about theform of larger-scale sequences of sedi-phy is that patterns in these sequences(rate and distribution), and sedimentsupply (e.g., Sloss, 1962). To this trinitywe should add a fourth variable groupthat controls the efficacy of the transportsystem (e.g., water supply for rivers,continental shelf). The first attempts tounderstand how changes in these inde-graphically were descriptive. However,enough that it is difficult to modelalone. Two major developments haveallowed us to create a first generation ofsubsidence, an outgrowth of plate-tec-our understanding of how sediment-transport systems work. By couplingsubsidence and transport, we producemerical.) These models should allow usgreatersubtlety and precision. However,it is worth pausing before rushing off toapply our newly minted models to EarthScape FacilityIn most sciences, carefully controlledplayed much of a role in stratigraphicneering and geomorphology. One of themain logistical hurdles to experimentalstratigraphy is the necessity of includingtectonic effects such as subsidence anduplift. We have addressed this by build-ing a large experimental basin that in-corporates a unique, flexible subsidingfloor to simulate the development ofof subsidence conditions. This new ex-study the formation of stratigraphy un-ences that control natural basin stratigra-river, wave, current, and mass-flow sedi-ment transportÑand it allows themented, the resultant deposits can bedissected at high resolution and visual-positional products. On the other hand,and Coriolis effects), and they distortFormally, we use theory to linkory has had a good workout in a con-olled system, we can about using it to scale the experimentalresults to the field, to evaluate effectswell suited for testing formal ÒinversionÓAt a more informal level, experimentslike watching a transport system evolvein front of you and then dissecting it todered it in stratigraphy. We manipulateonly boundary conditions. Within thebasin, the transport systems organizerather than what we programmed themto do. Self-organizationÑthe spontaneousemergence of patterns and structuresÑis a hallmark of sediment-transporting GSA TODAY, JULY 2001 igure 2.Schematic diagram of subsidencemechanism used in eXperimental EarthScapePulses of water shot through narrow tubesknock gravel out of pipe, causing subsidenceof gravel surface. JULY 2001, GSA TODAYgive us new ideas and things to look fortions of the experimental systems, it isTHE XES FACILITY The XES facility is a large basin (13 m6.5 m) developed and built with fundsfrom the National Science Foundationallows the accumulation of stratathrough the use of a flexible subsidingsubstrate (Fig. 2). The basin floor is amodate deposition. An experiment startswith the basin filled with gravel. The topber membrane, which forms the base ofdence cell is a hexagon forming the topthe elbow, knocking a small volumethat drives the pulses via a computer-controlled solenoid valve. We have re-fined the pulsing so that each pulse pro-Hence, the subsidence is effectivelysmooth and continuous in time. Thelevel, so the gravel can flow laterally toaccommodate differential subsidencetern onto the basement surface. The sys-eral slopes of up to 60¡can be pro-dently set by a computer-controlledhead tank mounted outside of the basin.More details of the design and mechanicsof the basin are available on our WebDuring an experiment, the surface-flow pattern is recorded using video andstill cameras. In addition, a topographicRice et al. (1988) and Wilson and Rice3-dimensional evolution of the surfacecomparison with the surface-flow im-cess allows us to build a 3-dimensionalimage of the deposits by stacking theAdditional equipment being added tophy, and a system for rapid digital pho-tography of sectioned deposits. INITIAL EXPERIMENTAL RESULTSsmall prototype basin with 10 subsi-was designed to study the effects ofthat for slow (long-period) base-level igure 3.cells. A 10-cell version was used for experiment described in this paper. igure 4.Drawings from photographs show-ing sediment surface at two times, 15 min-utes apart, during the rapid base-level fall.Numbers in parentheses give time after startof the base-level cycle. Basin centerline isshown by dashed line; sediment-feed point isshown by small cylinder. Locations of twosections shown in Figure 5 are shown byactive flow is shown in black, and fault sym-bols show normal faults associated with ex-posure of delta front. Base-level history isgiven in Figure 5, with time for these imagesindicated by arrow. base level (i.e., shoreline would be 90¡occurred not at high tide but midwaybetween low and high tideÑthat atplain is not a static surface on whichimprinted. Rather, the surface mor-phology evolves along with changingdifferent morphology from fluvialbetween shoreline and tidal heightmight be quite different.ferent.)AngevineÕs (1989) analysis of the Pitmanmodel also suggested that the shorelinebase-level cycles were predicted to pro-that shoreline could get out of phasedifficult to test in the field (e.g., Miller ment into one end of the basin (Fig. 4).induced in a bowl-shaped pattern with amaximum in the center of the basin.discharge and of subsidence were main-tained throughout the run. The sedimentdischarge was set to balance the totalrate of volumetric accommodation in thebasin. We imposed two cycles of base-steady-state deposition (Fig. 5) to allowfor relaxation of transient effects. Theslow cycle had a total duration of 30 h,rium time of 3.4 h. The rapid cycle hadAlthough some degree of incision oc-curred during both base-level falls, inci-sion and valley formation were much igure 5.Flow-parallel (dip) from base-level run. Color bands al-low correlation of deposit with base-level curve to left. Arrow in base-level curve shows timeof images in Figure 4. Spatial subsidence pattern is indicated by basement position at bottommaterial is quartz sand. Inset shows upper part ofstratigraphy from an area outside incised valley that formed during rapid base-level cycle.Locations of sections are shown in Figure 4. 1800 1600 1400 1200 1000 800 600 400 200 50 40 30 20 10 time, hrs -200 -150 -100 -50 100base level, mm -200200autocyclic amplitude, mm shoreline position, mm igure 6.Shoreline position (red and orange) and base level (blue) during base-level run. Redshoreline curve was taken within incised valley, orange one just outside it. Gray curve isshoreline predicted with theoretical model of Swenson et al. (2000). Green curve at topshows high-frequency (autocyclic) variation in shoreline position. Classic shazamŽ zigzagpattern that autocyclic variation produces in stratigraphy is clearly visible in Figures 1 and 5. GSA TODAY, JULY 2001 JULY 2001, GSA TODAYby initial exposure of the delta front andflow depth that extended headwardalong the length of the basin. The strati-was quite different for sections insideithin the valley, the fall resulted in anunconformable sequence boundary thatsections. Significant valley filling, and re-sultant onlap, did not commence untilprofile as recorded in the stratigraphywas substantially wider and more gentlywas relatively erodible, we believe thisto be a general effect: Incised valleyprofiles will generally be compositesthat reflect both incision and wideninginterfluve areas would show featuresnied by deposition and thus did not pro-duce an unconformity that, in sequenceoped during the slow cycle was alsomuch more laterally continuous than fortion of sediment storage, the 3-dimen-sional geometry of fluvial and subma-est of Theoretical Predictionsattenuated and out of phase. First, it ismm, 2.1 times that for the rapid cycle.upon stabilization of base level,and the point of maximum trans-by ~32% of the total shorelineexcursion distance of the initialovershoot is proportionally muchlarger: 133% of the total excur-On the whole, the experimentdoes not offer strong support forbehavior cannot be explained by differ-Rather, it appears that PitmanÕs result isclosely linked to his assumption of athe experiments or, generally speaking,Internally Generated Phenomenarapid fall, trapping sediment at the faultoffset shows how steady the motion onthe faults was. It is particularly strikingthat at no time prior to the rapid base-level cycle was there any surface mani-festation of the presence of the faults.an offset of no more than 20 mm.The second internally generated phe-in shoreline position (Fig. 6) associatedwith shifting of the threads of maxi-mum flow inthe fluvial system. Such igure 7.arious ways of using eXperimental EarthScape (XES) experimental deposits. stratigraphic analysis (Heller et al., 2001). Predicted stratigraphy (grainsize, warmer colors are larger) using the SEDFLUX model (Syvitski and Hutton, 2001). stratigraphy (time lines) using model of Swenson et al. (2000). GSA TODAY, JULY 2001will not surprise anyone familiar withing that it is prominent in such a small-nificantly during the slow base-level cy-that. Persistent removal of sediment byand trains the flow. While the fluvialsystem was less constrained during therise, it was still sufficiently confined toinhibit fully developed lateral shifting.TESTING OF STRATIGRAPHIC MODELStools. We are approaching this from sev-eral directions. A sequence-stratigraphicanalysis of the section is shown in Figureresults with seismic-stratigraphic inter-pretation techniques, we use the modelstratigraphy to produce synthetic seismiccross sections. The methods for doingIn addition, the experimental results canbe compared directly with existing the-ory. Apart from specific hypotheses likeout-of-phase shoreline behavior, we candirectly with theoretical stratigraphy, aslem areas, such as the modest shorelinethat are not predicted well. Of course, one of the best and sim-stratigraphic pattern (Fig. 1). ItÕs a veryAnd this was a relatively simple experi-ment! If nothing else, the difficulty ofdifficult and underconstrained naturalCOMMUNITY INVOLVEMENT IN XESOne of our main motivations in writingthis article is to get the word out that theAnthony Falls Laboratory, are by no meansa closed shop. Insofar as it is sciences community. We are continuingto work on making the experimental results available via the Internet and/orCD-ROM. We also invite you to providements. We are, of course, especially in-terested in input based on field experi-comparison with experimental results.difficult enough so that we must takesight. Experimental stratigraphy is onemore Rosetta stone that will help us CKNOWLEDGMENTSthe Office of Naval Research (grantNational Oil Company, and Texaco Inc.and Molly Miller for enthusiastic and in-Allen, J.R.L., 1984, Sedimentary structures, their character andphysical basis: Amsterdam, Netherlands, Elsevier, 1206 p.Price, R.A., ed., Origin and evolution of sedimentaryD.C., American Geophysical Union, p. 29…35.graphic simulation model„Is stratigraphic inversion possible?:Manuscript received January 8, 2001;accepted May 2, 2001.