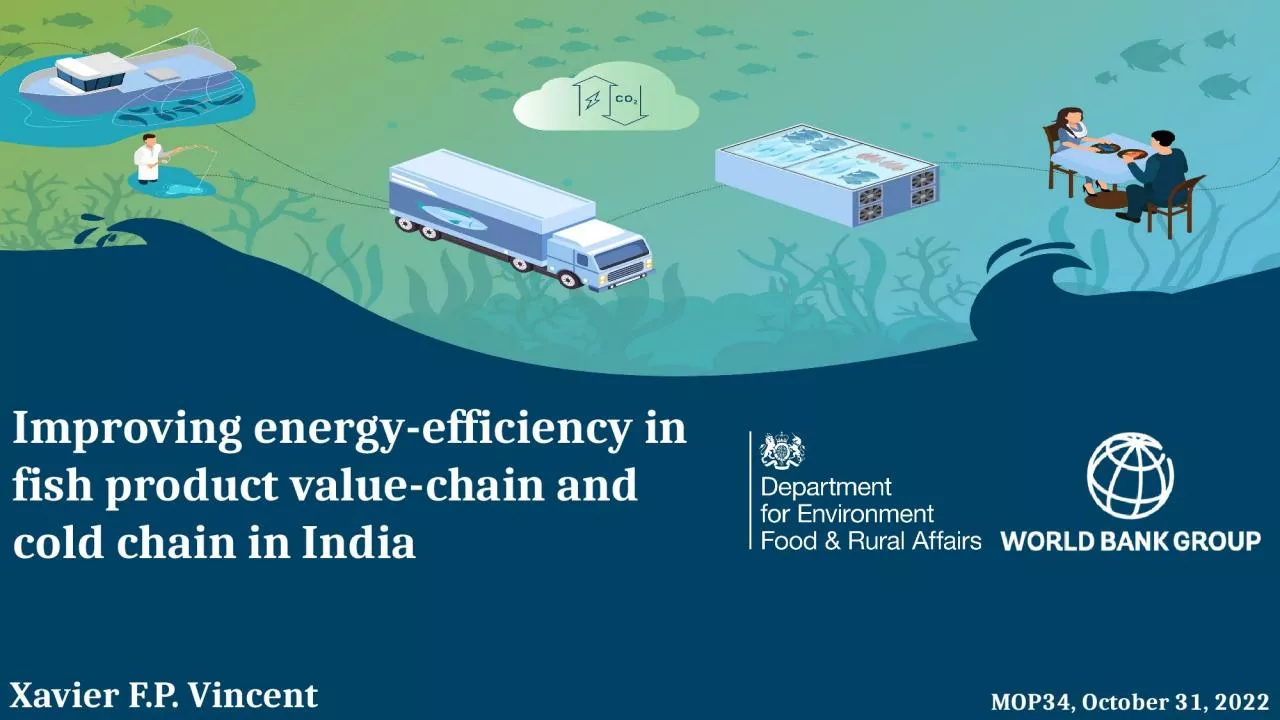
/
Improving energy-efficiency in fish product value-chain and cold chain in India Improving energy-efficiency in fish product value-chain and cold chain in India

Improving energy-efficiency in fish product value-chain and cold chain in India - PowerPoint Presentation

oryan
oryan . @oryan
Follow
65 views
Uploaded On 2024-01-29

Improving energy-efficiency in fish product value-chain and cold chain in India - PPT Presentation

Xavier FP Vincent MOP34 October 31 2022 Some key characteristics Fish product sector Fish products first exported food commodities in value globally FAO Fish value resides essentially in freshness ID: 1042905

fish energy imc shrimp energy fish shrimp imc cold fisheries audit chains 000 product chain sector million 100 efficiency

Share:

Link:

Embed:

Download Presentation from below link

Download Presentation The PPT/PDF document "Improving energy-efficiency in fish prod..." is the property of its rightful owner. Permission is granted to download and print the materials on this web site for personal, non-commercial use only, and to display it on your personal computer provided you do not modify the materials and that you retain all copyright notices contained in the materials. By downloading content from our website, you accept the terms of this agreement.


Presentation Transcript

1. Improving energy-efficiency in fish product value-chain and cold chain in IndiaXavier F.P. VincentMOP34, October 31, 2022

2. Some key characteristicsFish product sectorFish products first exported food commodities in value globally (FAO)Fish value resides essentially in freshnessVery sensitive product, temperature needs to be controlled from catch to final consumerRefrigeration, after canning, has been a key driver of sector development

3. Key characteristic - IndiaEnergy and GHG Audit in Selected Fish Product Value Chains in IndiaGROWING ECONOMYFISH PRODUCTIONPOST-HARVEST PROCESSINGCOLD CHAIN & FISHERIESFISHERIES VALUE CHAINHigh emitterIncreasing cooling needsX15 more capacity needed in 8-10 years6-8% (16 Mt) global prod. From 0.8 Mt in 1950 to 22 Mt in 20256-8% prod. growth/year4/5th global exporterGrowing domestic marketOutdated & under-capitalized30% fish lost due to poor practices including lack of cold chainsPMMSY / FIFD investing ~USD3 B in fish VC, incl. 17,500 vehicles, 3,300 markets, 356 cold unitsMissing many components of cold chainsNo audit of cold chain processes for energy efficiency, GWP and ODS footprintDominated by small fishers, unorganized, fragmented, and informal market connectionsLow domestic consumption per capita ~5-7kg p.a., target of 12 kg/y/cap by 2025

4. AQUACULTURE SHRIMPCAPTURESHRIMPCARPS(IMC)MARINEFINFISHOTHER CRUSTACEANSValuechainsEnergy and GHG Audit in Selected Fish Product Value Chains in IndiaEnergy auditsUnderstanding energy useRecommendations of best practicesEnergy and GHG Audit in Selected Value ChainsScope

5. Energy and GHG Audit in Selected Fish Product Value Chains in India

6. Total Energy Consumption in targeted fisheries value chains: 3.7 million toe/yTotal emissions in targeted fisheries value chains: 23.3 million tCO2/y

7. Fuel consumption, l/t933Eqvt. Energy, kgoe/t860Energy cost, $/t1,000Emission, CO2 /t2.5Ice, t/t4Cost of catch, $/t1,865KEY PERFORMANCE INDICATORS196,941 tCO2 /yDiesel(73,920 kl/y)Ice(316,800 t/y)Fish Catch79,200 t/yTypes of boat: IBM trawling boats(3,300 with 20% stand by)Catch quantity: 2.5-3 t/trip, 20-25 days per trip10-12 trips per boat per yearEnergy Audit – Marine catch (Veraval, Gujarat)

8. Resource efficiency measuresType ofSavingsApproximateInvestment(USD)SimplePaybackPeriod (y)Fuel switching from diesel to LNG (IBM Trawling Boats) E7,5861Usage of insulated boxes in place of thermocol/conventional boxes for raw fish storageduring fish catch (IBM Trawling Boat)E/I/W2,1852.5Usage of electric boatE60,700HighE - Energy, R - Refrigerant, W - Water, I - Ice, M - MaterialRecommendation for Marine Finfish Value Chain, IBM Trawling Boats

9. 840tCO2 /yElectricity, kWh/100,000 pieces28,731 (Shrimp) – 307,582 (IMC)Energy Cost, $/100,000 pieces$3,700 (Shrimp) – $23,230 (IMC)Overall Energy, toe/100,000 pieces3.2 (Shrimp) – 21.5 (IMC)Emission, CO2 /100,000 pieces23 (Shrimp) – 244 (IMC)Water, m3/100,000 pieces6,287 (Shrimp) – 73,800 (IMC)Material Loss20% (Shrimp) – 20% (IMC)KEY PERFORMANCE INDICATORS297tCO2 /yPost Larvae: 4,6 million Pieces/yFingerlings: 150,000 pieces/yShrimp Harvest3,7 million pieces/yFish Harvest120,000 pieces/yShrimp Cycle: 2-3 per year(3-4 months)Carp Cycle: 1 per year(9-10 months)Energy Audit Aquaculture: Farmed Shrimp and Carps (IMC)Survival Rate80%

10. Resource efficiency measuresType ofSavingsApproximateInvestment($USD)SimplePaybackPeriod (y)Installation of IoT based automatic control system for aeratorsE/M1,31,1682Installation of portable oxygen generator (pilot basis)E/M/W6,0721.5-2Installation of solar PV with battery storageE6,37,6265.8E - Energy, R - Refrigerant, W - Water, I - Ice, M - MaterialRecommendation for Shrimp Aquaculture (Farming)

11. Resource efficiency measuresType ofSavingsApproximateInvestment(USD)SimplePaybackPeriod (y)Operational ImprovementOptimisation of cable lossesE151.5Technology InterventionReplacement of old inefficient motors with IE3 motorsE4600.5Installation of IoT systems in farming pondE/M6,0720.2Installation of portable oxygen generator (pilot basis)E/M/W6,0721.5-2Renewable Energy MeasuresInstallation of solar street lightsE1.443Installation of solar PV for power generationE325.75E - Energy, R - Refrigerant, W - Water, I - Ice, M - MaterialRecommendation for IMC (Farming)

12. Processing plants/ Cold StorageFirst & Last Mile TransportationReefer TransportMultiple AreasSolar PV system for cold storageEfficient Ammonia / CO2 brine system in cold storageUse of evaporative condenser for coolingLow charge ammonia refrigeration systemTunnel IQF machinesHybrid freezer with thermal energy storageVariable frequency drive solution for refrigeration systemsElectronic level control for refrigeration systemIOT for refrigeration systemsPhase Changing Materials (PCM) technology in coolers/chest freezersAdoption of EVMobile chilling for reefer trucksSwapping to PCM materialPotential Technological interventions in Cold Chain Infrastructure

13. Estimated Impact of Recommended Interventions in Value Chains

14. Facilitating adoption of recommendations

15. A: Facilitating Working Capital Finance and Risk Management for Fisheries Sector MicroenterprisesA.1: Facilitating access of fisheries sector microenterprises to Government programs for working capital financingA.2: Facilitating adoption of insurance in fisheries sector microenterprises focusing on unserved shrimp producersB: Supporting Microenterprises to Improve Efficiencies of Fisheries Sector Value Chains C: Adoption and Expansion of Fish Product Quality and Safety Assurance SystemsD: Project Management, Monitoring and Reporting World Bank SupportIndia: Fisheries Sector COVID-19 Response And Recovery Project (P174798) - US$ 150 MILLION, 2022-27

16. Thank YouMOP34, October 31, 2022