/
CUMULATIVE ENVIRONMENTAL EFFECTS INVESTIGATION OF OUTFALLS AND DISCHAR CUMULATIVE ENVIRONMENTAL EFFECTS INVESTIGATION OF OUTFALLS AND DISCHAR

CUMULATIVE ENVIRONMENTAL EFFECTS INVESTIGATION OF OUTFALLS AND DISCHAR - PDF document

osullivan
osullivan . @osullivan
Follow
345 views
Uploaded On 2021-07-05

CUMULATIVE ENVIRONMENTAL EFFECTS INVESTIGATION OF OUTFALLS AND DISCHAR - PPT Presentation

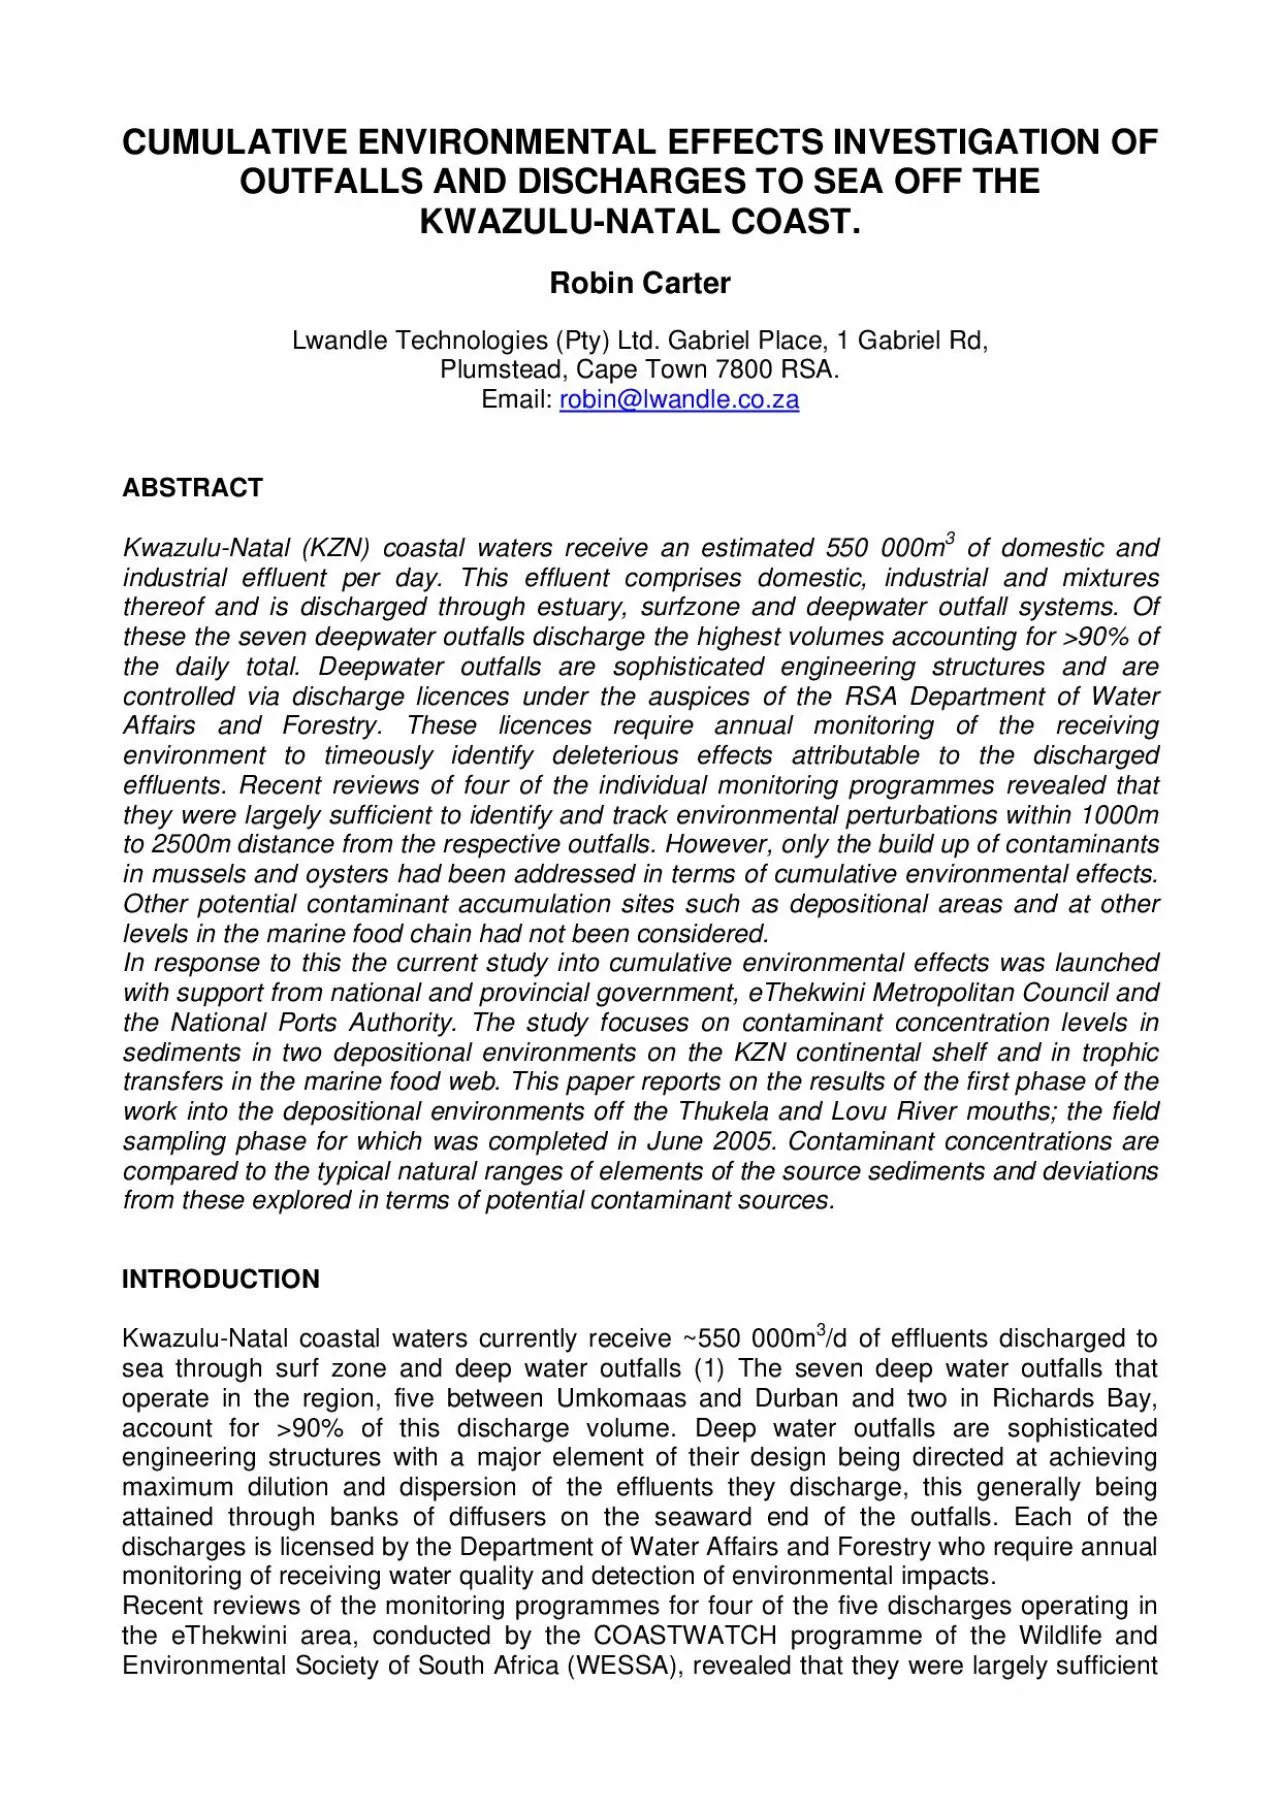
KWAZULUNATAL COAST Robin Carter Lwandle Technologies Pty Ltd Gabriel Place 1 Gabriel Rd Plumstead Cape Town 7800 RSA Email sea through surf zone and deep water outfalls 1 The seven ID: 853918

tbb tba bank trace tba tbb trace bank sites metal thukela sediment concentrations sample lovu sand fine site sediments

Share:

Link:

Embed:

Download Presentation from below link

Download Pdf The PPT/PDF document "CUMULATIVE ENVIRONMENTAL EFFECTS INVESTI..." is the property of its rightful owner. Permission is granted to download and print the materials on this web site for personal, non-commercial use only, and to display it on your personal computer provided you do not modify the materials and that you retain all copyright notices contained in the materials. By downloading content from our website, you accept the terms of this agreement.


Presentation Transcript

1 CUMULATIVE ENVIRONMENTAL EFFECTS INVESTI
CUMULATIVE ENVIRONMENTAL EFFECTS INVESTIGATION OF OUTFALLS AND DISCHARGES TO SEA OFF THE KWAZULU-NATAL COAST. Robin Carter Lwandle Technologies (Pty) Ltd. Gabriel Place, 1 Gabriel Rd, Plumstead, Cape Town 7800 RSA. Email: sea through surf zone and deep water outfalls (1) The seven deep water outfalls that �account for 90% of this discharge volume. Deep water outfalls are sophisticated with a major element of their desigffluents they discharge, this generally being ll horizontal scales (1000m to the possible cumulative effects of the discharges, ie the build up of contaminants and associated pollution effects in space ough monitoring trace metal body burdens in deposition centres distant from the marine discharges and at hi Depositional areas are generally biologically and autocthonous organic carbon (2). They are characterized by eming and Hay (4) identify two (Tugela) Bank located on the middle continentalThe Thukela Bank is an important shrimp fion and therefore has ides a potential pathway for contaminants deposited, or depositing on the Thukela Bank into humans with possible fisheries in the eThekwini coastal waters focused on rock lobster Panulirus homarus constitute possible vectors for transferring contaminants and The above concerns led to the effects of discharges into the sea on the whether contaminants discharged through outfadefining the ecological consequences and contaminants. This latter phase would then identify management priorities and w

2 hat deleterious environmental effects.
hat deleterious environmental effects. The cumulative effects study was initiated in March 2005 following preliminary sampling in 2003 and is ongoing. The reconnaissance phase sampling was complebioaccumulation of selected trace metals in rock lobster and slinger in the eThekwini area. This paper reports on the former of the two components of the reconnaissance phase of METHODS Sample sites Figure 1 shows the sample sites on the Thukela Bank and the sample locations at the Lovu fine sand belt. Three sample sites were employed on the Thukela Bank, two in the inshore 'sloppy' mud area and onSA Council for Geoscience, Durban). Water depths were ~40m at the inshore sites and ~belt was too small to allow a site comparisore individual sample positions are shown. 1000m 200m ABC Lovu Fine Sand BeltThukelaBank Figure 1: Schematic map showing the Thukela Bank sample sites and the sampling points on the Lovu fine sand belt on the Kwazulu-Natal continental shelf. The Thukela Bank has been partitioned into two sediment regimes comprising soft muds inshore (sites A & B) and stiffer muds offshore (site C). Seafloor sediment sampling At each of the three Thukela Bank sample sites five replicate samples of the seafloor sediments were retrieved by means of a Day grab. At each of the sites individual sample spacing was approximately 250m. Sediment samples at the Lovu fine sand belt were similarly retrieved. Once on

3 board ~200ml of the sediments from the
board ~200ml of the sediments from the top ~5cm of the grab sample (= in situ surface sediments) were removed and stored frozen in labelled plastic bags. Care was taken so that the sampled sediments were not exposed to possible contamination from ship surfaces or transfers in the sampling process. Sampling of the depositional areas was completed in May (Thukela Bank) and June (Lovu) 2005. Sediment Analyses Sediment property analyses were carried out by the CSIR, Durban according to their standard, certified analytical procedures. Properties analysed for included particle size, tal concentrations. Particle size analyses were carried and silt components. Organic contnitrogen concentrations were determined on a CHN analyzer. Trace metal extractions from the sediments was achieved through acidification with Nitric Acid/Perchloric Acid/Hydrogen Peroxide/ microw or included in clay minerals and the trace metals linked to the biologically unavailable silicate (quartz) fractions. Only the particle size and trace metal data are discussed in this paper. RESULTS AND DISCUSSION Sediment texture Table 1 lists the sediment particle size distand belt. It is clear that particle size for the individual Thukela Bank sites. It is also apparent that the individual samples from the Lovu fine sand belt were similar in terms of sediment texture, medium sands vs mud-muddy sand). Because of this uniformity for the purposes of this analysis the Lovu fine sand belt samples are her Table

4 1 shows that the thrconfirming its depo
1 shows that the thrconfirming its depositional character. Sediments at the two inner sites (TBA and TBB) had colour and consistency. The inner site sedimsite ('dark brown' vs 'grey') and had apparent These observations are in agreement with those reported by Flemming and Hay (4). The Lovu fine sand samples showed negligible mud content beiange. The absence of mud indicates that, at least, this particular site was not acting as a deposition ng and Hay (4) interpretation of the sediment current (2005) absence may indica as a temporary deposition centre when fluvial suspended sediment supply exceeds export by local currents. edicted the occurrence of such temporary deposition Sediment texture measured at the three Thukela Bank sample sites and at the Lovu fine sand belt sample locations. TBA = T Sediment Texture Sample %Mud %V. Fine sand %Fine Sand %Medium Sand %Coarse Sand %V. Coarse sand %Gravel 63µm 63-125µm 125-250µm 250-500µm 500-1000µm 1000-2000µm �2000µm TBA 1 96.63 1.76 1.12 0.32 0.16 0.00 0.00 TBA 2 99.72 0.00 0.28 0.00 0.00 0.00 0.00 TBA 3 98.44 1.24 0.00 0.31 0.00 0.00 0.00 TBA 4 96.32 0.57 0.8 2.01 0.29 0.00 0.00 TBA 5 98.80 1.20 0.00 0.00 0.00 0.00 0.00 TBB 1 99.19 0.65 0.00 0.16 0.00 0.00 0.00 TBB 2 93.00 4.05 1.75 1.20 0.00 0.00 0.00 TBB 3 94.85 2.48 1.34 0.76 0.57 0.00 0.00 TBB 4 94.76 2.87 1.37 1.00 0.00 0.00 0.00 TBB 5 99.15 0.85 0.00 0.00 0.00

5 0.00 0.00 TBC 1 72.44 24.77 1.96
0.00 0.00 TBC 1 72.44 24.77 1.96 0.74 0.09 0.00 0.00 TBC 2 no data TBC 3 69.47 25.48 3.48 0.56 0.56 0.45 0.00 TBC 4 72.54 22.71 3.22 1.53 0.00 0.00 0.00 TBC 5 66.69 27.61 5.14 0.56 0.00 0.00 0.00 L1 no data L2 3.26 0.95 61.68 23.02 6.62 2.92 1.55 L3 0.53 0.23 61.64 25.85 6.29 2.20 3.26 L4 0.35 4.10 57.47 28.82 7.16 1.48 0.61 L5 1.07 0.20 47.36 39.16 10.06 1.95 0.20 L6 0.80 4.07 51.04 34.58 6.15 2.80 0.56 L7 1.50 5.35 90.51 1.80 0.54 0.30 0.00 Trace metal distributions in the sedimentary features Table 2 lists the mean trace metal concentrations for each of the now four sample sites investigated. Inspection of the table shows that the Lovu fine sthe variables apart from mercury. Mercury was e measurement detection limit. Any gradients considered unreliable. of the mean trace metal concentrations across the Thukela Bank sites. The statistical procedure followed was single factor ANOVA, comparing the three locations, followed by Tukey's multiple comparison tests to determine which sites e metal concentrations were correlated with mud content of the sediments. This is due to the propensity of trace metals to adsorb to llowed by the deeper water site (mud content Bank site A, TBB = Thukela Bank site B, TBC = Thukela bank site C and Lovu = Lovu fine Sample Site Trace Metal TBA (n = 5) TBB (n = 5) TBC ( n = 5) Lovu (n = 7) Copper 22.32 (5.51) 27.04 (3.29) 15.54 (3.31) 0.15 (0

6 .34) Zinc 57.98 (13.41) 66.02 (16.05)
.34) Zinc 57.98 (13.41) 66.02 (16.05) 41.12 (4.86) 6.88 (6.09) Chromium (VI) 71.98 (14.92) 75.28 (12.13) 52.68 (9.60) 10.97 (3.29) Nickel 36.20 (9.70) 38.66 (4.88) 26.04 (3.31) 2.45 (0.86) Lead 23.98 (5.03) 26.32 (2.73) 15.92 (2.06) 3.59 (1.32) Aluminium 35320 (15841) 33240 (10734) 23140 (6700) 7650 (15200) Arsenic 7.69 (1.68) 8.15 (0.45) 4.98 (0.88) 3.89 (1.32) Mercury 0.022 (0.014) 0.030 (0.002) 0.064 (0.030) 0.038 (0.012) Mercury has been excluded. Trace Metal TBA vs TBB [TBA+TBB] vs TBC Copper TBA = TBB [TBA+TBB] Zinc TBA = TBB [TBA+TBB] Chromium (VI) TBA = TBB [TBA+TBB] Nickel TBA = TBB [TBA+TBB] Lead TBA = TBB [TBA+TBB] Aluminium TBA = TBB [TBA+TBB] Arsenic TBA = TBB [TBA+TBB] Table 3 shows that, within the Tsites (TBA and TBB) with relatively higher mtrace metal concentrations than the deeper, offshore site (TBC). This is confirmed by the relationships between trace metals and aluminium concentrations. Aluminium in marine relationship between a selected trace metal (Chromium (VI)) and aluminium for the Thukela Bank samples which gives a regression of: [Cr] = 0.001094[Al] + 33.21 (r 2 = 0.67) [1] Therefore, a substantial proportion of the variability in trace metal concentrations in this sedimentary feature is explainable by the aluminium concentration alone. 304050607080901000100002000030000400005000060000AlCr Figure 2: Scatter plot of chromium (VI) vs aluminium concentrations at th

7 e Thukela Bank sediment sample sites. Un
e Thukela Bank sediment sample sites. Units are µg/g dry weight of sediment. Comparisons of the measured trace metal concentrations with other Kwazulu-Natal sites and sediment toxicity thresholds Table 4 lists trace metal mean concentrations recently measured at various sites on the inner Kwazulu-Natal inner continental shelf along with the mean concentrations for the various sites sampled in this study. It is clear that the Thukela Bank sediments support relatively higher trace metal loads than do any of the other sites. Note that these include sites in close proximity to major marine discharges of mixtures of domestic and industrial effluents and industrial effluents. However, none of these can be classified as depositional areas as sediments are typically fine to medium sands (125µm – 500µm) and thus they are probably dispersive in character. It is also apparent that the Lovu fine sand site supports similar trace metal concentrations to the other non-depositional sites. Table 4: Mean trace metal concentrations measured at various sites on the Kwazulu-Natal inner continental shelf and sediment toxicity thresholds. All concentrations are µg/g dry weight of sediment. Shading indicates data from the current study. Trace Metal Site Copper Chromium (VI) Zinc Nickel n Water Depth Amanzimtoti (11) 0.39 5.20 1.69 0.75 9 50m Lovu 0.15 10.97 6.88 2.45 7 35m Umbogintwini (12) 2.06 35.13 20.60 7.09 50 27 – 36m Dbn S Works (11

8 ) 4.51 14.50 10.10 3.67 15 50m Co
) 4.51 14.50 10.10 3.67 15 50m Cooper Light (11) 0.86 5.11 8.55 0.92 9 50m Dbn C Works (11) 3.76 16.30 12.00 4.43 15 50m Dbn Dredge Spoil 1.60 16.10 21.10 6.70 19 50m Umdloti (11) 4.58 22.30 12.80 7.05 9 50m Thukela Bank A 22.32 71.98 57.98 36.20 5 40m Thukela Bank B 27.04 75.28 66.02 38.66 5 40m Thukela Bank C 15.54 52.68 41.12 26.04 5 55m Toxicity Thresholds (13) Effects Range Low 34 81 150 20.90 Effects Range 270 370 410 51.60 * Unpublished data – companion assessment to the current study. elevated compared to the other measured sites (ERL) threshold established for marine and estuarine sediments by Long et al (13) and that the mean chromium concentrations approach this level. 95 th percentile concentrations calcul The above implies that there are risks of toxic effects on sediment in- and epifauna on the Potential trace metal sources a Bank appear to be primarily associated with the high uvial origin. Possible sources and anthropogenic origins such as the various inants associated with component of dredge spoils removed from industrial ports in the region. Comparisons of selected trace metal concentrations, uncontaminated crustal ratios (10) allow Al ) are TM Al = ([TM] µg/g)/[Al] % [2] Enrichment factors (EF) are estimated by: EF = TM Al /TM CR [3] Where TM CR = the crustal ratio for the specific trace metal. Table 5 lists normalised copper, chromium

9 (V crustal ratios and calculated enrich
(V crustal ratios and calculated enrichment opogenic trace metal sources. The converse applies but low enrichhtly greater than 2, to crustal ratios for Thukela Bank sediments. Trace Metal Normalized Concentrations Sample Site Copper Chromium (VI) Zinc Nickel TBA 6.32 20.38 16.42 10.25 TBC 8.13 22.65 19.86 11.63 TBC 6.72 22.77 17.77 11.25 Crustal Ratios 5.5 10.2 9.9 10.2 Enrichment Factors TBA 1.15 2.00 1.66 1.00 TBB 1.48 2.22 2.01 1.14 TBB 1.22 2.23 1.79 1.10 Table 5 shows that nickel, even though high relative to published sediment toxicity thresholds is not enriched compared to that to be within its natural concentration range.sediment toxicity thresholds, chromium and be moderately enriched This implies that, for CONCLUSIONS This investigation into contaminant distributNatal continental shelf has gener Of the two depositional sites identified by Flemming and Hacan be classified as being (semi) pe The Thukela Bank has a high mud content and is charactetrace metal concentrations. On the Thukela Bank the mean nickel concentration in the sediments exceeds published sediment toxicity thresholds wh The elevated nickel concentrations appear tobut chromium and zinc appear to be enriched, possibly from anthropogenic sources. However, enrichment has not (yet) l where important environmental effects are expected. ACKNOWLEDGEMENTS The Kwazulu-Natal Cumulative Effects Inprogramme of WESSA. Funding is provided opol

10 itan Council, The riculture and Environm
itan Council, The riculture and Environmental Affairs, Marine and Coastal tment of Environmental Affairs and Forestry and the iderable assistance has been rendered to the project by REFERENCES 1. Republic of South Africa, and Forestry. Water Quality Management Series Sub-Series No. MS 13.2. Operational policy for the disposal of 2. Libes, S, "An Introduction to Marine Biogeochemistry", John 3. B Flemming, Trans R. Soc. S Afr 4. B Flemming and R Hay, Coastal Ocean Studies off Natal, South Africa (ed E H Schumann). Lecture Notes on Coastal and Estuarine Studies, 26, p 47-80 (1988). 5. JC Groeneveld and R Mellville-Smith, S. 6. GM Branch, CL Griffiths, ML Branch and LE Beckley, "Two Oceans: A Guide to the Marine Life of Southern Africa", pub. David Phillip, Johannesburg, 360pp (1994). 7. CSIR, Hood Point Environmental Ba 99109A (1999). 8. JH Zar, "Biostatistical Analysis", 9. Australia and New Zealand Environment and Conservation Council (ANZECC), Australian and New Zealand guidelines www.deh.gov.au/water/ ). 10. CSIR, Assessment of sediment biogeochemical characterist Estuary-Maputo Bay system in order to devise a low risk dredging-disposal management plan linked to the proposed MO ENV/S-I 98047 (1998). 11. CSIR, Sea disposal of sewage: Envirregion. CSIR Report 12. Physalia Consultant and Forensic Ecologists, Ecological monitoring of the coastal marine outfalls from the Umbogintwini site (2004). 13. E Long, S MacDonald, ronmental Management, 19, p 81- 97 (1995).