/
66% Calcium 19% Vit E 	 Nutrients 66% Calcium 19% Vit E 	 Nutrients

66% Calcium 19% Vit E Nutrients - PowerPoint Presentation

pagi
pagi . @pagi
Follow
0 views
Uploaded On 2024-03-13

66% Calcium 19% Vit E Nutrients - PPT Presentation

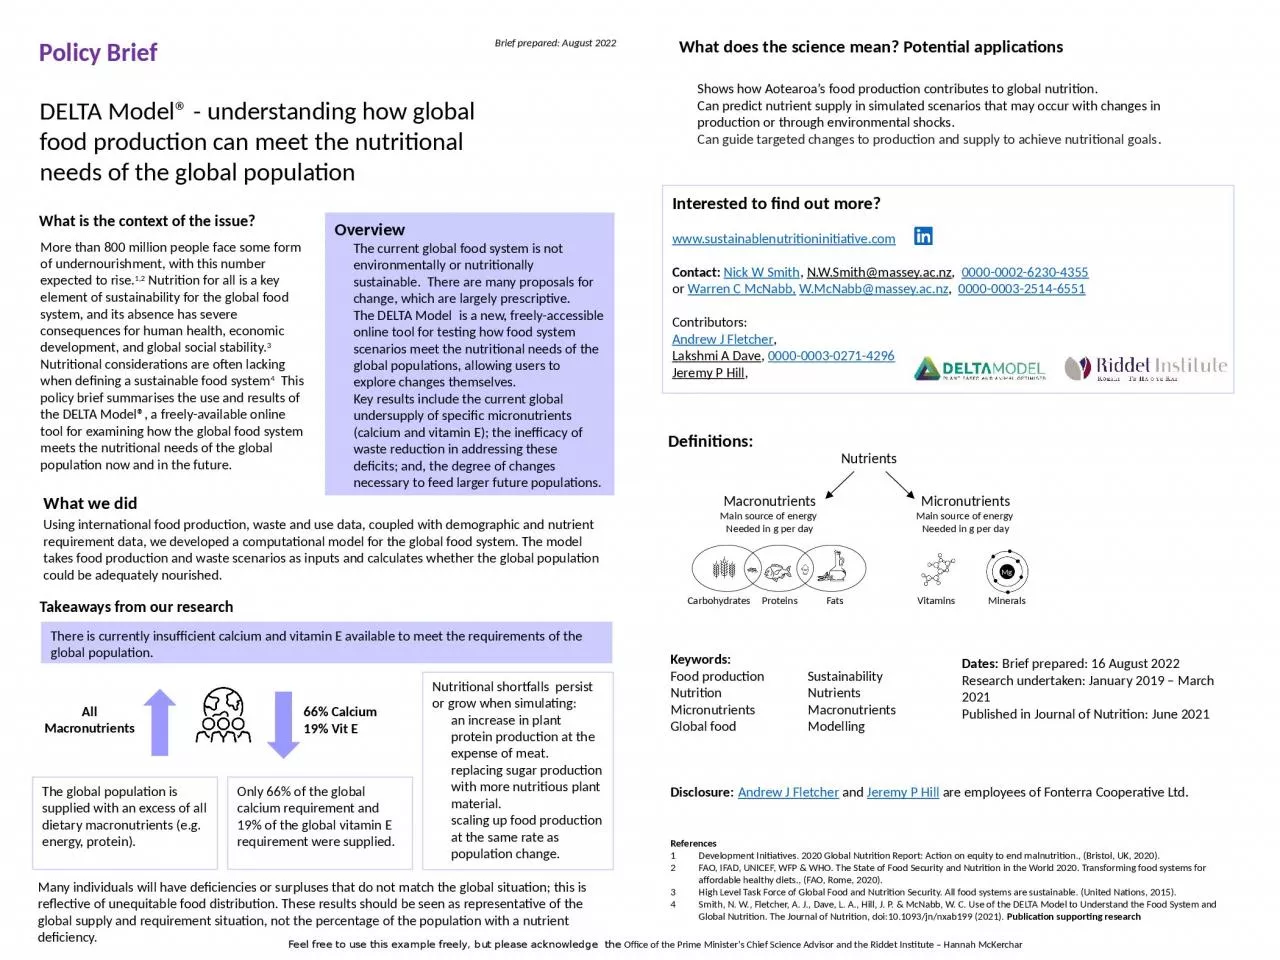
Macronutrients Main source of energy Needed in g per day Micronutrients Main source of energy Needed in g per day Carbohydrates Proteins Fats Mg Minerals Vitamins DELTA Model understanding how global food production can meet the nutritional needs of the global population  ID: 1047697

food global nutrition production global food production nutrition research population system key nutritional freely icons requirement policy 2020 science

Share:

Link:

Embed:

Download Presentation from below link

Download Presentation The PPT/PDF document "66% Calcium 19% Vit E Nutrients" is the property of its rightful owner. Permission is granted to download and print the materials on this web site for personal, non-commercial use only, and to display it on your personal computer provided you do not modify the materials and that you retain all copyright notices contained in the materials. By downloading content from our website, you accept the terms of this agreement.


Presentation Transcript

1. 66% Calcium19% Vit E NutrientsMacronutrientsMain source of energy Needed in g per dayMicronutrientsMain source of energy Needed in g per dayCarbohydratesProteinsFatsMgMineralsVitaminsDELTA Model® - understanding how global food production can meet the nutritional needs of the global population What is the context of the issue? More than 800 million people face some form of undernourishment, with this number expected to rise.1,2 Nutrition for all is a key element of sustainability for the global food system, and its absence has severe consequences for human health, economic development, and global social stability.3 Nutritional considerations are often lacking when defining a sustainable food system4 This policy brief summarises the use and results of the DELTA Model®, a freely-available online tool for examining how the global food system meets the nutritional needs of the global population now and in the future.Overview The current global food system is not environmentally or nutritionally sustainable. There are many proposals for change, which are largely prescriptive.The DELTA Model is a new, freely-accessible online tool for testing how food system scenarios meet the nutritional needs of the global populations, allowing users to explore changes themselves.Key results include the current global undersupply of specific micronutrients (calcium and vitamin E); the inefficacy of waste reduction in addressing these deficits; and, the degree of changes necessary to feed larger future populations.   Policy BriefBrief prepared: August 2022  What we didUsing international food production, waste and use data, coupled with demographic and nutrient requirement data, we developed a computational model for the global food system. The model takes food production and waste scenarios as inputs and calculates whether the global population could be adequately nourished.Takeaways from our research All MacronutrientsThere is currently insufficient calcium and vitamin E available to meet the requirements of the global population.Only 66% of the global calcium requirement and 19% of the global vitamin E requirement were supplied.Nutritional shortfalls persist or grow when simulating:an increase in plant protein production at the expense of meat.replacing sugar production with more nutritious plant material.scaling up food production at the same rate as population change.The global population is supplied with an excess of all dietary macronutrients (e.g. energy, protein).Many individuals will have deficiencies or surpluses that do not match the global situation; this is reflective of unequitable food distribution. These results should be seen as representative of the global supply and requirement situation, not the percentage of the population with a nutrient deficiency.What does the science mean? Potential applicationsShows how Aotearoa’s food production contributes to global nutrition.Can predict nutrient supply in simulated scenarios that may occur with changes in production or through environmental shocks.Can guide targeted changes to production and supply to achieve nutritional goals.  Interested to find out more?  www.sustainablenutritioninitiative.com    Contact: Nick W Smith, N.W.Smith@massey.ac.nz, 0000-0002-6230-4355 or Warren C McNabb, W.McNabb@massey.ac.nz, 0000-0003-2514-6551   Contributors: Andrew J Fletcher,Lakshmi A Dave, 0000-0003-0271-4296   Jeremy P Hill,         Definitions:Keywords:Food production SustainabilityNutrition NutrientsMicronutrients Macronutrients Global food ModellingDates: Brief prepared: 16 August 2022  Research undertaken: January 2019 – March 2021  Published in Journal of Nutrition: June 2021    Disclosure: Andrew J Fletcher and Jeremy P Hill are employees of Fonterra Cooperative Ltd.   References1 Development Initiatives. 2020 Global Nutrition Report: Action on equity to end malnutrition., (Bristol, UK, 2020).  2 FAO, IFAD, UNICEF, WFP & WHO. The State of Food Security and Nutrition in the World 2020. Transforming food systems for affordable healthy diets., (FAO, Rome, 2020).  3 High Level Task Force of Global Food and Nutrition Security. All food systems are sustainable. (United Nations, 2015).  4 Smith, N. W., Fletcher, A. J., Dave, L. A., Hill, J. P. & McNabb, W. C. Use of the DELTA Model to Understand the Food System and Global Nutrition. The Journal of Nutrition, doi:10.1093/jn/nxab199 (2021). Publication supporting research Feel free to use this example freely, but please acknowledge the Office of the Prime Minister’s Chief Science Advisor and the Riddet Institute – Hannah McKerchar

2. You can refer to the following examples and use a template to create your own Policy Brief. Templates are available in Word and PowerPoint.The numbers in the boxes (1-6) relate to the numbering used in the Guide under the heading 'Structure of the Policy Brief’.Page 1Short, descriptive title 2. Provide context required to understand the topic. 1. Overview that outlines the key points of the briefing. Highlighted for impact.Date of document 3. What did you do? Description of research.4. What did you find? Key takeaway of the study in one sentence.  Highlighted for impact.4. Use icons, charts, graphs, maps to help explain information. You can search for icons at nounproject.com. 4. Additional details of key takeaways of study in 3- 4 points4. Summary that critically assesses the studyFeel free to use this example freely, but please acknowledge the Office of the Prime Minister’s Chief Science Advisor and the Riddet Institute – Hannah McKerchar

3. Page 26. Showcase real-world applications. Suggest a range of applications.Hyperlink to information on research and educational material.Clearly list who to contact, hyperlink to research organisation. Include Orcid number.List team members and contributors.Define technical terms that are not widely known.Keywords, avoid technical terms.List date brief prepared and any updates, when research undertaken and when research published.Note any conflicts of interest or association to industry.References, highlight publication supporting research in briefCreate an account and search/download icons (like those used in the example) from NounProject.com to represent key takeaways and definitions. The site has millions of icons to choose from. Adjust the color of the icons, download, and upload them to PowerPoint or Word.Highlight contact details, you want to be easily contacted.Feel free to use this example freely, but please acknowledge the Office of the Prime Minister’s Chief Science Advisor and the Riddet Institute – Hannah McKerchar