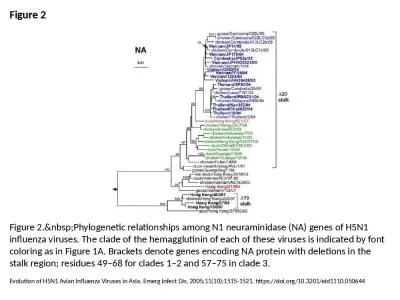
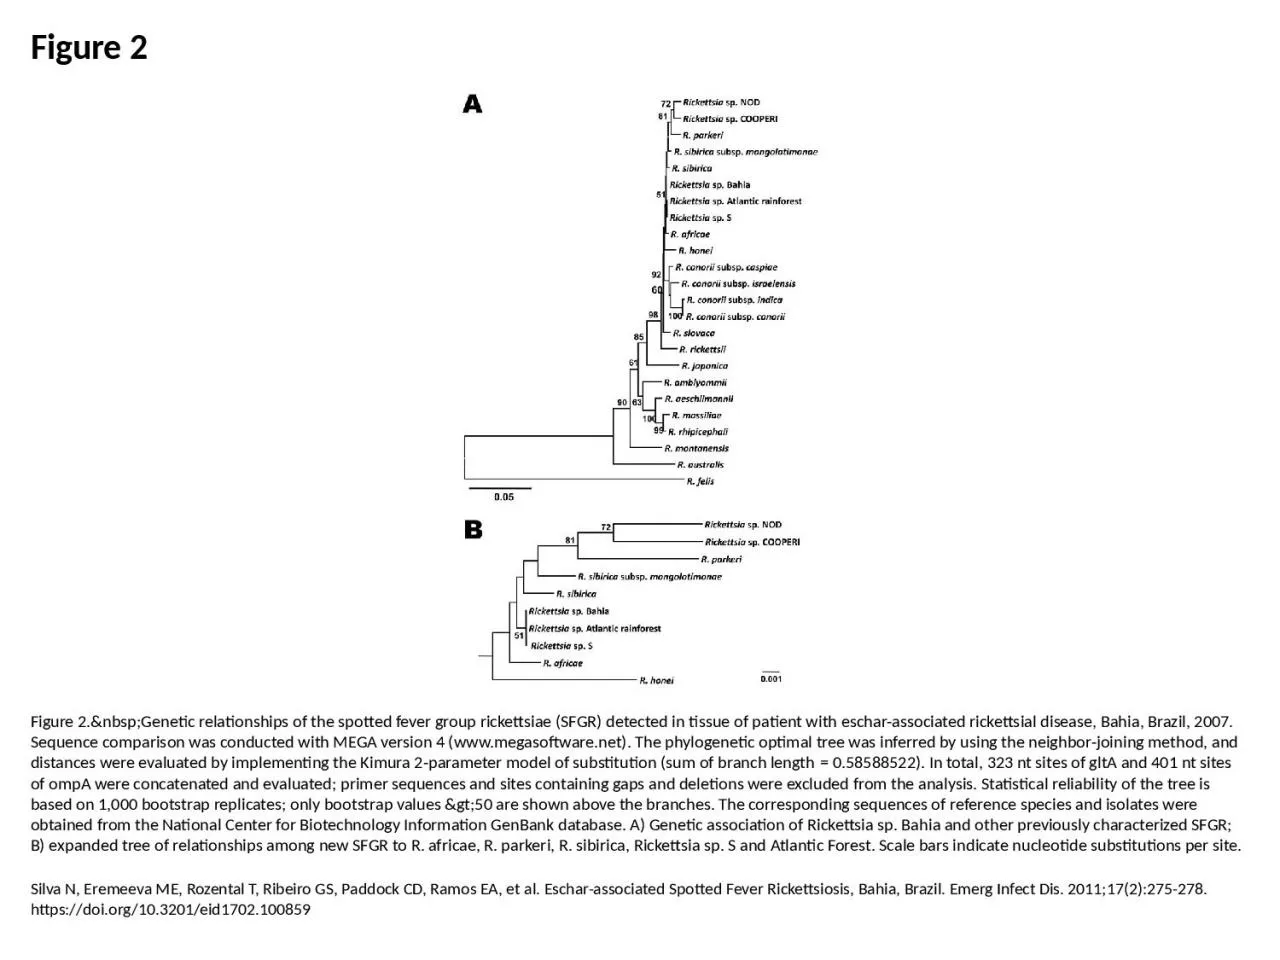
/
Figure 2 Figure 2. Genetic relationships of the spotted fever group rickettsiae Figure 2 Figure 2. Genetic relationships of the spotted fever group rickettsiae

Figure 2 Figure 2. Genetic relationships of the spotted fever group rickettsiae - PowerPoint Presentation

pagi
pagi . @pagi
Follow
27 views
Uploaded On 2024-02-09

Figure 2 Figure 2. Genetic relationships of the spotted fever group rickettsiae - PPT Presentation

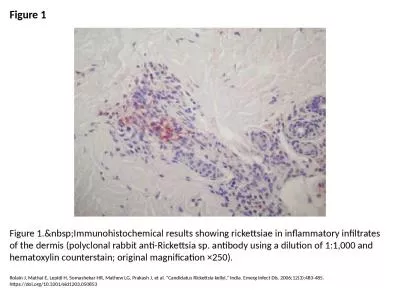
Silva N Eremeeva ME Rozental T Ribeiro GS Paddock CD Ramos EA et al Escharassociated Spotted Fever Rickettsiosis Bahia Brazil Emerg Infect Dis 2011172275278 httpsdoiorg103201eid1702100859 ID: 1045342

bahia sfgr sites tree sfgr bahia tree sites brazil rickettsia evaluated sequences eschar bootstrap fever spotted relationships genetic amp

Share:

Link:

Embed:

Download Presentation from below link

Download Presentation The PPT/PDF document "Figure 2 Figure 2. Genetic rela..." is the property of its rightful owner. Permission is granted to download and print the materials on this web site for personal, non-commercial use only, and to display it on your personal computer provided you do not modify the materials and that you retain all copyright notices contained in the materials. By downloading content from our website, you accept the terms of this agreement.


Presentation Transcript

1. Figure 2Figure 2. Genetic relationships of the spotted fever group rickettsiae (SFGR) detected in tissue of patient with eschar-associated rickettsial disease, Bahia, Brazil, 2007. Sequence comparison was conducted with MEGA version 4 (www.megasoftware.net). The phylogenetic optimal tree was inferred by using the neighbor-joining method, and distances were evaluated by implementing the Kimura 2-parameter model of substitution (sum of branch length = 0.58588522). In total, 323 nt sites of gltA and 401 nt sites of ompA were concatenated and evaluated; primer sequences and sites containing gaps and deletions were excluded from the analysis. Statistical reliability of the tree is based on 1,000 bootstrap replicates; only bootstrap values >50 are shown above the branches. The corresponding sequences of reference species and isolates were obtained from the National Center for Biotechnology Information GenBank database. A) Genetic association of Rickettsia sp. Bahia and other previously characterized SFGR; B) expanded tree of relationships among new SFGR to R. africae, R. parkeri, R. sibirica, Rickettsia sp. S and Atlantic Forest. Scale bars indicate nucleotide substitutions per site.Silva N, Eremeeva ME, Rozental T, Ribeiro GS, Paddock CD, Ramos EA, et al. Eschar-associated Spotted Fever Rickettsiosis, Bahia, Brazil. Emerg Infect Dis. 2011;17(2):275-278. https://doi.org/10.3201/eid1702.100859