/
38 MonthlyReview 38 MonthlyReview

38 MonthlyReview - PDF document

pasty-toler
pasty-toler . @pasty-toler
Follow
379 views
Uploaded On 2015-11-13

38 MonthlyReview - PPT Presentation

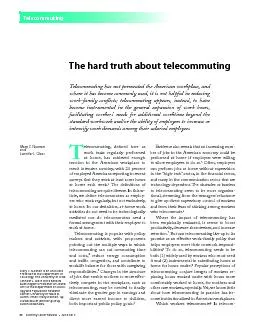
The hard truth about telecommuting Telecommuting has not permeated the American workplace and where it has become commonly used it is not helpful in reducing workfamily conicts telecommuting ap ID: 191425

The hard truth about telecommuting Telecommuting

Share:

Link:

Embed:

Download Presentation from below link

Download Pdf The PPT/PDF document "38 MonthlyReview" is the property of its rightful owner. Permission is granted to download and print the materials on this web site for personal, non-commercial use only, and to display it on your personal computer provided you do not modify the materials and that you retain all copyright notices contained in the materials. By downloading content from our website, you accept the terms of this agreement.


Presentation Transcript

38 MonthlyReview The hard truth about telecommuting Telecommuting has not permeated the American workplace, and where it has become commonly used, it is not helpful in reducing work-family conicts; telecommuting appears, instead, to have become instrumental in the general expansion of work hours, facilitating workers’ needs for additional worktime beyond the standard workweek and/or the ability of employers to increase or intensify work demands among their salaried employees Mary C. Noonan and MaryAssociate ProfessoratDepartment Sociology,TheUniversityIowa; JenniferBarbara Regents ArtsatDepartmentSociol - PopulationResearch Center,UniversityTexasat Austin. mary-noonan-1@ uiowa.edu or j ennifer-glass@ . T elecommuting, dened here as work tasks regularly performed at home, has achieved enough traction in the American workplace to merit intensive scrutiny, with 24 percent of employed Americans reporting in recent surveys that they work at least some hours at home each week. 1 e denitions of telecommuting are quite diverse. In this ar - ticle, we dene telecommuters as employ - at home. In our denition, at-home work activities do not need to be technologically mediated nor do telecommuters need a formal arrangement with their employer to work at home. Telecommuting is popular with policy makers and activists, with proponents pointing out the multiple ways in which telecommuting can cut commuting time and costs, 2 reduce energy consumption and trac congestion, and contribute to worklife balance for those with caregiving responsibilities. 3 of jobs that enable mothers to more eec - tively compete in the workplace, such as telecommuting, may be needed to nally eliminate the gender gap in earnings and direct more earned income to children, both important public policy goals. 4 Evidence also reveals that an increasing num - ber of jobs in the American economy could be performed at home if employers were willing to allow employees to do so. 5 Often, employees can perform jobs at home without supervision and many in the communication sector that are technology dependent. e obstacles or barriers to telecommuting seem to be more organiza - tional, stemming from the managers’ reluctance to give up direct supervisory control of workers and from their fears of shirking among workers who telecommute. 6 Where the impact of telecommuting has been empirically evaluated, it seems to boost productivity, decrease absenteeism, and increase retention. 7 But can telecommuting live up to its promise as an eective work-family policy that Telecommuting - bilities? To do so, telecommuting needs to be both (1) widely used by workers who most need it and (2) instrumental in substituting hours at home for hours onsite. 8 Popular perceptions of telecommuting conjure images of workers re - placing hours worked onsite with hours more comfortably worked at home, for mothers and other care workers, especially. Yet, we know little about how telecommuting in practice has be - come institutionalized in American workplaces. Which workers telecommute? Is telecom - MonthlyReview2012 39 muting an eective strategy that lowers employees’ average hours worked onsite, or is telecommuting as - sociated with longer average weekly work hours? To preview our results here, we nd that telecommuting has not extensively permeated the American work - place, and where it has become commonly used, it is not unequivocally helpful in reducing work-family conicts. Instead, telecommuting appears to have be - come instrumental in the general expansion of work hours, facilitating workers’ needs for additional work - time beyond the standard workweek and/or the ability of employers to increase or intensify work demands among their salaried employees. We use two nationally representative data sources, the National Longitudinal Survey of Youth ( NLSY ) 1979 panel (hereafter, noted as the NLSY ) and special supplements from the U.S. Census Current Population Survey ( CPS ), to ascertain (1) trends over time in the use of telecommuting among employees in the civilian labor force, (2) who telecommutes across the population of employees, and (3) the relationship between telecom - muting and longer work hours among employees. ese two data sources provide information on telecommut - ing from the mid- to late 1990s through the mid-2000s, a period in which interest and capacity for telecom - muting dramatically increased among U.S. businesses. (Note that we did not use more recent data because the Work Schedules and Work at Home May CPS supple - ment was not elded after 2004.) Together, these two datasets allow us to ascertain any general changes over time in the proportion of employees who telecommute and the time intensity of their telecommuting at their main job. We further disag - gregate telecommuting hours into those hours that are encapsulated within the 40-hour workweek (such that, regardless of the day or time worked, these telecommut - ing hours do not raise total work hours per week above the statutory 40-hour threshold) and those hours that extended the total number of hours worked per week beyond 40. By dividing telecommuting hours into these two categories, we are able to determine whether tele - commuting either replaces hours that otherwise would have been worked onsite during a standard 40-hour workweek or expands the workweek beyond the 40 or more hours already worked onsite. In the following sections, we briey describe our data sources and measures, provide results from our analysis of the data, and summarize the lessons learned from investigating the implementation of telecommuting in American workplaces. Methods e NLSY is a national probability sample of 12,686 women and men living in the United States and born between 1957 and 1964. e sample was interviewed annually from 1979 to 1994 and biennially thereafter. In 1989, the NLSY began ask - ing questions about the amount of time respondents worked at home. To most closely match the years of the CPS supplements (described in the next paragraph), we pool 3 years from the NLSY for our analysis: 1998, 2002, and 2004. e CPS is a monthly survey of about 50,000 households representing the nation’s civilian noninstitutional population 16 years of age and over. We use data from the special Work Schedules and Work at Home supplement to the May 1997, 2001, and 2004 CPS , which asks workers whether they worked at home as part of their job. e advantage of the CPS data is that, unlike the NLSY , it covers a broader age range of workers so that we can compare a cohort similar in age with the NLSY, as well as a younger cohort of workers who might be more technologically sophisticated and more amenable to telecom - muting. As such, we restrict the CPS sample to workers 22 to 40 years of age in 1997, 26 to 44 in 2001, and 29 to 47 in 2004. We further restrict our sample to individuals who worked at least 20 hours per week in nonagricultural jobs and who provided valid data on all the key variables. Workers who were self-employed or worked exclusively at home are also excluded from the sample. e nal sample sizes are 16,298 for the NLSY and 50,452 for the CPS . Our two main variables of interest are total hours worked per week for the main job and total hours worked per week at home for the main job . 9 We use these two measures to cre - ate two dummy variables indicating respondents who worked overtime (i.e., more than 40, 50, and 60 hours per week) and who telecommuted (i.e., worked at least 1 hour at home per week), respectively. Finally, for those respondents who tele - commuted, we disaggregate telecommuting hours into r egu - lar telecommuting hours and overtime telecommuting hours . We create these two variables by rst creating a variable equal to hours worked per week onsite for the main job . If total on - site work hours are less than 40, we categorize telecommut - ing hours that do not raise total work hours above 40 hours as regular telecommuting hours. If total onsite work hours equal 40 or more, we categorize all telecommuting hours as overtime telecommuting hours. We do not know the day or time that onsite and/or telecommuting hours were worked; instead, in our categorization, we assume that onsite hours are “worked rst” and telecommuting hours come second. Note that some workers reported both types of telecommut - ing hours. For example, a worker reporting 45 total hours of work per week, of which 10 are worked exclusively at home, Telecommuting 40 MonthlyReview would yield 5 hours of regular telecommuting and 5 hours of overtime telecommuting by our denitions. Control variables include occupation (measured with three categories: managerial/professional, sales, and other), education (measured with four categories: less than high school, high school diploma, some college, and col - lege degree or higher), gender, race/ethnicity (measured with three categories: other [White, Asian, etc.], Black, and Hispanic), marital status (measured with three catego - ries: never married, married, and separated/divorced/wid - owed), parental status (dummy variable indicating whether a child 0 to 18 years old lives in household), and age. Finally, we create synthetic age cohorts for the CPS data based on the age range of the NLSY sample (32 to 40 years old in 1997). We dene the older cohort for the CPS as 32 to 40 years old in 1997, 36 to 44 years old in 2001, and 39 to 47 years old in 2004. e younger cohort from the CPS , by contrast, incorporated workers who were 22 to 29 years old in 1997, maturing to 26 to 33 in 2001 and 29 to 36 in 2004. ese two cohorts eectively cover the career stages in which most earnings growth occurs, from the mid-20s to late 40s. To begin our analysis, we present trends over time in the use of telecommuting for each sample as a whole and then for various demographic groups. Next, we present descriptive statistics on all variables by telecommuting status for the CPS sample and the NLSY sample. For each sample, we perform statistical tests to determine if dierences exist between tele - commuters and nontelecommuters. We pay special attention to the average hours of telecommuting among telecommuters and discuss how much telecommuting replaces onsite hours within the rst 40 hours worked and how much telecom - muting extends the workweek beyond 40 hours. Finally, we estimate logistic regression models to predict the likelihood of working overtime based on telecommuting status, includ - ing the control variables just described. Important to note is that neither the CPS nor the NLSY provides information on whether or not the employee has an option to telecommute. Our regression model assumes that all workers are able to telecommute and that “telecommuting status” is exogenous to work hours. In reality, the ability to telecommute is likely a function of one’s occupational type and, within occupation, one’s performance. Both occupation and employee perfor - mance are likely correlated with hours worked. We deal with this endogeneity problem by controlling for occupation in our models; data on employee performance are not available. Results To begin, we examine trends over time in telecommuting for all workers and then for various demographic groups. According to our NLSY and CPS estimates, approximately 10 percent of workers telecommuted in the mid-1990s (chart 1). e rate of telecommuting increased slightly to 17 percent in the early 2000s and then remained constant to the mid-2000s. 10 Our results suggest that telecommut - ing rates are not signicantly dierent between younger and older cohorts of workers. Furthermore, no evidence suggests that, among telecommuters, the number of hours spent telecommuting has increased over time (results not shown). For the remainder of our analysis, we use a single CPS sample, not dierentiated by age (i.e., the younger and older cohorts are pooled together). Next, we examine how telecommuting varies by educa - tional attainment, occupation, and parental status (chart 2). Here, we present data from the CPS only; results from the NLSY are similar to the CPS results. CPS results show that parents are no more likely than the population as a whole to telecommute, and mothers do not telecommute more than fathers (about 17 percent for each group, results not shown). However, college-educated workers and those in managerial and professional occupations are signicantly more likely to telecommute than the population as a whole. Table 1 presents descriptive statistics on our key vari - ables by telecommuting status for both datasets, NLSY (1998, 2002, 2004) and CPS (1997, 2001, 2004). Most no - tably, telecommuters worked between 5 and 7 total hours more per week than nontelecommuters. Telecommuters were signicantly less likely to work a regular schedule (i.e., between 20 and 40 hours per week) and were more likely to work overtime, regardless of how overtime is de - ned (i.e., as working more than 40, 50, or 60 hours per week). Among telecommuters, the average number of hours spent telecommuting each week is relatively modest, ap - proximately 6 hours per week in both the CPS and NLSY samples. But fully 67 percent (i.e., 4.17/6.20) of telecom - muting hours in the NLSY and almost 50 percent (i.e., 3.21/6.75) in the CPS occur in the overtime portion of the weekly hours distribution (see table 1, “Hours worked by location”). is nding suggests that telecommuting is not being predominately used as a substitute for working onsite during the rst 40 hours worked per week. Telecommuters are signicantly more likely to have a college degree and to work in managerial/professional occupations compared with those who do not work at home. Interestingly, parents are only slightly more pre - dominant among telecommuters than nontelecommut - ers. Telecommuters are less likely to be Black or Hispanic and less likely to be married compared with those not telecommuting. MonthlyReview2012 41 Chart 1. Percent Percent Percentage of workers telecommuting over time, by cohort N OTES Youngercohortyearscohortyears S OURCES NationalLongitudinalSurveyYouth supplementfromU.S.CensusCurrentPopulation Survey CPS ). Chart 2. Percent Percent Percentage of workers telecommuting over time, by education, occupation, and parental status S OURCE supplementfromU.S.CensusCurrentPopulationSurvey CPS ). cohort CPS youngercohort CPS cohort All Managerial/professional Collegeeducated Parent Telecommuting 42 MonthlyReview Table 2 presents the results of our logistic regression models predicting the likelihood of working overtime as a function of telecommuting status. We model three versions of overtime: working more than 40 total hours per week, more than 50 total hours per week, and more than 60 total hours per week. In each model, we control for occupation, education, gender, race/ethnicity, marital status, and age. Since the 2001 CPS did not collect data on parental status, we do not include this variable in the models. Because logistic regression coecients do not Variable NLSY (1998, 2002, 2004) Telecommuting status Statistical test CPS (1997, 2001, 2004) Telecommuting status Statistical test No Yes No Yes Total hours worked per week ) 45.45 ) ) ) more ) 53 ) more ) more ) 6 ) Hours worked by location Onsite ) ) At — — — — Regular — — — 3.54 — Overtime — — — — Occupation (percent) Managerial/professional ) ) Sales ) ) Other ) 63 ) Education (percent) Less 8 ) ) High ) 35 ) Somecollege ) ) Collegedegree ) 68 ) Gender (percent) Male 54 3 ) 55 53 3 ) Female 46 3 ) 45 3 ) Race/ethnicity (percent) Other(White,Asian,etc.) 88 ) 88 ) 8 ) 6 ) Hispanic 5 ) 6 ) Marital status (percent) Nevermarried ) ) Married 63 ) ) Separated/divorced/widowed ) ) Parental status (percent) Parentyes) 65 ) ) Age 3 ) 34.88 ) Number — — p p 3 p N OTES   Allstatisticsareweighted.Samplerespondentswho wereself-employed,workedatweek, workedatonsite.InCurrentPopulationSurvey CPS) data, parentalstatusstatistics forvariablerepresentyears. S OURCES   NationalLongitudinalSurveyYouth supplementfromU.S.Census CPS . Table 1. Descriptive statistics by telecommuting status Hours worked per week (percent) MonthlyReview2012 43 Variable NLSY hours worked per week (1998, 2002, 2004) CPS hours worked per week (1997, 2001, 2004) 41 or more 51 or more 61 or more 41 or more 51 or more 61 or more Telecommute status (1 = yes) Occupation Managerial/professional .36 3 Sales .46 Other 4 ) 4 ) 4 ) 4 ) 4 ) 4 ) Education Less .36 3 3 High 5 Somecollege 5 Collegedegree 4 ) 4 ) 4 ) 4 ) 4 ) 4 ) Gender Female Male 4 ) 4 ) 4 ) 4 ) 4 ) 4 ) Race/ethnicity White 4 ) 4 ) 4 ) 4 ) 4 ) 4 ) .38 Hispanic Marital status Nevermarried 5 Married 4 ) 4 ) 4 ) 4 ) 4 ) 4 ) Separated/divorced/widowed 3 3 Age Constant 5 5 Number p p 3 p 4 Omittedcategory. 5 p N OTES   Allstatisticsareweighted.Samplerespondents wereself-employed,workedatweek,worked atonsite.Parentalstatusregression availableCurrentPopulationSurvey CPS). S OURCES   NationalLongitudinalSurveyYouth supplementfromU.S.Census CPS . Logistic regression coecients predicting working overtime Table 2. Telecommuting 44 MonthlyReview show how much the probability of an event changes when the predictors change, we translate the coecients into predicted probabilities for four “ideal types” (cases) in table 3. For each case, we calculate the probability of working overtime, assuming the individual is not a telecommuter and again assuming the individual is a telecommuter. In both datasets and in all models, the probability of work - ing overtime is higher for telecommuters compared with nontelecommuters. e dierence in the probability of working overtime between the two groups is largest when we dene overtime as 41 hours or more, and smaller, but still signicant, when overtime is dened as working 61 hours or more. O UR ANALYSIS OF TELECOMMUTING has yielded several surprising ndings. ough more and more employ - ers claim to be oering exible work options, the propor - tion of workers who telecommute has been essentially at over the mid-1990s to mid-2000s and is no larger among younger cohorts of workers than older cohorts. Moreover, the average number of hours spent telecommuting each week is relatively modest, around 6 hours per week in both the CPS and NLSY samples. No evidence suggests that the number of hours spent telecommuting is increasing over time. Our descriptive results suggest that labor demand for work-family accommodation does not seem to propel the distribution of telecommuting hours. None of the expected relationships under such a scenario are present in the data—parents of dependent children, for example, are no more likely to telecommute than the population as a whole. Meanwhile, indicators that suggest a supply- side explanation—such as occupational sector and work hours—are more strongly related to telecommuting hours. As others have noted, the ability to work at home appears to be systematically related to authority and sta - tus in the workplace. Managerial and professional work - ers are more likely than others to have the type of tasks and autonomous control of their work schedule necessary to perform work at home. While telecommuting may in theory be a solution to the dilemmas of combining work and family, telecommuting in practice does not unequiv - Table 3. Predicted probability of working overtime as a function of telecommuting status and other variables Case NLSY hours worked per week (1998, 2002, 2004) CPS hours worked per week (1997, 2001, 2004) 41 or more 51 or more 61 or more 41 or more 51 or more 61 or more Case Man,collegedegree,managerial/professional telecommuting 4 Yestelecommuting 8 68 33 8 Di�erence 6 5 Case Man,occupation telecommuting 3 4 Yestelecommuting 84 43 8 Di�erence 4 Case Woman,collegedegree,managerial/professional telecommuting 3 5 Yestelecommuting 3 Di�erence Case Woman,occupation telecommuting 3 4 Yestelecommuting 58 4 33 3 Di�erence 45 3 6 N OTES   Inpredictions,workerWhite,married,years old.Predictionsestimatedcoe�cientsfrom S OURCES   NationalLongitudinalSurveyYouth supplementfromU.S.CensusCurrentPopulationSurvey CPS ). [Inpercent] MonthlyReview2012 45 ocally meet the needs of workers with signicant caregiv - ing responsibilities. e most telling problem with telecommuting as a worklife solution is its strong relationship to long work hours and the “work devotion schema.” 11 Fully 67 percent of telecommuting hours in the NLSY and almost 50 per - cent in the CPS push respondents’ work hours above 40 per week and essentially occur as overtime work. is dynamic suggests that telecommuting in practice expands to meet workers’ needs for additional worktime beyond the stan - dard workweek. As a strategy of resistance to longer work hours at the oce, telecommuting appears to be somewhat successful in relocating those hours but not eliminating them. A less sanguine interpretation is that the ability of employees to work at home may actually allow employers to raise expectations for work availability during evenings and weekends and foster longer workdays and workweeks. Future research employing longitudinal data should explore whether employees increase their work hours after initia - tion of telecommuting. Since telecommuting is intrinsically linked to infor - mation technologies that facilitate 24/7 communication between clients, coworkers, and supervisors, telecommut - ing can potentially increase the penetration of work tasks into home time. Bolstering this interpretation, the 2008 Pew Networked Workers survey reports that the majority of wired workers report telecommuting technology has increased their overall work hours and that workers use technology, especially email, to perform work tasks even when sick or on vacation. 12 Careful monitoring of this blurred boundary between work and home time and the erosion of “normal working hours” in many professions can help us understand the expansion of work hours over - all among salaried workers. N OTES 1 See American Time Use Survey—2010 Results , USDL -11-0919 (U.S. Bureau of Labor Statistics, June 22, 2011). 2 See Aleksandra Todorova, “Company Programs Help Employees Save on Gas,” Smart Money , May 29, 2008, http://www.smartmoney. com/spend/family-money/company-programs-help-employees- save-on-gas-23179 . 3 For review, see Ravi S. Gajendran and David A. Harrison, “e Good, the Bad, and the Unknown about Telecommuting: Meta-Anal - ysis of Psychological Mediators and Individual Consequences,” Journal of Applied Psychology 92, no. 6 (2007), pp. 1,524–1,541. 4 See Nancy Folbre, Who Pays for the Kids? Gender and the Structure of Constraint (New York: Routledge, 1995), and see Joan Williams, Un - bending Gender: Why Family and Work Conict and What to Do about It (New York: Oxford University Press, 2000). 5 See Gartner, Inc., “Dataquest Insight: Teleworking, e Quiet Revolution (2007 Update),” Gartner (May 14, 2007). 6 See Mary Blair-Loy, Competing Devotions: Career and Family among Women Executives (Cambridge, MA : Harvard University Press, 2003). See Arlie Hochschild, e Time Bind (New York: Metropolitan Books, 1995); See Pamela Stone, Opting Out? Why Women Really Quit Careers and Head Home (Berkeley, CA : University of California Press, 2007). 7 See Gajendran and Harrison, “e Good, the Bad, and the Un - known about Telecommuting,” pp. 1,524–1,541. 8 We use the term “onsite” to mean the location where workers labor under the direction of their employer—an oce, store, or other work - site. In the datasets we use for the analysis, we have measures of total hours worked and total hours worked at home. For simplicity, we refer to the “hours worked not at home” as hours worked “onsite.” We use the terms “work at home” and “telecommuting” interchangeably. 9 Dierences exist in questionnaire wording both (1) over time in the CPS and (2) between the CPS and NLSY that limit comparability of work hour estimates across time periods and surveys. With all three CPS surveys (1997, 2001, and 2004), we measure total work hours with a question referring to actual hours of work (pehract1). “Last week, how many hours did you actually work at your job?” To measure tele - commuting, all three May CPS questionnaires have a lead-in question asking, “As part of this job, do you do any of your work at home?” e follow-up question varies slightly depending on which year of the CPS survey is being used. e May 1997 CPS questionnaire asks, “Last week, of the ___ actual hours of work you did, approximately how many of them did you do at home for this job?” e May 2001/2004 CPS ques - tionnaire, on the other hand, asks, “When you work at home, how many hours per week do you work at home for this job?” Furthermore, the questionnaire wording in the NLSY is slightly dierent than the CPS . e NLSY question on hours worked (both at home and not at home) measures usual hours, not actual hours: “How many hours per week do you usually work at this job?” and then, “How many hours per week do you usually work at this job at home?” Studies comparing the two measures of hours worked (actual versus usual) nd that estimates of actual hours worked are generally lower than estimates of usual hours worked (See Richard D. Williams, “Investigating Hours Worked Measurements,” 2004, Labor Market Trends 112, no. 2 (2004), pp. 71– 79. Our results suggest a similar pattern. Finally, “it varies” is a valid response option in the May 2001/2004 CPS question asking workers for the number of hours worked at home. Approximately one-third of the telecommuters in each year selected “it varies” as their response. We imputed the mean telecommuting hours for those who replied “it varies” (6.40 for 2001 and 6.74 for 2004) and created a dummy variable to indicate that the respondent’s value for telecommuting hours was imputed. is indicator was included in the logistic regression models predicting overtime; the substantive results from these models are not sensitive to the inclusion of the indicator variable. 10 Our telecommuting estimates from 2004 are lower than the American Time Use Survey ( ATUS ) estimates for 2010: 17 percent ver - sus 24 percent. e most likely explanation for the dierence is sample composition. We exclude workers who are self-employed and/or who work exclusively at home; the ATUS does not. 11 Outlined by Blair-Loy, Competing Devotions. 12 See Mary Madden and Sydney Jones, Networked Workers (Pew Research Center, September 24, 2008), http://pewinternet.org/Re - ports/2008/Networked-Workers.aspx .