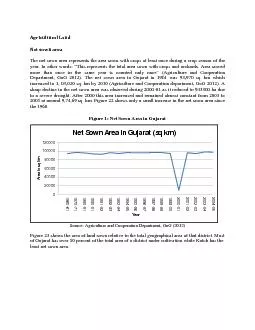
/
Agricultural LandNet sown area The net sown area represents the area s Agricultural LandNet sown area The net sown area represents the area s

Agricultural LandNet sown area The net sown area represents the area s - PDF document

pasty-toler
pasty-toler . @pasty-toler
Follow
536 views
Uploaded On 2015-10-28

Agricultural LandNet sown area The net sown area represents the area s - PPT Presentation

20000400006000080000100000120000196061197071198081199091199192199293199394199495199596199697199798199899199900200001200102200203200304200405Area in sq kmYear Net Sown Area in Gujarat ID: 175019

200004000060000800001000001200001960-611970-711980-811990-911991-921992-931993-941994-951995-961996-971997-981998-991999-002000-012001-022002-032003-042004-05Area kmYear Net

Share:

Link:

Embed:

Download Presentation from below link

Download Pdf The PPT/PDF document "Agricultural LandNet sown area The net s..." is the property of its rightful owner. Permission is granted to download and print the materials on this web site for personal, non-commercial use only, and to display it on your personal computer provided you do not modify the materials and that you retain all copyright notices contained in the materials. By downloading content from our website, you accept the terms of this agreement.


Presentation Transcript

Agricultural LandNet sown area The net sown area represents the area sown with crops at least once during a crop season of the year. In other words: “This represents the total area sown with crops and orchards. Area sowed more than once in the same year is counted only once” (Agriculture and Cooperation Department, GoG 2012). The net sown area in Gujarat in 1961 was 93,970 sq. km which increased to 1, 03,020 sq. km by 2010 (Agriculture and Cooperation department,GoG 2012). A sharp decline in the net sown area was observed during 200001 as it reduced to 943300 ha due to a severe drought. After 2000 this area increased and remained almost constant from 2003 to 2005 at around 9,74,69 sq. km. Figure 22 shows only a small increase in the net sown area since the 1960. Figure : Net Sown Area in GujaratSource: Agriculture and Cooperation Department, GoG (2012)Figure 23 shows the area of land sown relative to the total geographical area of that district. Most of Gujarat has over 50 percent of the total area of a district under cultivation while Kutch has the least net sown area. 200004000060000800001000001200001960-611970-711980-811990-911991-921992-931993-941994-951995-961996-971997-981998-991999-002000-012001-022002-032003-042004-05Area in sq kmYear Net Sown Area in Gujarat (sq km) Figure : Net Sown Area in Percentage of Total Area (2006Current fallow Land that is periodically left idle to recuperate is current fallow land. This represents the cropped area which is kept fallow over the current year. Current fallow lands are left without cultivation for one or less than one agricultural year (Agricultureand Cooperation Department, GoG 2012). Current fallow lands have also shown an increasing trend in Gujarat with 3413 sq. km in 1961 going up to 3790 sq. km in 2010 (Agriculture and Cooperation department, GoG 2012). Other than current fallow Other than the current fallow are lands which have been left uncultivated for at least 1 to 5 agricultural years. This includes the entire land which had been taken up for cultivation but is now temporarily out of cultivation for a period of not less than one year and not more than five years (Agriculture and Cooperation department, GoG). Since intense farming practices are carried out in Gujarat the land is not is allowed to recuperate for a long period of time. Letting lands recuperate for a longer duration helps maintain soil health and quality but this practice is not carried out due to the easy access of chemical fertilisers. Statistics show that other than fallow lands have decreased since 1961 from 4254 sq. km to 160 sq. km (Agriculture and Cooperation Department, GoG 2012). Gross cropped areaGross cropped area represents the total area sown once and/or more than once in a particular year, i.e. the area is counted as many times as there are sowings in a given year. This is also known as total cropped area or total area sown. Gross cropped area in Gujarat has been on the rise since 1960s. The gross cropped area increased from 97,676 sq. km in 196061 to 11, 36, 27 sq. km in 200304. A significant decrease was observed in 20002001 and can be attributed to the severe drought during this period. A slight decrease in area was observed in 200405. The total gross cropped area for the year 200405 was 112569 sq. km. Source: Agriculture and Cooperation Department, GoG (2012)Trajectory of Agricultural Growth in GujaratAgriculture is a major user of land resource in Gujarat. In order to analyse how this aspect has been managed by the state, it is useful to examine agricultural share in state gross domestic product (SGDP). SGDP for Gujarat has been calculated at constant prices. The base year for calculating the SGDP in Gujarat is 200405. A comparison has been made between the SGDP share of agriculture and other sectors for Gujarat state. When sectorwise share in the SGDP was observed it was found that the agricultural sector’s share increased over the years in Gujarat from 24,802.6 cores (2005) to 30,917.5 cores (2010) (see Figure 68). Gujarat’s agriculture growth is flourishing in comparison to India but the other sectors in Gujarat i.e. industry and service sector’s contribution is much higher at around 2,46,980 cores (2010) to the GSDP of Gujarat. 8500090000950001000001050001100001150001960-611970-711980-811990-911991-921992-931993-941994-951995-961996-971997-981998-991999-002000-012001-022002-032003-042004-05Area in sq kmYearGross Cropped Area (sq km) Figure 3 : Gross Cropped Area ( sq. km ) Sectoral GSDP of Gujarat (at constant prices, base year: 200405)Source: Centre for Monitoring Indian Economy (CMIE) 2012Figure : Contribution of all sectors to GSDP in Gujarat, 196061 to 2009Source: Directorate of Economics and Statistics (various reports) 20000400006000080000100000120000140000160000Jan-05Jan-06Jan-07Jan-08Jan-09Jan-10Rupees in CroresYearSectoral GSDP for Gujarat at constant prices NDPfc fromAgriculture (Rs.Crores) NDPfc fromForestry andlogging (Rs. Crores) NDPfc from Fishing(Rs. Crores) NDPfc fromIndustry (Rs.Crores) NDPfc from Service(Rs. Crores) 500001000001500002000002500003000001960-6163-6466-6769-7072-7375-7678-7981-8284-8587-8890-9193-9496-9799-002002-032005-062008-09(Q)Rupees in Crores YearContribution of All Sectors to GSDP in Gujarat Agri. Non-Agri. GSDP GSDP Figure : Contribution of the Agricultural sector to SGDP (196061 to 2009Source: Directorate of Economics and Statistics (various reports)Note:(P) stands for provisional; (Q) stands for quick estimate; (A) stands for advancedestimateFigure 69 shows how the agricultural SGDP and the total SGDP of Gujarat have changed since 1960. Figure 70 shows the trend followed by the SGDP from agriculture (at constant price). There has been a remarkable increase in the service sector and industrial sector contribution to the SGDP that overshadows the contribution of agriculture to the SGDP. Gujarat’s agriculture contributes significantly to the SGDP as compared to other states and has shown very high growth in the last 78 years (seen Figure 70). There have been times in which agricultural contribution to SGDP has been minimal; these have been mainly during the drought years of 88 and 200001. Since 2001 the agricultural sector has contributed tremendously to the SGDP.Agriculture Scenario in GujaratAn Overview Cropping systems of a region are determined by a number of parameters like soil type, temperature, rainfall, etc. Apart from these factors other factors like infrastructural facilities (irrigation, transport, storage facilities etc.), socioeconomic factors and technological developments help to decide the cropping system of a particular region. Gujarat is divided into five regions namely South, Central, North, Saurashtra and Kutch. Seven agro climatic regions have been identified here on the basis of soil characteristics, temperature, and rainfall. These are South Gujarat (heavy rainfall area), South, Middle, North, South Saurashtra, North Saurashtra, NorthWest Arid (Kutch). Technological changes have favoured water intensive crops thus 50001000015000200002500030000350001960-6162-6364-6566-6768-6970-7172-7374-7576-7778-7980-8182-8384-8586-8788-8990-9192-9394-9596-9798-992000-012002-032004--052006-07(P)2008-09(Q)Rupees in CroresYearContribution of the Agricultural Sector to SGDP (Rs. Crores) changing the cropping pattern of Gujarat since 1960s. These changes have favoured crops like cotton, rice, etc. at the cost of areas under pulses, oilseeds and coarse cereals. This shift could be attributed to the agro climatic conditions, technological changes, institutional changes and infrastructural changes associated with agriculture, which have taken place in recent years. Gujarat has witnessed tremendous changes in cropping intensity in recent decades. These changes could possibly be attributed to the following factors power supply, agricultural inputs like fertilisers, water supply (rainfall or irrigation) and the kind of cropping pattern adopted, which decides the duration of cropping activities during a particular crop year. Production of food grains in Gujarat have increased from 1.8 million tonnes in 196061 to 8.2 million tonnes in 08 (76.9 percent increase has been observed from 196061 to 200708) (seen Figure 71), though there has been an only a small increase in net sown area since 1960. Gujarat accounts for about five percent of India but only about four percent of India’s total food production. Figure : Production of Food Grains in Gujarat from 196061 to 2008Sources: Directorate of Economics and Statistics (various reports) Note:Production of food grains reduced in 200809 to 7.2 million tonnes (13.4 percentreduction has been observed from 2007 08 to 200809). Production data for the 198889 and 199091 is not available. Animal husbandryis another important source of livelihood. In Gujarat, milk production having increased tremendously over the years. Figure 72 shows that milk production in 198384 was 30.93 lakh tonnes in Gujarat, which, increased to 88.43 lakh tonnes in 200910. This increased milk production has helped communities to diversify their livelihood options and improve their living standards. 1000200030004000500060007000800090001960-611962-631964-651966-671968-691970-711972-731974-751976-771978-791980-811982-831984-851986-871988-891990-911992-931994-951996-971998-992000-012002-032004-052006-072008-09000 TonnesYearProduction of food grains in Gujarat ('000' tonnes) Figure : Milk production in Gujarat from 198384 to 2009Source: Directorate of Animal Husbandry (2011)Gross Irrigated Area to Gross Sown Area Irrigation in Gujarat has seen an increasing trend in 23 districts this is to satisfy in agricultural demand and enhance productivity. Comparative analysis of figure 73 and figure 74 shows an increase in irrigation during the period of 19902005. There hasbeen an increment of around 15 to 20 percent around Kheda, Surat, Tapi, Junagadh and Narmada. A drastic increase has been observed in the districts of Baruch (22.4 percent), Anand (26.6 percent) and Navsari (29.4 percent). Districts like Patan (0.4 percent), Gandhinagar (0.6 percent) and Valsad (2.4 percent) have seen a minor decline in irrigation during this period as well. 2000400060008000100001983-841984-851985-861986-871987-881988-891989-901990-911991-921992-931993-941994-951995-961996-971997-981998-991999-20002000-012001-022002-032003-042004-052005-062006-072007-082008-092009-10000 TonnesYearMilk Production ('000' tonnes) Figure : Percentage of Gross Irrigated Area to Gross Sown Area (1990 Figure : Percentage of Gross Irrigated Area to Gross Sown Area (2004Net Irrigated Area in Gujarat to Net Sown Area Gujarat’s net irrigated area has also seen an increasing trend in 22 districts to meet agricultural demands. There has been an increase of 15 to 20 percent of net irrigated area in Dahod, Narmada, Junagadh, Surat, Tapi and Kheda. The districts of Bharuch (21.4 percent), Navsari (34.7 percent) and Anand (48.6 percent) have witnessed a drastic increase in the net irrigated area. A decline has been observed, however, in the districts of Patan (2.8 percent), Sabarkantha 2.2 percent), and Gandhinagar (9.9 percent). For districtwise details refer to Figure 75 and Figure 76. Figure Percentage of Net Irrigated Area to Net Sown Area (199091) Figure : Percentage of Net Irrigated Area to Net Sown Area (200405) Cropping Intensity and Cropping Pattern Cropping intensity is one of the indices for assessing the efficiency of the crop in the agricultural sector. Cropping intensity is the ratio of gross area sown to the net area sown. Gross cropped area divided by the net cropped area is multiplied by 100 to give the percentage cropping intensity for all the districts. The level of cropping intensity generally moves in consonance with the behaviour of the monsoon and availability of irrigation water. Cropping intensity increased from 103.9 percent in 1960to 115.4 percent in 200405. Cropping intensity dropped during the drought period of 200001 to 110.6 percent as shown in Figure 77. Figure 78 shows the cropping intensity map of Gujarat for 200607. Cropping intensity has been analysed by taking into consideration fiveyear intervals between 199001 and 2006Figure : Cropping Intensity in Gujarat from 196061 to 2004 Source: Directorate of Economics and Statistics (various reports) 1001051101151201960-611970-711980-811990-911991-921992-931993-941994-951995-961996-971997-981998-991999-002000-012001-022002-032003-042004-05PercentageYear Figure : Cropping Intensity map of Gujarat (2006 Cropping patterns for the major principal crops have been analysed from 1990s to 200809 on a decadal basis. The drivers responsible for contributing to the shift in cropping patterns include increased wateravailability due to increased irrigation.The crops included in the study are sugarcane, rice, jowar, lentil, groundnut, wheat cotton, mung, urad, maize, gram, castor, bajra, mustard, sesamum, tobacco, chillies, potato, banana, cumin, onion, isabgul, mango, and chikoo. Data for the cropped area under these crops were taken for two decades i.e. 1990 and 200809. Figures 79, 80 and 81 show the variation of cropping patterns for the two decades from 199001 to 200809. Figure : Cropping pattern in Gujarat (1990 Figure : Cropping pattern in Gujarat (2000Figure : Cropping pattern in Gujarat (2008 South Gujarat In South Gujarat only a minor fluctuation has been observed in cropping patterns over the past two decades. Lentil cultivation increased, making it the second most dominant crop in the 1990s. Sugarcane, which was very scarcely grown in the previous decades, during this period, became the third most preferred crop of cultivation while rice remained the most dominant crop of the region. Cotton cultivation showed a decline from the 1980s till 2000. By 2000 cotton cultivation had reappeared as a preferred cropfor cultivation and remained so in the following decade. Since 2000 the dominant crops for cultivation have been rice, followed by sugarcane and cotton. There has been a shift towards water intensive crops due to increased irrigation in the last decade (see Figure 83). A fluctuating trend has been observed in the cropping intensity of South Gujarat. It increased tremendously from 100 percent in 200001 to 128 percentin 200405 (see Figure 82). This change could be due to the change in the percentage of net sown area and irrigated area which increased from 37 percent in 200001 to approximately 43 percent in 200405 (see Figure 85). A sudden decline in cropping intensity is observed in 200607 (91 percent) (see Figure 82). In Figure 84, The Dangs has shown tremendous increase in cropping intensity from 101 percent in 01 to 223 percent in 200405. This increase could be attributed to increased percentage of net irrigated area to the percentage of net sown area. Figure : Cropping Intensity in South Gujarat Source: Directorate of Economics and Statistics (2009) 1001201401990-911995-962000-012004-052006-07PercentageYearCropping Intensity in South Gujarat Figure : Net Irrigated area in South Gujarat Source: Directorate of Agriculture (n.d.) 1990-911995-962000-012004-05Axis TitleAxis TitleNet Irrigated Area in South Gujarat Figure : District wise cropping Intensity in South Gujarat Source: Directorate of Economics and Statistics 2009;Directorate of Agriculture (n.d.)Figure : District wise Net irrigated Area to the Percentage of Net Sown Area in South Gujarat Source: Directorate of Economics and Statistics 2009; Directorate of Agriculture (n.d.) 100150200250BHARUCHNARMADANAVSARISURAT &TAPITHE DANGSVALSADPercentage DistrictsDistrict Wise Cropping Intensity in South Gujarat 1990-91 1995-96 2000-01 2004-05 2006-07 BHARUCHNARMADANAVSARISURATTAPITHE DANGSVALSADPercentageDistrictsDistrict Wise Net Irrigate Area to the Percentage of Net Sown Area in south Gujarat 1990-91 1995-96 2000-01 2004-05 Note:Since Tapi was not formed till 200405, its statistics is combined with the statistics of Surat district with respect to the irrigated area. For analysing cropping patterns and cropping intensity, Tapi, Narmada and Navsari have been shown separately but with the same cropping pattern and intensity as in Surat, Bharuch and Valsad for the years before their formation. Central Gujarat In Central Gujarat the most dominant crop have been rice and cotton over two decades. An increase in maize cultivation was observed during the 1990s and 2000s. Since cotton cultivation took a plunge in 1990 maize replaced it as the preferred crop. During this period the favoured crops were rice, followed by bajara and maize. In 2000 the preferred crop for cultivation was rice followed by maize and cotton. In 2008 rice remained the most dominant crop with wheat being positioned as the preferred crop for cultivation followed by cotton. Cropping intensity revealed a fluctuating trend from the 1990s to 2000s, by, first increasing from 117 percent in 199091 to 122 percent in 199596 and then decreasing to 114 percent in 200001. An increase of up to 128 percent, observed in 200405, remained rather constant in 200607 (see Figure 86.) Figure 87 indicates that the net irrigated area in Central Gujarat was 31 percent from observations in 1991; there has been a consistent increase in net irrigated area to 35 percent in 96, which remained consistent till 200001. A further increase has been observed up to 46 percent in 200405. Therefore, this change in cropping intensity could be the result of change in net irrigation area. Observations from Figure 88 show Anand experienced a tremendous increase in cropping intensity from 127 percent in 200001 to 158 percent in 200405. This increase could be attributed to the increased percentage of net irrigated area. The latter has increased from 79 percent in 200001 to 98percent in 200405, shown in figure 89.Figure : Cropping Intensity in Central Gujarat Source: Directorate of Economics and Statistics (2009) 1051101151201251301990-911995-962000-012004-052006-07PercentageYearCropping Intensity in Central Gujarat Figure : Net Irrigated Area in Central Gujarat Source: Directorate of Agriculture (n.d.)Figure : Districtwise cropping intensity in Central Gujarat 1990-911995-962000-012004-05PercentageYearNet Irrigated Area In Central Gujarat Source: Directorate of Economics and Statistics (2009)Figure : Districtwise Net IrrigatedArea to Percentage of Net Sown Area in Central Gujarat Source: Directorate of Agriculture (n.d.) Note:For analysing cropping pattern and cropping intensity, Anand and Dahodhave been shown separately but with the same cropping pattern and intensity as in Kheda and Panchmahals before 2000 as they were part of Kheda and Panchmahals before 2000. 100120140160180 PercentageDistrictsCropping Intensity in Central Gujarat 1990-91 1995-96 2000-01 2004-05 2006-07 100120 PercentageDistrictsNet Irrigated Area to the Percentage of Net Sown Area in Central Gujarat 1990-91 1995-96 2000-01 2004-05 North Gujarat Water efficient crops have always been given preference in North Gujarat although cotton is a dominant crop in this region. During the 1990s a shift was observed in cropping patterns when castor followed by maize was the preferred crop. The dominance of castor as a preferred crop for cultivation continued into the next decade followed by cotton. In 2009 another shift was observed when castor lost out to cotton and bajara which became the favoured crop for cultivation followed by mustard. From Figure 90 it is clear that cropping intensity in North Gujarat shows a fluctuating trend in 1991; cropping intensity was at 126 percent after which, in the next decade, it increased to 130 percent. From 200001 onwards a declining trend was observed when cropping intensity went down to 126 percent and fell further in 200405 to 116 percent. A sharp increase in cropping pattern was observed in 200607 when it rose to nearly 131 percent. Figure 92 shows a districtwise distribution of cropping intensity with showing maximum cropping intensity in 2001 and 200607. The net irrigated area in Gujarat was on the rise since 1991 till 2001 after which a decline was observed; see Figure 91. There has been an overall fall in the net irrigated area in North Gujarat for all districts except Sabarkantha since 2001, in which period a slight increase was observed; refer to Figure 93 for districtwise percentage of net irrigated area. Figure : Cropping Intensity in North Gujarat Source Directorate of Economics and Statistics (2009) 1051101151201251301351990-911995-962000-012004-052006-07PercentageYearCropping Intensity in North Gujarat Figure : Net Irrigated Area in North Gujarat Source: Directorate of Agriculture (n.d.)Figure : District wise Cropping Intensity in North Gujarat Source: Directorate of Economics and Statistics (2009) 1990-911995-962000-012004-05PercentageYearNet Irrigated Area In North Gujarat 100120140160BANAS KANTHAMAHESANAPATANSABAR KANTHAPercentageDistrictsCropping Intensity in North Gujarat 1990-91 1995-96 2000-01 2004-05 2006-07 Figure : Districtwise Net Irrigated Area to Percentage of Net Sown Area in North Gujarat Source: Directorate of Agriculture (n.d.) Note:For analysing the cropping pattern and cropping intensity in Patan, averaged out figures of Mehsana and Banaskantha have been taken together for the years prior to 200001 as Patan was formed out of the latter two districts in 2000 Saurashtra Groundnut remained as the dominant crop for the entire period while wheat and cotton started gaining more importance while the cultivation of bajara and jowar declined in various districts of Saurashtra in the 1990s. Another shift in cropping pattern was observed in the next decade, while groundnut remained the dominant crop cotton cultivation increased to become the second most favoured crop followed by bajara and seasum. Cropping patterns changed again in 2008 although groundnut and cotton remained thedominant crops. This period saw an escalation in wheat production. There has been a tremendous rise in cotton cultivation since the 1990s and if this continues groundnut, the most dominant crop, could lose out due to increased irrigation practices and for being a cash crop. It must be noted that Porbandar evinced 23 percent of the total gross cropped area under cumin while Bhavnagar had 5 percent of its total gross cropped area under onion cultivation during 2008 Cropping intensity has been increasing in Saurashtra since 200001. It was at 104 percent in 01 (drought year), 114 percent in 200405, and 123 percent in 200607; see Figure 94. Similar trends have been observed in the net irrigated area. Figure 95 shows that the net irrigated area wasat 16 percent in 200001 and increased to 26 percent in 200405. This increase in the irrigated area could possibly be a reason for high cropping intensity. Also, better irrigation facilities along with other factors could possibly play an important rolein determining the BANAS KANTHAMAHESANAPATANSABAR KANTHAPercentageDistrictsDistrictwise Net Irrigated Area to Percentage of Net Sown Area in North Gujarat 1990-91 1995-96 2000-01 2004-05 cropping pattern of a region. An increase in cropping intensity has been observed in the Junagadh district since 200001. It was 107 percent in 200001, 130 percent in 200405 and 147 percent in 200607 see Figure 96. This increase could be due to the increase in the net irrigated area, which increased from 35 percent in 200001 to 46 percent in 200405 as shown in Figure Figure : Cropping Intensity in Saurashtra Source: Directorate of Economics and Statistics (2009)Figure : Net Irrigated Area in Saurashtra Source: Directorate of Agriculture (n.d.) 1001051101151201251990-911995-962000-012004-052006-07PercentageYearCropping Intensity in Saurashtra 1990-911995-962000-012004-05PercentageYeareNet Irrigated Area in Saurashtra Figure : District wise Cropping Intensity in Saurashtra Source: Directorate of Economics and Statistics (n.d.)Figure : Districtwise Net Irrigated Area to Percentage of Net Sown Area in Saurashtra Source: Directorate of Agriculture (n.d.) 100120140160 PercentageDistrictsDistrict Wise Cropping Intensity in Saurashtra 1990-91 1995-96 2000-01 2004-05 2006-07 051015253035 PercentageDistrictsDistrictwise Net Irrigated Area to Percentage of Net Sown Areain Saurashtra 1990-91 1995-96 2000-01 2004-05 Note:While analysing cropping patterns and cropping intensity the same statistics as that of Junagadh have been used for the years prior to 1997. This is because Porbandar was formed out of Junagadh on 2nd October, 1997. Kutch Bajarain the Kutch region remained the most dominant crop from 1990 to 2000. Mung became the second most dominant crop in 1990. During this period jowar and cotton too, were the preferred crops of cultivation. In the 2000s the second most favoured crop for cultivation was the groundnut followed by mung. In 2009 there was a complete change in preference with bajara having lost its dominance and cotton gaining favour as the most cultivated crop followed by mung and groundnut. Cropping intensity remained almostconstant during 200001 and 200405 but increased in 2006 07. It was at 106 percent during 200001 and 200405 and went up to 111 percent in 200607. Figure 98 shows the changes in the cropping intensity of 15 years. The augmentation in cropping intensitysince 1995 and the shift in cropping pattern could be supported by the fact that the percentage of net irrigated in Kutch increased in similar proportions. It was 9 percent in 199596 and 23 percent during 200001 and 200405 (see Figure 99). Figure : Cropping Intensity in Kutch Source: Directorate of Economics and Statistics (2009) 1001021041061081101121990-911995-962000-012004-052006-07PercentageYearCropping Intensity in Kutch Figure : Net Irrigated Area in Kutch Source: Directorate of Agriculture (n.d.) Cropping patterns have changed from the 1990s to 200809. During the 1990s, the entire state of Gujarat was classified into 15 crop regions on the basis of similar cropping patterns. In 199091, 18 crop regions were identified whereas in 200001, 19 crop regions were identified. In 200809, an increase in these crop regions was witnessed with the number going up to 23. A major shift in the cropping pattern of Gujarat was observed, especially after 200001. In every region there have been certain shifts that need to be discussed. These shifts have been witnessed over a period of two decades i.e. 1990 to 2009. The worst drought occurred in 200001 covering over 92 percent of the total districts and affecting more than 5 percent of the total geographical area (TGA) (Center for Development Alternatives 2007) but a major shift in the cropping pattern was seen from 1990 to2000 in almost every region. These shifts include:Narmada and Bharuch in South Gujarat shifted from lentil (1990) to cotton (2000Bajra remained dominant in Central Gujarat in the 1990s whereas rice and cotton, two water intensive crops, took over in this region during 200001 and 200809.North Gujarat also witnessed a drastic shift to cotton and wheat in 2008Groundnut, since the 1990s till date has been dominant in Saurashtra except in Surendranagar where cotton has always been cultivated. But a major shift was observed in the second most cultivated crop. Prior to 200001 bajra and jowar were the crops most cultivated after groundnut; but post 2000 cotton emerged as the second most cultivated crop in the region.Post 200001 Kutch also witnessed a major shift, its cropping pattern being dominated by two water intensive crops i.e. groundnut and cotton. In 200809, the net cropped area under cotton was the highest. 1990-911995-962000-012004-05PercentageYearNet Irrigated Area in Kutch Figure : Per Capita Net Area SownSource: Agricultural and Cooperation Department, GoG (2012) Per capita net sown area wason the decline; and now seems stabilizing since 2001.If the net sown area declines, productivity is reduced.. Efforts need to be made to increase per capita net shown area. Figure 100 shows the decline in per capita net sown area. Reponses In Agriculture SectorGovernment ReponsesSoil testing laboratories and soil health cardThere are 20 soil testing laboratories working in the state covering all its districts and providing free of charge testing facilities to farmers of all the districts of Gujarat under the soil health card programme. Total soil samples analysed during 200506 was 291855 against a target of 1, 90,000 soil samples. There is only one laboratory existing for the testing of soil micronutrients, though. Total soil samples analysed for micronutrients amounted to 483 against a target of 7500 oil samples during 200405. On the basis of the soil test analysis report, soil health cardswere prepared by entering computerised data of the soil test, recommendation of fertilisers, reclamation of soil, crop planning etc. Computerised soil health cardswere distributed to 4.92 lakh farmers in 200506. During Krishi Mahotsava, about 2.35 lakh soil health cards were distributed to farmers (Agriculture and cooperation Department, GoG 2012).Krushi MahotsavThe Krushi Mahotsavcampaign started in 2006, covering 18,600 villages by June 2009, with 230 krushiraths (vans) reaching farmers with researchers, scientists, experts, agriculture officers and ministers, interacting and providing information and counselling them on soil health, organic farming, technology, agricultural inputs, irrigation, etc., besides infusing a new spirit of change and mass mobilisation (Agriculture and cooperation Department, GoG 2012). During the 8th Krishi Mahotsav in 2012 the present Chief Minister interacted with over one crore farmers via video conference. Around 15 lakhs farmers were provided with an assistance of worth Rs.720 0.10.20.30.40.50.60.7 Area in sq kmYear Per Capita Net Area Sown (sq km) crore. Farmers were also given an assistance to purchase 11,000 tractors and 34,000 rotavators. 4400 Krishi Rath visited allthe talukas of the state with around one lakh government official, agroscientists and experts to disseminate helpful information and to get farmer acquainted with scientific methods of farming. 3.5 lakhs soil samples were tested in laboratory and 2.75 lakhs health cards were given to farmers. During the 2012 Krishi Rath 40 lakhs animals were vaccinated and 4.5 lakh animals were treated for various diseases (Agriculture and cooperation Department, GoG 2012).Figure : Krushi Mahotsava: Scientific Farming Micro Nutrient TrainingIt has been proposed in the state agriculture plan that micronutrient training be held in all 18309 villages of Gujarat state. A provision for the fund of Rs.5000 per training has been made. Total fund available to hold micro nutrient training in 18309 villages is Rs.1083.29 lakhs, which would be made available over the period of 4 years.RKVY (Rashtriya Krishi VikasYojana) In order to boost development and modernisation in India’s agricultural sector, the Government of India has introduced the Rashtriya Krishi Vikas Yojana. Apart from production, research and farming, marketing and post harvest management received importance in the RKVY scheme. Assistance has been provided for distributing soil health cards, micro nutrient demonstration, training of farmers for promotion of organic farming; assistance has been provided to the state government for strengthening existing soil testing and fertiliser testing laboratories andsetting up new ones. Assistance has also been provided for nursery development and micro irrigation. Under this scheme, construction of percolation tanks, contour bunds, farm ponds, reclamation bunds, check dams and terrace farming have also been suggested. Banaskantha, Amreli, Dahod, Surendranagar, Vadodara, Sabarkantha, Panchamahal, and Jamnagar are some of the districts covered under this scheme (Gujarat State Agriculture Marketing Board 2007).Integrated Wadi and Agriculture Diversification Project (IWADP) The “Wadi” model of tribal development is holistic in its approach towards addressing production, processing, and marketing of the agrihorticultural produce, which has led to improved incomes. Critical inputs for the wadi programme include vermicompost, technical how for soil and water conservation, and micro irrigation. The other development interventions include required measures for soil conservation in the wadis, water resource development by digging of wells, creation of farm ponds, gully plugging, and installing permanent check dams to ensure protective irrigation during the gestation period.Gujarat’s IWADP and ongoing Wadi project for tribal areas seek to cover 2, 65,000 Schedule Tribe (ST) farmers. For the implementation of such a large scale agriculturebased project funds are received mainly from Rashtriya Krishi Vikas Yojana(RKVY), National Rural Employment Guarantee Scheme (NREGS), Gujarat Green Revolution Company Ltd. (GGRC), Tribal Development Department and beneficiary contribution, all of which is collected at the time of the farmers’ registration for the project. IWADPconsists of two groups of sub projects including Project Sunshine and Jeevika. It is an integrated project that includes water resources’ development, provision for microirrigation facilities, the soil testing facility, quality seeds, saplings and fertilisers, assured extension services, training to participating farmers, and farm mechanisation.Integrated Watershed Management Programme (IWMP)Area development programmes of the Ministry of Rural Development (MoRD) like the Drought Prone Area Programme (DPAP), Drought Prone Area Programme (DDP), and Integrated Wasteland Development Programme (IWDP) have been following the watershed development approach since 199596 when the first watershed development guidelines came into force. Since the new common Guidelines (2008) became operational all individual watershed development programmes have been merged to form one comprehensive programme, namely the Integrated Watershed Development Programme.The main aim of the IWMP is to restore ecological balance by harnessing, conserving, and developing degraded natural resources such as soil, vegetative cover, and water. The expected outcomes include prevention of soil runoff, regeneration of natural vegetation, rain water harvesting, and recharging of the groundwater table. All this enables multicropping and the introduction of diverse agrobased activities paving the way for sustainable livelihoods to residents of the watershed area. Gujarat is among the front runners in the country for taking up new projects. The Government of India has sanctioned 151 watershed projects covering 7.08 lakh hectares to the tune of over Rs. 930 crore. Contract Farming Schemes In order to facilitate for industries the procurement of a specific quality of agrocommodity directly from thefarmers, the state government has been keeping up with the reforms of Model Act 2003. It adopted the Contract Farmingscheme in 2005 to that end. Under this scheme farmers benefit from the latest farming technology and improved quality of inputs. They also get price security and an opportunity to diversify in other crops. Farmers get the advantage of the technical research that is sponsored as well as financial support in the form of seeds, fertilisers including harvesting techniques (GSAMB The GR on Corporate Farming expressing the Gujarat Government policy on application of modern technology for converting Governmentowned wasteland to cultivable land allows only big industrial houses and individuals capable (big farmers) of taking a lease for 20 years. These governmentowned wastelands are given to industrial houses for converting them to cultivable land, carry on agriculture production, and produce valueadded products. Incentives and encouragements are provided by the state government, which charges nominal rents only from the sixth year on (Agriculture and CoOperation Department, GOG 2012). Some examples of beneficiaries of this programme are as follows: Agro cell Corporation Ltd., Atreyas Agro Organic Pvt. Ltd., Godrej Agrovat Ltd. and Pepsi India, Arvind Mills, Jojoba Oil Industries Ltd. These are some of the companies that approached the government (GSAMB Institutional ResponsesCoastal protection works The total coastal length of Gujarat is about 1600 km. The state’s western border is bounded by the Arabian Sea. Valsad, Navsari, Surat, and Bharuch districts share boundaries with the latter. Severe erosion has been observed on the coastal boundaries of Valsad, Navsari, Surat, Bharuch, Bhavnagar, Amreli, Junagadh, Porbandar, and Jamnagar districts. Coastal erosion has been found to affect 449 villages. The erosion has been taking place mostly under the action of strong tidal currents accompanied by wave action.In view of the above, and keeping in mind the occurrence of natural damage, antisea erosion works are carried out by the Narmada Water Resources Water supply and Kalpsar Department. The protection work is being carried out by providing gabion walls, thus preventing damages due to coastal erosion.Salinity Ingress Prevention Scheme Work has been categorised in four different systems under this scheme, which has been implemented by the Narmada Water Resources Water Supply and Kalpsar Department.ble : Systems of Salinity Ingress Prevention Management system Regulation of lifting of groundwater and change in crop system Change in crop system Recharge system Check - dam Recharge dam Recharge well Recharge reservoir spreading channel Salinity ingress system Tidal regulators, weirs Fresh water barrierExtraction water barrier Static barrier Coastal land reclamation Rejuvenation of saline land of oceanic areas SourceSalinity Ingress Prevention Scheme (2012)Benefits accrued by the salinity ingress projects, as claimed by the Narmada, Water Resources, Water Supply and Kalpsar Department are as follows:About 36,130 hectare lands have directly or indirectly been benefitted in terms of irrigation upon the storage of 247 million cubic meters of fresh waterLooking to the advancement rate of salinity line of 0.50 to 1.00 km. per annum, another 2.26 lakh hectares of land has been prevented from the onslaught of salinity on the basis of completion of these worksThe 2000 line of T.D.S has been moved towards the coastal region from noncoastal regions in keeping with the situation observed in 1988.Sagarkhedu Sarvangi Vikas Yojna The Government of Gujarat has announced Sagarkhedu Sarvangi VikasYojana in 38 Talukas of 13 districts for the development of the coastal region. Plans are on to execute the following works under the Narmada Water Resources Water supply and the Kalpasar Department BandharasTidal RegulatorsRecharge TanksSpreading ChannelsAnti sea erosion workIrrigation schemeIn total, 15,116 soil and water conservation structures have been constructed under this scheme in Gujarat (Sagarkhedu Sarvangi Vikas Yojna 2012). These soil and water conservation structures have helped reduce the velocity of sheet flow and runoff, which avoids the loss of the thin fertile topsoil through rill erosion and the scouring of drainage gullies. These structures also help in retaining water, thus maintaining soil moisture. This ultimately provides remunerative cropbased agriculture.The parched lands of Gujarat remained unutilised for centuries. The planners of independent India realised the need for exogenous water in order to meet the water needs of Gujarat and thus SardaSarovar Project (SSP) was envisioned. Although the foundation stone was laid in the early 60s it was made operational only during the last decade. It has brought a lot of benefits, particularly in terms of meeting the irrigation, domestic, and industrialwater uses. Schemes like Sujalam Suflam and interlinking of rivers have only helped the state maximise the benefits from the available Naramada waters for recharging the groundwater and relinquishing the soil. The Sardar Patel Sahakari Jal Sanchaya Yojana (SPSJSY) was a government response recognising civil society initiatives around water and the water movement in the Saurashtra region. It focused on the recharging of wells and, later, on the treatment of watershed drainages to conserve rain water through the construction of check dams. Government scaled up check dam construction through this scheme to Gujarat level. Both these initiatives have almost had a miraculous impact on water and agriculture in Gujarat. SSP on the one hand provided a reliable alternative for regular water supply whereas SPSJSY has helped treat the watersheds across the state and, in the process, improved the productivity and quality of land. Sardar Sarovar Project (SSP)Over the Narmada is Gujarat’s largest project that has helped irrigation in a great way. Its main canal’s reach is up to Banaskantha, Sabarkantha, Patan, Gandhinagar, Kutch, Surendranagar, Dahod, Bharuch, Naramada, Vadodara, Ahmadabad, Bhavnagar, Kheda, Mehsana, Panchmahals and Rajkot. It has been irrigating only 80100 thousand hectares of land mostly in Narmada, Bharuch and Vadodara (Shah et al. 2009). Other canal irrigationsystems Mahi, Ukai Kakrapur, Karjan, and Damanganaga provide irrigation in central and South Gujarat. They have 70 percent of Gujarat’s command area (Shah et al. 2009). Interlinking of rivers is also underway for providing water to seven water deficit districts through a 332km long canal under the Sujlam Suflam Yojana. Power reforms have helped farmers use better and efficient irrigation facilities thus helping them growing water intensive crops. Jyotigram Yojana is one such scheme which has changed the agricultural scenario of the entire state of Gujarat. Under this scheme, a threephased power supply for 8 hours at 440 volts is continuously supplied to the farmers to facilitate uninterrupted flow of water for irrigation. And separate feeders are used for providing electricity to the domestic and agriculture sectors (Devalah 2010). Sardar Patel Sahakari Jal Sanchaya YojanaThis was implemented in 2000. Under this scheme approximately 50,00,00 structures that were constructed included 113738 check dams, 55917 boribands, 240199 farm ponds and 62532 large and small check dams (Shah et al 2009). Of the total check dams 54.6 percent were constructed in Saurashtra (Rajkot, Amreli, Bhavnagar, Jamnagar, Junagadh, Porbandar and Surendranagar) and 21.2 percent in the northeastern districts (Kutch, Banaskantha, Sabarkantha, Mehsana and Patan) (Gulati 2009).Participatory Irrigation Management (PIM)Under PIM, some of the important irrigation management responsibilities in governmentowned irrigation projects have been transferred to the farmers' water users associations. PIM focuses on building farmers' organisations at village as well as at projectlevels and enhancing their capacity through various means such as training and community organising. The Development Support Centre (DSC) and Aga Khan Foundation are involved in direct implementation of the PIM programme in 56,800 hectares of 1 major and 2 medium irrigation projects of North Gujarat. The DSC is also in the process of implementing PIMin 5000 hectares of Sardar Sarovar Project (Narmada Project) to serve as a pilot project for implementing PIM overan 18 lakh hectare area.Agro ClinicsIt is proposed to set up 224 agro clinics all over the state (at every taluka). The purpose of the clinic will be to act as poly clinic a place where, a farmer gets solutions to many problems they face at one place. It may have to do with soil characteristics, organic farming, pest management, use of high yield variety seeds and other aspects. Agro clinic may serve as counselling centres, hub of IEC activities, knowledge centre for various agricultural aspects, pest management centre etc. The unit cost of an agro clinic is estimated to be 5 lakhs. Assistance equivalent to one third of the unit cost (1.67 lakhs per unit) will be provided to the agro entrepreneurs interested to set up the clinics. The clinic should work on commercial model and should be in interest of both entrepreneurs and farmers. Total provision of Rs.383.28 lakhs as assistance amount for 224 units has been made in the plan.Civil Society ResponsesWatershed Management: Soil and Water conservation Activities under the Watershed Development Program encompass a range of interventions. They include social afforestation, grass land development, fodder, soil and water conservation, agriculture, drinking water supply, livelihoods, community development, farm pond, farm protection bunds, field boundaries protection bunds, salinity protection bunds around the village, tidal regulation, well recharging, hand pump repairing, pond inlet channel repairing, check dam, animal husbandry, and rain water harvesting.Interventions also include the formation of watershed groups and participatory irrigation management in Gujarat, irrigation and groundwater recharge systems, promotion of microirrigation devices like drips and sprinklers, river basin management including the construction of over 1000 check dams and irrigation tanks and other watershed management measures (Aga Khan Foundation 2007).Several NGOs like the Mahiti Foundation, Aga Khan Foundation, Uthaan, Sarthi, VIKSAT (VikramSarabhai Centre for Development Interaction) have been working for watershed development. Mahiti has, so far, implemented Watershed Development Programs under the Employment Assurance Scheme and the Drought Prone Area Planning Scheme in the Bhavnagar and Dhandhuka blocks covering 15 coastal villages under the watershed development program. Presently, Mahiti is also implementing an Integrated Wasteland Development Program in 07 villages Dholka block of Ahmadabad district. Over the years, Mahiti has treated more than hectares of land under the watershed development program (Mahiti Rural Development Centre n.d.)Livelihood enhancement through participatory natural resource management in Rain fed and irrigated areas of rural Gujarat (LEPNRM) After the augmentation of natural resources through watershed and PIM programmes agriculture based livelihood enhancement programmes were initiated by various NGOs like the Development Support Centre (DSC) in six field units of Gujarat in 2007 in order to further enhance agricultural income.The areas in which LEPNRM is being implemented include Dharoi (Mehsana district), Guhai, Mazum and Meghraj (Sabarkantha district), Vehlal (Ahmadabad district), and Dhari (Amreli district) covering more than 180 villagesand about 45,000 households. The project focuses on five main components of agriculture enhancement: cost reduction, risk mitigation, increased productivity, value addition, and market linkages with the aim of increasing incomes of farmers, especially those of small and marginal farmers (Development Support Centre n.d.). Wadi Programme The Ministry of Tribal Affairs, GOI has launched a Wadiprogramme for implementation by state governments and various voluntary organisations. The BAIF Development Research Foundation is one such organisation involved in its implementation. 12,336 hectares of land has been managed under this programme in Gujarat. Cooperative Farming Cooperative farming refers to pooling of small plots of land and their joint management. Cooperative farming societies are formed to introduce improved methods of farming. Land is collectively cultivated by small groups of farmers. Activities like ploughing, purchasing of inputs, irrigation, and marketing of produce are taken up by these groups. The Gambhira Cooperative Model, in line with the cooperative farming model, may prove to be a model for small and marginal farmersTraining on MicroIrrigation It is proposed that 13820SHGs/farmers’ clubs out of 138200 SHGs (to be created out of 12, 39,008 small and marginal farmers in the state) be imparted training about micro irrigation system for encouraging horticulture in the state.It is emphasized that the training be imparted in groups to encourage promotion of microirrigation in group mode where group of farmers whose land is adjacent to each other, go for microirrigation system collectively.Sustainable agriculture In order to improve the quality of land suitable cropping systems are being promoted with a preference for treebased farming which, in turn, increases agricultural productivity. To promote sustainable agriculture and organic farming, research and demonstration on composting, vermicomposting, biofertilisers like Rhizobia, Asatobacter, and biofungicides have been undertaken. Low cost, userfriendly liquid bio fertilisers and bio pesticides are being produced and distributed to the farmers (BAIF Development Research Foundation 2012). Status of Cropping patternfor Gujarat State (19902007)(Area in Ha.)Dist19901995 2000 - 01 2006 - 07 Net area sownGross cropped areaCropping Intensity Net area sownGross cropped areaCropping Intensity Net area sownGross cropped areaCropping Intensity Net area sownGross cropped areaCropping Intensity KACHCHH 555846 603514 108.575757 631746 662080 104.80161 620118 655041 105.63167 631400 702200 111.2132 BANAS KANTHA 812272 1050651 129.347189 837444 1125851 134.43896 726699 1008291 138.74947 739800 985000 133.1441 PATAN 739608 957888.5 129.512999 773690 1024626 132.4336 374480 423401 113.06372 381900 497900 130.3744 MAHESANA 666944 865126 129.714939 709936 923400 130.06806 346877 457000 131.74699 351600 450900 128.2423 SABAR KANTHA 435840 503700 115.569934 432377 536654 124.11715 438461 528595 120.5569 437600 573500 131.0558 GANDHINAGAR 45988 61699 134.16326 47685 70353 147.53696 159029 203937 128.23887 164800 202800 123.0583 AHMEDABAD 502130 535518 106.649274 544648 589878 108.30445 498659 533216 106.92999 538900 640000 118.7604 SURENDRANAGAR 589422 625385 106.101401 676855 705638 104.25246 687702 720700 104.7983 706200 762400 107.9581 RAJKOT 719846 810163 112.546711 723374 776019 107.2777 715292 726424 101.55629 765700 904300 118.1011 JAMNAGAR 586792 681107 116.072987 605824 643925 106.28912 580199 593980 102.37522 620200 708000 114.1567 PORBANDAR 573154 653831 114.075973 590042 667834 113.18415 118153 125053 105.83989 129100 159300 123.3927 JUNAGADH 573154 653831 114.075973 590042 667834 113.18415 510113 543500 106.54502 536000 787000 146.8284 AMRELI 499805 534557 106.953112 492154 530497 107.79085 536059 544837 101.63751 550400 595500 108.194 BHAVNAGAR 622775 690581 110.88772 630365 665802 105.62166 537822 544197 101.18534 554100 654100 118.0473 ANAND 517261 608559 117.650277 514337 654290 127.21037 152634 194524 127.44474 186600 296500 158.896 KHEDA 517261 608559 117.650277 514337 654290 127.21037 300348 351546 117.04623 303000 404800 133.5974 PANCH MAHALS 473801 564013 119.040061 475354 561764 118.17803 256630 270079 105.24062 279600 303100 108.4049 DOHAD 473801 564013 119.040061 475354 561764 118.17803 185693 193176 104.02977 214500 309000 144.0559 VADODARA 538830 560501 104.021862 538735 569047 105.62651 515110 554284 107.60498 505400 555900 109.9921 NARMADA 429665 432878 100.747792 417891 421562 100.87846 110131 111357 101.11322 103300 113300 109.6805 BHARUCH 429665 432878 100.747792 417891 421562 100.87846 579613 324934 56.060509 315500 338300 107.2266 SURAT 419617 454007 108.195569 433911 489791 112.87822 431981 489940 113.41703 446200 502100 112.528 THE DANGS 53998 54188 100.351865 55396 55456 100.10831 56298 56959 101.17411 * * * NAVSARI 346388 335034 96.7221728 308782 345415 111.86371 146926 173774 118.27314 136300 151100 110.8584 VALSAD 346388 335034 96.7221728 308782 345415 111.86371 161552 178248 110.33475 146800 152900 104.1553 TAPI 419617 454007 108.195569 433911 489791 112.87822 431981 489940 113.41703 446200 502100 112.528 Source: Commissionarate of Agriculture, GoG