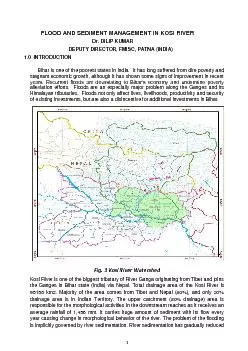
/
225 Fig. 1 - Embankment dam stepped spillways (A) Stepped spillway of 225 Fig. 1 - Embankment dam stepped spillways (A) Stepped spillway of

225 Fig. 1 - Embankment dam stepped spillways (A) Stepped spillway of - PDF document

phoebe-click
phoebe-click . @phoebe-click
Follow
421 views
Uploaded On 2015-11-02

225 Fig. 1 - Embankment dam stepped spillways (A) Stepped spillway of - PPT Presentation

B Melton dam secondary spillway Australia For the last three geometries configurations 8 9 and 10 the step faces were covered with rough plastic squarepatterned screens 8 mm high In confi ID: 180052

(B) Melton dam secondary spillway

Share:

Link:

Embed:

Download Presentation from below link

Download Pdf The PPT/PDF document "225 Fig. 1 - Embankment dam stepped spil..." is the property of its rightful owner. Permission is granted to download and print the materials on this web site for personal, non-commercial use only, and to display it on your personal computer provided you do not modify the materials and that you retain all copyright notices contained in the materials. By downloading content from our website, you accept the terms of this agreement.


Presentation Transcript

225 Fig. 1 - Embankment dam stepped spillways (A) Stepped spillway of the Opuha embankment dam (Courtesy of Tonkin and Taylor, NZ) (B) Melton dam secondary spillway (Australia) For the last three geometries (configurations 8, 9 and 10), the step faces were covered with rough plastic square-patterned screens (8 mm high). In configuration 8, the rough screens covered both the vertical and horizontal step faces. In configuration 9, only the vertical step faces were covered, while only the horizontal ones were covered in configuration 10. The hydraulic roughness of the screens was tested independently in a 20 m long, 0.25 m wide tilting flume with glass sidewalls (Gonzalez et al. 2005). The resulting equivalent Darcy friction factor of the screens ranged from f = 0.05 to 0.08, corresponding to a Gauckler-Manning coefficient of about 0.016 to 0.02 s/m. The results were basically independent of Reynolds number and the data were best correlated by: [1] with a normalised correlation coefficient of 0.783, where k is the screen height (k = 8 mm) and D is the hydraulic diameter. Further details on the experiments are reported Instrumentation and data processing Clear-water flow depths were measured with a point gauge. The flow rate was deduced from the measured upstream head above crest, after a deThe air-water flow properties were measured with a double-tip conductivity probe ( = 0.025 mm). The double-tip conductivity probe was designed with both sensors aligned in the flow direction. The leading tip had a small frontal area (0.05 mm) and the trailing tip was offset to avoid wake disturbance from the first tip. An air bubble detector excited the probe. Its output signal was scanned at 20 kHz for 20 s per probe sensor. The translation of the probes normal to the flow direction was controlled by a fine adjustment traveling mechanism connected to a Mitutoyo™ digimatic scale unit. The error on the vertical position of the probe was less than 0.025 mm. The accuracy on the longitudinal probe position was estimated as 0.5 cm. The accuracy on the transverse position of the probe was less than 1 mm. For each configuration, experiments were repeated systematically for several flow rates (Table 1). Measurements were conducted with the probe located at each step edge downstream of the inception point of free-surface aeration and at several longitudinal positions between adjacent step edges (i.e. above the recirculation cavity). For the configurations 2 to 7 with vanes, the measurements were also performed with the probe located at several transverse positions (z/b = 0 [above vanes], 0.25 and 0.5) where b is the spacing between vanes and z is the transverse direction (Fig. 2). A total of more than 330 vertical profiles were recorded with a minimum of 25 measurements per profile. The basic probe outputs were the void fraction, bubble count rate, velocity, turbulence intensity and air/water chord size distributions. The void fraction C is the proportion of time that the probe tip is in the air. The bubble count rate F is the number of bubbles impacting the probe tip per second. With a dual-tip probe design, the velocity measurement is based upon the successive detection of air-water interfaces by the two tips. Herein the velocity was calculated using a cross-correlation technique (Crowe et al. 1998). The time-averaged air-water velocity equals: x [2] x is the distance between tips and T is the time for which the cross-correlation function is maximum. The turbulence level Tu was derived from the broadening of the cross-correlation function compared to the autocorrelation function (Chanson and Toombes 2002) : ∆−∆ [3] T is a time scale satisfying : R (T+T) = 0.5*R(T), Ris the normalised cross-correlation function, and t is the characteristic time for which the normalised autocorrelation function Requals 0.5. Physically, a narrow cross-correlation function corresponds to small fluctuations in velocity, hence a small turbulence level. Conversely, a broad cross-correlation function implies large turbulence. The turbulence Tu is not a point measurement but a spatial average between probe sensors. In low volume fractions, it is equal to the turbulence intensity u'/V. Tu might not be equal to the "true" turbulence intensity, but it is an expression of some turbulence level or average velocity fluctuations (Chanson and Toombes 2002). Fig. 3 - Prediction of flow regime on stepped chutes 0 0.1 0.2 0.3 0.4 0.5 0.6 0.7 0.8 0.9 1 1.1 1.2 1.3 1.41.5 0.1 0.2 0.3 0.4 0.5 0.6 0.7 0.8 0.9 1 1.1 1.2 1.3 1.4 1.5 1.6 1.7 1.8 1.92 NA TRA SK2 NA-TRA (Yasuda et al., 2001) TRA-SK (Yasuda et al., 2001) TRA-SK (Chanson, 2001) SK1-SK2 (Ohtsu et al.,2004) Inception point of free-surface aeration Modern stepped spillways are designed for the skimming flow regime (Chanson 2001, Ohtsu et al. 2004, Gonzalez 2005). Skimming flows cascading down a stepped chute with smooth step faces are highly turbulent self-aerated flows. They look similar to self-aerated flows down smooth chutes. At the upstream end, the flow is smooth and transparent. When the outer edge of the developing bottom boundary layer reaches the free surface, turbulence induces strong aeration. Downstream the turbulence next to the free-surface becomes large enough to initiate naThe location of the inception point L is primarily a function of the discharge and the step roughness. A statistical analysis of model and prototype data yielded : [4] seudo-bottom formed by the step edges, and F [5] with q the water discharge per unit width and g the gravity acceleration. Equation [4] was first proposed by Chanson (1995), and it is valid for skimming flows on steep spillways and embankment chutes (Chanson and Toombes 2002b, Gonzalez and Chanson 2004). Note that Equation (4) was developed for un-controlled spillway chutes. Chanson (20006) illustrated the effects of the inflow conditions on the location of the observed in d-type roughness (Djenidi et al. 1999) and in stepped chute flows. The recirculation vortices appeared to place strong pressures and cause shear forces on the triangular ribs. For the rough step configurations 8 to 10, the observations suggested some different flow patterns in the recirculation zones beneath the main stream. For chutes with rough steps the location of the inception point shifted downstream. Additionally, more aerated cavities were consistently observed upstream of the point of inception for configuration 8 than for the other configurations (Gonzalez et al. 2005). Downstream of the inception point, recirculating eddies with clear water cores in the step corners were seen in Configurations 8 and 10, while the whole cavity regions were fully-aerated in the chutes igurations 1 to 7. This (A) Configuration 8 (B) Configuration 9 Air-water flow properties A detailed comparison of the air-water flow properties for all tested configurations was conducted. Figure 6 present some results. In Figure 6, the data were obtained for the same flow conditions (d 1.39) at step edges and at identical dimensionless distances from the inception point (x-Lis the length to the point of inception and L is the cavity length. The data corresponding to vane configurations (2 to 7) were recorded at a transverse distance of z/b = 0.25. Figure 6 presents dimensionless results in terms of air concentration C, velocity V/V, turbulence Tu and bubble count rate F.dconfigurations where y is the distance normal to the pseudo-bottom formed by the step edges, Y is is the air-water flow velocity at y = YThe air concentration data measured at step edges were similar for all configurations suggesting negligible of the vanes and step roughness on the rate of air entrainment. In Figure 6B, the void fraction distributions are compared successfully with an analytical solution of the air bubble diffusion equation : Fig. 6 - Air-water flow properties on embankment dam stepped chute (d(A) Air concentration C (B) Air-water velocity V/Vy/Y 0.1 0.2 0.3 0.4 0.5 0.6 0.7 0.91 0.2 0.4 0.6 0.8 1.2 1.4 1.6 1.8 2.2 Config. 1 (no vane) Theory (no vane) Config. 2 (z/b = 0.25) Config. 3 (z/b = 0.25) Config. 4 (z/b = 0.25) Config. 5 (z/b = 0.25) Config. 6 (z/b = 0.25) Config. 7 (z/b = 0.25) Config. 8 Config. 9 Config. 10V/Vy/Y 0.4 0.8 1.2 0.3 0.6 0.9 1.2 1.5 1.8 2.1 2.4 Config. 1 (no vanes) Theory (no vanes) Config. 2 (z/b = 0.25) Config. 3 (z/b = 0.25) Config. 4 (z/b = 0.25) Config. 5 (z/b = 0.25) Config. 6 (z/b = 0.25) Config. 7 (z/b = 0.25) Config.8 Config.9 Config.10(C) Turbulence level Tu (D) Bubble count rate F.dy/Y 0.2 0.4 0.6 0.8 1.2 1.4 1.6 1.8 0 0.25 0.5 0.75 1.25 1.5 1.75 2.252.5 Config. 1 (no vanes) Config. 2 (z/b = 0.25) Config. 3 (z/b = 0.25) Config. 4 (z/b = 0.25) Config. 5 (z/b = 0.25) Config. 6 (z/b = 0.25) Config. 7 (z/b = 0.25) Config. 8 Config. 9 Config. 10F.dy/Y 5 15 20 2530 0.5 1.5 2.5 Config. 1 (no vanes) Config. 2 (z/b=0.25) Config. 3 (z/b=0.25) Config. 4 (z/b=0.25) Config. 5 (z/b=0.25) Config. 6 (z/b=0.25) Config. 7 (z/b=0.25) Config. 8 Config. 9 Config. 10 235 Symbol Description SymbolDescription Configuration 1 (No vanes) Configuration 7 (vanes) Configuration 2 (vanes) Configuration. 3 (vanes) Configuration 9 (rough steps) Configuration. 4 (vanes) Configuration 5 (vanes) Theory (no vanes) Energy dissipation In smooth channels, the kinetic energy dissipation occurs predominantly through friction losses. On stepped cascades, some additional dissipation mechanisms exist including cavity recirculation vortices beneath the mainstream, momentum exchange between main flow stream and mixing layer formed downstream of each step edge, and skin friction at the downstream half of the steps. Altogether these mechanisms cause some very significant form drag.Despite their limitations, the Darcy-Weisbach friction factor was used to estimate the form losses in the stepped channel because it is still widely used fonderson 1966, Chanson 19999). For an uniform equilibrium flow in a wide channel, the boundary friction counteracts the gravity force component in the flow direction and the flow depth and velocity may be determined from the momentum [10] is the average shear stress between the skimming flow and the recirculating fluid underneath, P is the wetted perimeter, A is the mean bed slope. In gradually-varied flows, the flow resistance may be calculated from the average friction slope S (Chanson et al. 2002). Experimental results are presented in terms of the Darcy friction factor f in Figure 7 for all [11] For the configurations without ribs (1, 8, 9 and 10), the friction factors f were calculated based upon measurements conducted at step edges on the channel centreline. For the configurations with longitudinal was estimated as a transverse-averaged value based upon measurements at three transverse positions above and between the vanes. Figure 7 compares the flow resistance data. The experimental values obtained in two stepped channels ( = 11.3 & 19) with different step heights (h = 0.025, 0.0393, 0.05 & 0.0785 m) by Yasuda and Ohtsu (1999) are also presented for comparison. For smooth steps, the equivalent Darcy-Weisbach friction factor was about f = 0.16 that is consistent with earlier analyses yielding f ~ 0.2 (Chanson et al. 2002, Chanson 2006). The largest friction factors were observed for the configurations with vanes in zigzag (Config. 3 and 5) and the lowest flow resistance was 237 Despite the increasing popularity of moderate slope stepped chutes, most studies and design criterions are limited to steep chutes ( 30 to 50). Only two design criterions discussed the hydraulic performance of stepped cascades with flat to moderate slopes (11 30; Chanson 2001, Ohtsu et al. 2004). There are still a number of key issues not well understood, and design criteria need to be improved, specifically in terms of flow resistance and energy dissipation. The present design method can be used for moderate slope ) with skimming flows at design conditions (1.0 The skimming flow regime is recommended to pass large water discharges while nappe flow is best to achieve maximum energy dissipation rate on short stepped cascades. The transition flows should be avoided as they might produce dangerous dynamic loads to the structure. Note that it is important that the designers account not only for the design flow rate but also some smaller flow conditions. When designing a stepped spillway, the dam height, the downstream slope of the dam and the design discharge are generally given. The variable parameters may include the type of flow and the step height. However, the designer is often limited to select a step height (h) within the values determined by the dam to 0.9 m with RCC or gabions). 232wcQd g [12] Secondly, the step height should be selected to ensure that the chute will operate with skimming flow The location of the point of inception should be located toupstream end of the chute to achieve fully-developed flow conditions before the toe of the chute. Its coordinates might be calculated as: 0.7130.07969.719sinsincos [13] 0.4034sincos [14] are the length to and depth at the inception point (Chanson 1995). Note that fully developed condition must preferably be achieved before the toe of the stepped chute : 239 Several researchers have attempted to use the backwater equation to calculate water depth and Darcy friction factors making gross assumptions violating basic principles as it is only valid for smooth chute flows (Chanson 2001). This method is tedious and may not be suitable for all cases. Alternatively the flow properties in the gradually varied flow region may be calculated with a correlation curve linking some well-documented experimental results with the theoretical calculations in the developing and equilibrium flow regions (Gonzalez 2005) : maxmaxmax0.001070.06341.202§·§·=⋅−⋅+¨¸¨¸©¹©¹UHHVdd [21] max is the upstream total head, d is the critical depth, Vmax is the ideal flow velocity and U is the downstream velocity (Fig. 8). In Equation [21], U is the unknown variable , Hmax and d are known, Vmax is estimated from Equations [22] or [23]. Once the dimensionless downstream velocity Umax is known, the flow properties can be estimated assuming fully developed flow conditions. The friction factor in skimming flow is typically f = 0.2. Finally, the ideal fluid flow velocity can be estimated from the Bernoulli equation: [22] . For a large structure, the ideal fluid flow velocity is simply: [23] Once, the velocity and depth of the flow are obtained, the average air concentration Cmean, and the height can be computed (hThis alternate method may be used for preliminary design calculations. However it is important to note that it was obtained assuming f = 0.2 as in the uniform equilibrium region and it was only validated for skimming flow in stepped chutes with moderate slopes (15Designers should be aware that the embankment overflow stepped spillway design is a critical process, as any failure can lead to a catastrophe. A number of key parameters should be assessed properly, including stepped face erosion, seepage through the embankment, drainage beneath the steps, interactions between the abutments and the stepped face ... (Chanson and Gonzalez 2004). In turn, some physical modelling with scaling ratios no greater than 3:1 is strongly advised. 241 where h is the step height and x is the curvi-linear coordinate along the flow direction from the crest. Equation [27] was checked with model and prototype data (e.g. Chanson 1995, Meireles et al. 2006). At a distance x from the crest, Equation [27] provides an estimate of the boundary layer thickness flow depth d is given by Equation [26]. The depth-averaged velocity is then : U Flows cascading down a stepped spillway with a moderate slope are characterised by some strong aeration and high turbulence of the flow. An experimental study was conducted herein based on Froude similitude in large-size experimental facilities to gain a better understanding of the flow properties in stepped chutes with slopes typical of embankment dams. A total of 10 configurations were tested including smooth steps, steps equipped with devices to enhance energy dissipation and rough steps. The results included air water flow properties such as air concentration, flow velocity, turbulence, and bubble count rate. Based on measured air-water velocities, the flow resistance was estimated accurately. The equivalent Darcy-Weisbach friction factors for moderate slope stepped chutes were larger than those for smooth chutes which averaged a value of f ~ 0.2. In addition some scale effects were observed in terms of bubble count rate, turbulence intensity The present results yielded a new design criterion. Although the study is based on limited experimental data, the criterion assessed some key issues not foreseen in prior studies : e.g., gradually varied flow, type of flow regime, flow resistance. While the findings were obtained for two moderate slopes ( = 16 and 22º), it is believed that the outcomes are valid for a wider range of chute geometry and flow conditions typical of embankment chutes. The writers acknowledge the helpful comments of Dr John Macintosh (Water Solutions), the technical assistance of Graham Illidge and Clive Booth (The University of Queensland). The first writer thanks the ience and Technology of Mexico (CONACYT). 243 Chanson, H., and Toombes, L. (2002b). "Experimental Investigations of Air Entrainment in Transition and Skimming Flows down a Stepped Chute." Chanson, H., and Tombes, L. (2004). "Hydraulics of Stepped Chutes: the Transition Flow." Jl of Hyd. Res.Chanson, H., Yasuda, Y., and Ohtsu, I. (2002). "Flow Resistance in Skimming Flows and its Modelling." Crowe, C., Sommerfield, M., and Tsuji, Y. (1998). "Multiphase Flows with Droplets and Particles Djenidi, L., Elavasaran, R., and Antonia, R.A. (1999). The Turbulent Boundary Layer over Transverse Gonzalez, C.A. (2005)."An Experimental Study of Free-Surface Aeration on Embankment Stepped Chutes." , Dept. of Civil Engineering, University of Queensland, Brisbane, Australia. Gonzalez, C.A., and Chanson, H. (2004). "Interactions between Cavity Flow and Main Stream Skimming Flows: an Experimental Study." Gonzalez, C.A., and Chanson, H. (2005). "Experimental Study of Turbulence Manipulation in Stepped Spillways. Implications on Flow Resistance in Skimming Flows." Proc. 31st Biennial IAHR CongressSeoul, Korea, B.H. JUN, S.I. LEE, I.W. SEO and G.W. CHOI Editors, Theme D.7, Paper 0057, pp. 2616-Gonzalez, C.A., Takahashi, M., and Chanson, H. (2005). "Effects of Step Roughness in Skimming Flows: an Experimental Study." Research Report No. CE160, Dept. of Civil Engineering, The University of Queensland, Brisbane, Australia, July, 149 pages. MacMillan CompanyManso, P.A., and Schleiss, A.J. (2002). "Stability of Concrete Macro-Roughness Linings for Overflow Protection of Earth Embankment Dams."