/
Best Practices in Residential Energy Efficiency Best Practices in Residential Energy Efficiency

Best Practices in Residential Energy Efficiency - PowerPoint Presentation

phoebe-click
phoebe-click . @phoebe-click
Follow
379 views
Uploaded On 2018-02-28

Best Practices in Residential Energy Efficiency - PPT Presentation

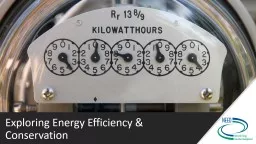
NJ Clean Energy Learning Center Conference September 12 2017 Jackie Berger APPRISE APPRISE 2 Achieving High Savings 3 INTRODUCTION 4 Energy Efficiency Program Goals 5 Energy Efficiency ID: 639798

energy savings performance usage savings energy usage performance measures pre gas program high therms net major save obs measurement census analysis impact

Share:

Link:

Embed:

Download Presentation from below link

Download Presentation The PPT/PDF document "Best Practices in Residential Energy Eff..." is the property of its rightful owner. Permission is granted to download and print the materials on this web site for personal, non-commercial use only, and to display it on your personal computer provided you do not modify the materials and that you retain all copyright notices contained in the materials. By downloading content from our website, you accept the terms of this agreement.


Presentation Transcript

Slide1

Best Practices in Residential Energy Efficiency

NJ Clean Energy Learning Center Conference

September 12, 2017

Jackie Berger

APPRISESlide2

APPRISE

2Slide3

Achieving High Savings

3Slide4

INTRODUCTION

4Slide5

Energy Efficiency

Program Goals

5Slide6

Energy Efficiency

Program Effectiveness

6Slide7

Session Objectives

7Slide8

Information Sources

8Slide9

CONCEPTS

9Slide10

Natural Gas Usage

10

10

Northeast

Census

Region

900

Therms

Midwest

Census Region

950

Therms

South

Census

Region

600

Therms

Mountain North

Census Division

950

Therms

Mountain South

Census Division

450

Therms

Pacific

Census

Division

450

Therms

Definition of high usage varies by geography

Average gas usage per low-income householdSlide11

Energy Program

Savings Estimates

11Slide12

12

Energy Savings

12

Wx

12 Months Pre-

Wx

Energy Usage

Weather Normalize

12 Months Post-

Wx

Energy Usage

Weather Normalize

Comp.

Group

Wx

13-24

Mnth

Pre-

Wx

Energy Usage

Weather Normalize

1-12

Mnth

Pre-

Wx

Energy Usage

Weather Normalize

A

B

A-B

Gross Energy Savings

C

D

C-D

Comp. Group Savings

A-B

Net Savings

C-D

Gross Energy Savings

Comparison Group SavingsSlide13

Major Measures

13

13

Measures for

single family homes

In order of average impacts in

comprehensive

programSlide14

CONSISTENT FINDINGS FROM PROGRAM EVALUATIONS

14Slide15

Increase Savings by…

15Slide16

Intersection of…

16

Policies

Target homes with highest potential

Prioritize measures with greatest impact

Furnish providers with right incentives

Practices

Ensure staff have needed skills and tools

Use best practices for measure selection

Complete high quality installation

Identify problems, give feedback, resolve issues

SUCCESSSlide17

FACTORS ASSOCIATED WITH HIGH SAVINGS:

Targeting High Usage

17Slide18

Treating High Usage

Across Program Analysis

18

Seven low-income gas efficiency program evaluations over past

five years

.

18

Seven low-income electric efficiency program evaluations over past

ten years

.Slide19

Usage Impact Analysis

19

Pre-Treatment Usage

PY 2008

PY 2010

Obs

Therms

% Save

Obs

Therms

% Save

Pre Use

Net

Save

Pre Use

Net

Save

<750

therm

/yr

.

858

571

67

11.8

%

2,181

557

64

11.5

%

750-1000

963

875

133

15.2

%

1,723

873

126

14.4

%

1000-1250

726

1,120

206

18.4

%

1,227

1,111

199

17.9

%

1250-1500

472

1,367

271

19.8

%

683

1,362

237

17.4

%

>=1500

therm

/yr

.

479

1,879

414

22.1

%

778

1,921

345

17.9

%

National Weatherization Program

Single Family Homes – Gas SavingsSlide20

Usage Impact Analysis

20

South Jersey Gas

Home Performance with Energy StarSlide21

Usage Impact Analysis

21

New Jersey Natural Gas

Home Performance with Energy StarSlide22

FACTORS ASSOCIATED WITH HIGH SAVINGS:

Install Major Measures

22Slide23

Usage Impact Analysis

23

National Weatherization Program

Single Family Homes – Gas Savings

Major Measures

PY 2008

PY 2010

Obs

Therms

% Save

Obs

Therms

% Save

Pre Use

Net

Save

Pre Use

Net

Save

None

342

866

59

6.8%

733

823

37

4.5

%

One

983

989

118

12.0%

1,811

928

103

11.1

%

Two

973

1,035

181

17.5%

1,916

1,005

168

16.7

%

Three

619

1,146

286

25.0%

1,031

1,070

256

24.0

%

Four

192

1,220

414

33.9%

304

1,124

369

32.8

%Slide24

Usage Impact Analysis

24

NJ Comfort Partners

ELECTRIC

HEATING SAVINGS

Number of Major Measures

Air Sealing, Attic Insulation, Other Insulation, HVAC

Replace,

Duct Sealing,

Refrigerators

Obs.

%

Net Savings

kWh

%

None

102

20%

-29

-0.3%

1 Measure

121

24%

564

*

4.5%

2 Measures

137

27%

1,223

**

9.6%

3 Measures

97

19%

1,982

**

13.2%

4-5 Measures

42

8%

2,934

**

19.0%

GAS

HEATING SAVINGS

Number of Major Measures

Air Seal,

Attic Insul, Floor Insul, Sidewall Insul, Wall/Perimeter Insul

, HVAC Replace, Duct Seal

Obs.

%

Net Savings

ccf

%

None

1,36528%

111.1%

1 Measure1,066

22%35**3.9%

2 Measures 1,284

27%34**3.5%

3 Measures792

16%97**8.8%

4 Measures

2605%

150**12.4%5-6 Measures57

1%218**15.9%Slide25

FACTORS ASSOCIATED WITH HIGH SAVINGS:

Contractor Performance

25Slide26

Contractor Performance

26

National Weatherization Program

Single Family Homes – Gas Savings

Agency ID

Gas Use Pre-WAP

Net Savings

% of Pre

# of Measures

A

1,077

187 (± 21)

17.3% (±1.9)

2.2

B

992

122 (± 32)

12.3 % (±3.2)

0.9

C

1,028

119 (± 40)

11.6% (±3.9)

1.2

D

948

118 (± 19)

12.4% (±2.0)

1.3

E

1,012

113 (± 64)

11.1% (±6.3)

0.7

F

937

109 (± 44)

11.6% (±4.7)

1.2

G

945

107 (± 50)

11.3% (±5.3)

0.9

H

875

94 (± 26)

10.7% (±3.0)

0.7

I

929

94 (± 41)

10.1% (±4.4)

1.1

J

889

58 (± 27)

6.5% (±3.0)

0.5

Total

983

130 (±11)

13.2% (±0.7)

1.4Slide27

Contractor Performance

27

South Jersey Gas

Home Performance with Energy StarSlide28

Contractor Performance

28

South Jersey Gas

Home Performance with Energy Star

Contractor


Treatment

Matched Comparison Group

Net Savings

Average Project Cost

Obs

Pre

Post

Savings

Obs

Pre

Post

Savings

ccf

%

ccf

%

ccf

%

A

281

890

678

211

***

23.7%

281

883

897

-14

**

-1.6%

225

***

25.3%

$14,756

B

98

834

637

198

***

23.7%

98

806

812

-6

-0.7%

204

***

24.4%

$17,697

C

50

746

615131

***17.6%

50742

745-3-0.4%

135***

18.0%

$14,839D47901

696205***22.7%47882

898

-16-1.9%

221***

24.5%

$15,743

E34

872694

178***

20.4%

34

875

920

-45

*

-5.1%

223

***

25.5%

$15,698

F

20

871

732

139

***

16.0%

20

864

869

-5

-0.5%

144

***

16.5%

$17,190

Other Contractors

116

887

702

184

***

20.8%

116

879

890

-11

-1.2%

195

***

22.0%

$15,595

All

646

859

675

194

***

22.3%

646

859

871

-13

***

-1.5%

206

***

23.8%

$15,556Slide29

Improvement Opportunities

29Slide30

PERFORMANCE MEASUREMENT

30Slide31

Performance Measurement

31Slide32

Performance Measurement

32

Baseline

Follow-up 1

Follow-up 2

Pre-Usage>1,200

ccf

25%

35%

40%

3 or 4 Major Measures

15%

25%

35%

Wall Insulation

10%

15%

25%

Attic

Insulation

50%

55%

60%

Major Air Sealing

55%

55%

60%

Self-Assessment ExampleSlide33

Performance Measurement

33

Review rates of:

Comprehensive installation

High quality installations

Missed opportunities

Poor work quality

Early indication of energy saving expectations.Slide34

Performance Measurement

34

Baseline

Follow-up 1

Follow-up 2

Audit Observation

Identified Occupant Opportunities

50%

60%

70%

Comprehensive

Audit Diagnostics

60%

75%

95%

Post Complete Inspection

All Major Sealing

Opportunities Addressed

55%

75%

90%

No Gaps

or

Voids in Attic Insulation

75%

90%

95%

No Major Missed Opportunities

70%

80%

95%Self-Assessment ExampleSlide35

Performance Measurement

35Slide36

Performance Measurement

36Slide37

ACHIEVING HIGH SAVINGS

SUMMARY

37Slide38

Achieving High Savings

Lessons Learned

38Slide39

Jackie Berger

APPRISE

32 Nassau Street, Suite 200Princeton, NJ 08540609-252-8009jackie-berger@appriseinc.org

www.appriseinc.org

39