/
Design of Experiments for Ruggedness Testing:Case Study on Paraffin Th Design of Experiments for Ruggedness Testing:Case Study on Paraffin Th

Design of Experiments for Ruggedness Testing:Case Study on Paraffin Th - PDF document

phoebe-click
phoebe-click . @phoebe-click
Follow
421 views
Uploaded On 2016-07-26

Design of Experiments for Ruggedness Testing:Case Study on Paraffin Th - PPT Presentation

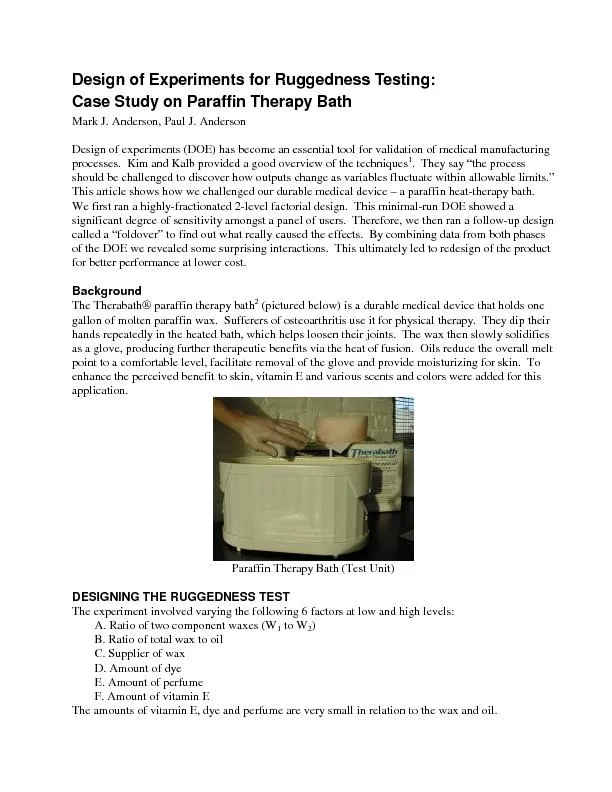
Paraffin Therapy Bath Test UnitThe experiment involved varying the following 6 factors at low and high levelsA Ratio of two component waxes WB Ratio of total wax to oilD Amount of dyeF Amount ID: 420242

Paraffin Therapy Bath (Test Unit)The

Share:

Link:

Embed:

Download Presentation from below link

Download Pdf The PPT/PDF document "Design of Experiments for Ruggedness Tes..." is the property of its rightful owner. Permission is granted to download and print the materials on this web site for personal, non-commercial use only, and to display it on your personal computer provided you do not modify the materials and that you retain all copyright notices contained in the materials. By downloading content from our website, you accept the terms of this agreement.


Presentation Transcript

Design of Experiments for Ruggedness Testing:Case Study on Paraffin Therapy BathMark J. Anderson, Paul J. AndersonDesign of experiments (DOE) has become an essential tool for validation of medical manufacturingprocesses. Kim and Kalb provided a good overview of the techniques. They say “the processshould be challenged to discover how outputs change as variables fluctuate within allowable limits.”This article shows how we challenged our durable medical device – a paraffin heat-therapy bath.We first ran a highly-fractionated 2-level factorial design. This minimal-run DOE showed asignificant degree of sensitivity amongst a panel of users. Therefore, we then ran a follow-up designcalled a “foldover” to find out what really caused the effects. By combining data from both phasesof the DOE we revealed some surprising interactions. This ultimately led to redesign of the productThe Therabath paraffin therapy bathgallon of molten paraffin wax. Sufferers of osteoarthritis use it for physical therapy. They dip theirhands repeatedly in the heated bath, which helps loosen their joints. The wax then slowly solidifiesas a glove, producing further therapeutic benefits via the heat of fusion. Oils reduce the overall meltpoint to a comfortable level, facilitate removal of the glove and provide moisturizing for skin. To Paraffin Therapy Bath (Test Unit)The experiment involved varying the following 6 factors at low and high levels:A. Ratio of two component waxes (WB. Ratio of total wax to oilD. Amount of dyeF. Amount of vitamin EThe amounts of vitamin E, dye and perfume are very small in relation to the wax and oil. For response measures, an “expert” panel of 10 employees provided sensory evaluation of color,scent, heating, oiliness and quality of the wax glove. They rated the paraffin on a hedonic scale (best). The results were analyzed by individual (block) andthen averaged, thus providing a fairly powerful tool for discriminating changes in performance ofthe device.Ideally, the variations in factor levels we tested would not affect the response. This would provethat the system is rugged, thus fulfilling the purpose of validation. On the other hand, a significantoutcome would require further work to fine-tune the system.The full factorial design for 6 factors requires 64 runs (2). To keep the testing at a manageable fraction of all the combinations (26-3) for a total of only 8 runs. Cutting thedesign back to so few runs causes main effects to be aliased with two-factor interactions (see Table [Intercept] = Intercept + ABD + ACE + BCF + DEF [A] = A + BD + CE + BEF + CDF [B] = B + AD + CF + AEF + CDE [C] = C + AE + BF + ADF + BDE [D] = D + AB + EF + ACF + BCE [E] = E + AC + DF + ABF + BCD [F] = F + BC + DE + ABE + ACD [AF] = AF + BE + CD + ABC + ADE + BDF + CEF An alias occurs when inputs are perfectly correlated. Then you cannot distinguish one from theother. For example, the effect of factor A cannot be separated from those of interactions BD, CE ortwo other higher-order interactions. However, the aliases become moot if nothing is significant –the hoped-for (rugged) outcome. If any factors do appear significant, the low resolution generallyprecludes definitive conclusions, so you will then need to do further experimentation to pin downRESULTS FROM INITIAL STUDYAnalysis of the DOE with a commercially-available statistics package revealed significant impactson perceptions of users. Therefore, the device did not pass the ruggedness test. For example, Figure1 shows a half-normal probability plot for color. Half-normal plots show the absolute value of theeffect on the x-axis. The effects are shown as square points. Estimates of error are displayed astriangles. The biggest effects, those to the right, are most likely to be real. However, many of theestimated effects may occur due to chance. These will be grouped near the zero effect level. The y-axis is constructed to be linear in the normal scale, so the near-zero (insignificant) effects fall on theline emanating from the origin (0,0). One effect stands out: D – the amount of dye. Half Normal plot 0.60 1.19 1.79 2.39 0 40 60 70 80 85 90 95 97 99 Standard statistical procedures for analysis of variance (ANOVA) reveal a probability of less than0.1% that this big of an effect could have been caused by chance. According to the alias table, thishighly significant effect could also be caused by interactions AB and/or EF. (The graph arbitrarilydisplays the main effect (D), since this is most likely.) However, we made the assumption that colorwould be affected only by amount of dye (D). The panel preferred higher levels dye/color.For scent, the biggest effect was factor E – the amount of perfume (see Figure 2), but it did not standout as clearly as color. However, an outlier was detected in run (bath) #1 (see Figure 3). The y-axison this chart shows the “T”value – a statistic that indicates how many standard deviations a resultdiffers from expected. Half Normal plot 0.22 0.43 0.65 0.86 0 20 40 60 70 80 85 90 95 97 99 -1.60 2.19 4.09 1 2 3 4 5 6 7 8 9 10 Figure 2: Probability Plot of Scent (All data)Figure 3: Outlier Detected (Run #1) Anything outside of plus or minus 3.5 standard deviations can be considered as a possible outlier,since it’s unlikely to have occurred due to chance. Upon further investigation, it was found that thetemperature of this bath ran significantly high, thus generating more than the expected amount ofscent.After removing the outlier, the perfume (E) stood out even more clearly as the most likely cause ofthe effect on scent. ANOVA shows the probability of this happening by chance to be less than 1 percent0. Again it seems reasonable to make a leap of faith that factor E is the cause and not its aliasedinteractions, in this case BC and DE. The panel preferred higher levels of perfume for the attributeThe statistical analysis revealed nothing significant for perception of heat (see Figure 4). Half Normal plot 0.12 0.24 0.35 0.47 0 40 60 70 80 85 90 95 97 99 Figure 4: No Significant Effects for Perception of HeatPerceptions of oiliness were significantly affected (Figure 5), but the aliasing of main effects withinteractions in the resolution III design made it impossible to draw any definite conclusions. Forexample, it makes no sense that factor E, the dye, would affect oiliness. This factor must really beone of the aliased effects: AC and/or DF. Also, the other significant effect, AF, could be BE and/orCD. It’s very confusing. Unlike the results for color and scent, there was no obvious explanationfor the effects, especially considering the possibility of aliasing. At this stage, we exhausted thecapability of the low-resolution design. We needed more experimentation to uncover the truecauses for the failure of the ruggedness test. Half Normal plot 0.14 0.28 0.42 0.56 0 40 60 70 80 85 90 95 97 99 Figure 5: Plot of Effects for OilinessFOLLOW-UP EXPERIMENT REVEALS TRUE CAUSES FOR VALIDATION FAILUREBy adding a second block of experiments with all levels reversed, you can eliminate aliasing ofmain effects with 2-factor interactions.remain somewhat aliased. However, before doing the foldover, we eliminated dye (D) and perfume(E) as factors - on the assumption that they affected only color and scent respectively. We set dye Analysis of the combined data continued to show no significant impact on perceptions of heat. Thisis an important finding. Prior to doing the DOE, the manufacturing people were concerned thatusers would be sensitive to variations in melt point caused by changes in ratios of wax and oil. Forthis attribute the process passed the challenge of validation: it’s robust to expected variations.In regard to perception of the glove, the first experiment seemed to indicate some effects (graph notshown), but after reviewing data for the entire series of runs, including the foldover, it’s nowbelieved that none of the factors affected user perceptions (see Figure 6). Therefore, this is anotherattribute that passed the ruggedness test. Half Normal plot 0.09 0.18 0.27 0.35 0 20 40 60 70 80 85 90 95 97 99 No terms are selected. Figure 6: Plot of Effects for Glove (combined results)The final results on perception of oiliness (see Figure 7) indicate dependence on the combination of wax to W wax (A), higher ratio of total wax to oil (B) and amount of Half Normal plot 0.19 0.39 0.58 0.78 0 20 40 60 70 80 85 90 95 97 99 Figure 7: Plot of Effects for Oiliness (combined data)Three-factor interactions such as this are very unusual, but more likely in experiments that involvemixtures. The series of interaction graphs shown on Figures 8 a, b and c show the complexbehavior governing perception of oiliness. Interaction Graph g h/Low -0.500 0.500 1.000 5.63 6.00 6.38 6.75 7.13 7.50 7.88 g h/Low -0.500 0.500 1.000 5.63 6.00 6.38 6.75 7.13 7.50 7.88 g h/Low -1.000 -0.500 0.500 1.000 5.63 6.00 6.38 6.75 7.13 7.50 7.88 Figures 8a, b and c: Interaction AB at Low level of Vitamin E, Middle level of Vitamin E, Highestlevel of Vitamin E (Triangles are positive levels of B (wax to oil), squares are negative levels)To pick the winning combination of the three factors (highest rated), it’s easier to work with a cubeplot (Figure 9). A-A+ Figure 9: Cube Plot Shows Best Combination (upper right front) for 3 Factors Affecting OilinessBased on the results from the two-step DOE, we recommended some changes to the product:Cheapest supply of raw material wax - factor C, which did not significantly affect any of theAdd more color and scent, which may also mask variability of native colors and scents.Reduce the vitamin E and increase the ratio of W wax to W wax and the ratio of wax to oil. This application provides a good example of how to apply the power of two-level factorial DOE tovalidation testing. It demonstrates the flexibility of the approach should the validation fail. In thissituation, the use of foldover runs provides a profound knowledge of how variations in factors canaffect your process or product.DOE is just one of the statistical tools used in validation. It challenges the system and identifieswhich factors to control. But this is not the end. Other tools, such as statistical process control(SPC) must be employed to show that the system can produce consistent outputs over time, andmeet specifications with a high level of confidence and reliability.ACKNOWLEDGEMENTSDave Sletten of WR Medical did all the experimental work. Patrick Whitcomb of Stat-Easeprovided valuable advice on the setup and analysis of the DOEs.Kim JS, Kalb JW, , MDDI,WR Medical Electronics Company, 123 N. 2Design-Ease software, Version 5 for Windows, Stat-Ease, Inc., Minneapolis ($395).Montgomery DC, ed, Wiley, New York, 1997, p. 413. Mark J. Anderson is a principal of Stat-Ease, Inc. and WR Medical Electronics Company. Paul J.Anderson is Vice-President of R&D and a principal of WR Medical Electronics Company.