/
Journal of the American Academy of Audiology/Volume 12, Number 4, Apri Journal of the American Academy of Audiology/Volume 12, Number 4, Apri

Journal of the American Academy of Audiology/Volume 12, Number 4, Apri - PDF document

phoebe-click
phoebe-click . @phoebe-click
Follow
385 views
Uploaded On 2017-03-08

Journal of the American Academy of Audiology/Volume 12, Number 4, Apri - PPT Presentation

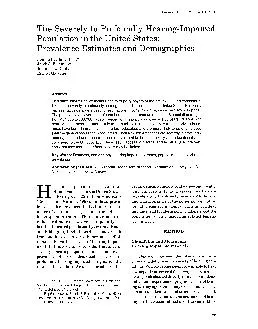
Journal of the American Academy of AudiologyVolume 12 Number 4 April 2001 1844 yr 4564 yr 6579 yr 80 yr I Severely to Profoundly Hearing Impaired US Population Figure 3 Medicare coverage by age ID: 523743

Journal the American Academy

Share:

Link:

Embed:

Download Presentation from below link

Download Pdf The PPT/PDF document "Journal of the American Academy of Audio..." is the property of its rightful owner. Permission is granted to download and print the materials on this web site for personal, non-commercial use only, and to display it on your personal computer provided you do not modify the materials and that you retain all copyright notices contained in the materials. By downloading content from our website, you accept the terms of this agreement.


Presentation Transcript

Journal of the American Academy of Audiology/Volume 12, Number 4, April 2001 accurately than in the past, current audiologic tools can identify patients who might benefit from particular forms of intervention. Common classifications of hearing impairment include slight (16-25 dB), mild (26-40 dB), moderate (41-60 dB), moderate-severe (61-70 dB), severe (71-89 dB), and profound (90+ dB), with each cat-egory representing decreasing auditory sensi-tivity. Although these classifications are commonly accepted, the criteria used to deter-mine the categories differ. For example, decibel levels assigned to the categories may be incon-sistent. In addition, some surveys of hearing loss use self-reported evaluation of hearing or functional status rather than audiometric results to define the degree of impairment. Although hearing impairment classifica-tions based on audiometric test results are largely objective, classification and measure-ment of hearing impairment based on self-assessment of hearing level can be quite subjective. However, research has shown that self-reported hearing assessment is predictive of the audiometric test result classifications (Nondahl et al, 1998; Reuben et al, 1998). The accuracy of self-reported data has been shown to fall within a few percentage points of actual audiometric results. In addition, the perfor-mance of self-reported data in estimating hear-ing loss has been shown to depend on the number and type of questions asked. Self-reported hearing loss is generally character-ized using phrases such as little trouble hearing, a lot of trouble hearing, understands conver-sation with normal voices, understands whis-pers, and understands shouting in the ear. These phrases capture a range in severity of hearing impairment by offering alternative descriptions of hearing ability. Use of functional status indicators to clas-sify hearing impairment is helpful when attempting to quantify the costs to society to maintain the functionality of an individual with hearing impairment. For example, a per-son who is profoundly deaf may not be able to function independently in the hearing world without significant help from another person (such as an interpreter) or through assistive technology. This lack of uniformity in defining hearing impairment has made it difficult to assume standard levels of hearing across studies. For this reason, our estimates are based on multiple datasets using self-reports of hearing impair-ment and functional status and audiometric results. These data are discussed below. Data Three nationally representative data sets were used to estimate the prevalence of severe to profound hearing impairment. Each survey addresses hearing loss differently using either self-reported evaluation of hearing loss, self-reported functional status, or audiometric test-ing. An expert advisory panel consisting of an audiologist, an otorhinolaryngologist, a speech pathologist, and a deafness educator corrobo-rated our assumptions and definitions of hear-ing impairment. As each survey uses different criteria to identify hearing loss and we obtain similar estimates from each, we are confident in the reliability of our final nationally weighted range of prevalence. Our final estimate of preva-lence is based on a synthesis of the results gen-erated from each of the three separate estimates. The National Health Interview Survey (NHIS) and its hearing supplements from 1990 and 1991 were used to estimate prevalence in the population ages 3 years and older based on the self-reported assessment of hearing loss by respondents (NCHS, 1993, 1995). The NHIS from 1994 and 1995 provided prevalence esti-mates for the population ages 3 years and older based on self-reported functional status of respondents who indicated that they had a hear-ing condition (NCHS, 1998, 1999). The National Health and Nutrition Examination Survey (NHANES) 111 1988-1994 was used to estimate the prevalence of severe to profound hearing loss in the population of 6 to 19 year olds based on audiometric test results (NCHS, 1997). The Appendix describes the classification procedure for each survey. We assumed that no significant change in the population distribution occurred since these data were collected that distorted or biased our final prevalence estimates. To minimize the possibility of false-positive responses when identifying the target popula-tion, we designed an iterative process to iden-tify severely to profoundly hearing-impaired persons and have calculated two separate pop-ulation estimates. Initially, we classified only those survey respondents who answered a series of specific questions with no inconsistencies as "very likely" to be severely to profoundly hear-ing impaired. The limitation to this methodol-ogy is the probability of excluding respondents who are severely to profoundly hearing impaired but who provided inconsistent responses to selected survey questions (false negatives). To avoid systematically underestimating the target population, in the second calculation, we relaxed 184 Journal of the American Academy of Audiology/Volume 12, Number 4, April 2001 18-44 yr 45-64 yr 65-79 yr 80+ yr I Severely to Profoundly Hearing Impaired US Population Figure 3 Medicare coverage by age in the severely to profoundly hearing-impaired population and the US population. on average, poorer than other Americans. Fifty-three percent of the study population have a family income of less than $25,000 (Fig. 4) com-pared to 35 percent of the general US popula-tion (Fig. 5). Of the severely to profoundly hearing-impaired population who are over 17 years of age, approximately 44 percent did not graduate from high school compared to only 19 percent in the general population (Fig. 6). Forty-six percent of these hearing-impaired students graduated from high school and reported some college atten-dance compared to 60 percent of the general population of students. Only 5 percent of the severely to profoundly hearing-impaired stu-dents graduated from college compared to 13 per-cent of the general population. $26,000-$49,999 Note: Total Prevalence of Severe to Profound Hearing Impairment - 464,000 Figure 4 Distribution of the severely to profoundly hearing-impaired population by family income. $10,000-$24,999 Figure 5 Distribution of the US population by family income. Although labor force participation of the severely to profoundly hearing-impaired popu-lation over age 65 is similar to the general pop-ulation, many working-age adults with hearing impairment are not in the labor force (Fig. 7). Specifically, 42 percent of those with severe to profound hearing impairment between the ages of 18 and 44 years are not working compared to 18 percent of the general population. Approxi-mately 54 percent of those aged 45 to 64 years are without jobs compared to 27 percent of the general population. DISCUSSION A pproximately one half to three-quarters of a million Americans are severely to pro- foundly hearing impaired and require special Did not High school College Post-college graduate graduate, graduate high school some college Note: Total Prevalence of Severe to Profound Hearing Impairment- 464,000 13 Severely to Profoundly Hearing Impaired US Population Figure 6 Education level among persons 18 years and over in the severely to profoundly hearing-impaired population and the US population. 186 Journal of the American Academy of Audiology/Volume 12, Number 4, April 2001 NCHS Data Dissemination Branch, CD-ROM Series 10, No. 5. National Center for Health Statistics. (1997). National Health and Nutrition Examination Survey, 111 1988-94. Hyattesville, MD: NCHS Data Dissemination Branch, CD-ROM Series 11, No. 1. O'Neill C, O'Donoghue GM, Archbold SM, Normand C. (2000). A cost-utility analysis of pediatric cochlear implan-tation. Laryngoscope 110:156-160. Palmer CS, Niparko JK, Wyatt JR, Rothman ML, deLissovoy G. (1999). A prospective study of the cost-utility of the multichannel cochlear implant. Arch Otolaryngol Head Neck Surg 125:1221-1228. National Center for Health Statistics. (1998). 1995 National Health Interview Survey on Disability, Phase I and 77. Hyattesville, MD: NCHS Data Dissemination Branch, CD-ROM Series 10, No. 10A. National Center for Health Statistics. (1999). 1994 National Health Interview Survey on Disability, Phase I and II. Hyattesville, MD: NCHS Data Dissemination Branch, CD-ROM Series 10, No. 8. Nondahl DM, Cruickshanks KL, Willet TL, Tweed TS, Klein R, Klein BEK. (1998). Accuracy of self-reported hearing loss. Audiology 37:295-301. APPENDIX Classification of Severity of Hearing Impairment Self-Reported Hearing Loss Using NHIS Supplements 1990 and 1991 Respondents to these surveys were asked a series of questions regarding their hearing loss. With the assistance of our expert panel, we iden-tified groups of questions that should be answered with a "yes" by someone with severe to profound hearing impairment. We identified those respondents who answered in this way and included them as our target population. We cre-ated subsets of data that we used iteratively in our analysis. These subsets are described as follows: Condition Subset. Includes respondents to the survey who indicated that they or a family member were deaf in both ears. This condition is identified by the code 203 in the NHIS data. Self-Report Scale. Includes two questions ask-ing respondents to self-assess their hearing problem by answering a series of questions. Respondents indicating that they were deaf in both the right and left ears are targeted. Gallaudet Hearing Scale. A set of survey questions asking respondents whether they can Reuben DB, Walsh K, Moore AA, Damesyn M, Greendale GA. (1998). Hearing loss in community-dwelling older persons: national prevalence data and identification using simple questions. J Am Geriatr Soc 46:1008-1011. Vohr BR, Carty LM, Moore PE, Letourneau K. (1998). The Rhode Island Hearing Assessment Program: expe-riences with statewide hearing screening (1993-1996). J Pediatr 133:353-357. Wyatt JR, Niparko JK, Rothman ML, deLissovoy G. (1995). Cost effectiveness of the multichannel cochlear implant. Am J Otolaryngol 16:52-62. hear and understand a whisper, a normal voice, a shout, or a shout in the ear. Responses are scored, and scores are used to indicate hearing level. A Gallaudet Score of 5. Indicates respondents who answered that they are unable to hear and understand even when a person speaks loudly into their better ear. A Gallaudet Score of 4. Indicates respondents who answered that they are able to hear and understand when a person speaks loudly into their better ear but unable to hear and under-stand when a person shouts to them across a quiet room. Very Likely. The process to estimate the very likely severely to profoundly hearing-impaired population is depicted below. Every survey respondent who indicated using a TDD or a TTY was included in the very likely population. In addition, those respondents reporting that they were deaf in both ears and who scored a 4 or 5 on the Gallaudet scale were also included in the very likely group. Likely. The process to estimate the likely severely to profoundly hearing-impaired group included those respondents reporting that they were deaf in both ears or who scored a 4 or 5 on the Gallaudet Scale and who also indicated that they had a deafness condition. 188