PPT-Mapping urban sprawl and impervious surfaces in New England over the past
Author : phoebe-click | Published Date : 2020-01-08
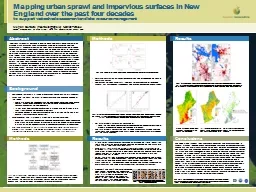
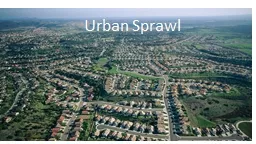
Mapping urban sprawl and impervious surfaces in New England over the past four decades to support watershed assessment and lake resource management Megan Corbiere
Presentation Embed Code
Download Presentation
Download Presentation The PPT/PDF document "Mapping urban sprawl and impervious surf..." is the property of its rightful owner. Permission is granted to download and print the materials on this website for personal, non-commercial use only, and to display it on your personal computer provided you do not modify the materials and that you retain all copyright notices contained in the materials. By downloading content from our website, you accept the terms of this agreement.
Mapping urban sprawl and impervious surfaces in New England over the past: Transcript
Download Rules Of Document
"Mapping urban sprawl and impervious surfaces in New England over the past"The content belongs to its owner. You may download and print it for personal use, without modification, and keep all copyright notices. By downloading, you agree to these terms.
Related Documents


![Urban Sprawl [Date]](https://thumbs.docslides.com/476164/urban-sprawl-date.jpg)