/
Radiometric Calibration of Current and Future Ocean Color S Radiometric Calibration of Current and Future Ocean Color S

Radiometric Calibration of Current and Future Ocean Color S - PowerPoint Presentation

phoebe-click
phoebe-click . @phoebe-click
Follow
448 views
Uploaded On 2016-06-26

Radiometric Calibration of Current and Future Ocean Color S - PPT Presentation

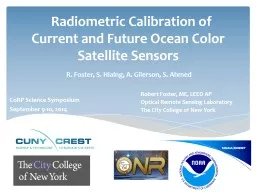
R Foster S Hlaing A Gilerson S Ahmed Robert Foster ME LEED AP Optical Remote Sensing Laboratory The City College of New York CoRP Science Symposium September 910 2014 Introduction amp Motivation ID: 378969

simulated data satellite viirs data simulated viirs satellite amp calibration vicarious comparisons toa ocean radiometric wavelengths modis coastal procedure

Share:

Link:

Embed:

Download Presentation from below link

Download Presentation The PPT/PDF document "Radiometric Calibration of Current and F..." is the property of its rightful owner. Permission is granted to download and print the materials on this web site for personal, non-commercial use only, and to display it on your personal computer provided you do not modify the materials and that you retain all copyright notices contained in the materials. By downloading content from our website, you accept the terms of this agreement.


Presentation Transcript

Slide1

Radiometric Calibration of Current and Future Ocean Color Satellite Sensors

R. Foster, S. Hlaing, A.

Gilerson, S. Ahmed

Robert Foster, ME, LEED AP

Optical Remote Sensing Laboratory

The City College of New York

CoRP

Science SymposiumSeptember 9-10, 2014Slide2

Introduction & MotivationDatasets & MethodologyResults

Summary & ConclusionOutlineSlide3

This work is focused on coastal areas. Why?

More

than half of the world’s population exists in coastal regions

.Harmful Algal Blooms cause 10% of all foodborne disease outbreaks (toxins from algal blooms do not cook out of food).Economic activity associated with the ocean added $222 billion to the US economy in 2009.

Vacationers visiting coastal regions spend $44 billion annually.Much of the radiometric work associated with the open ocean has been figured out already.

Introduction & MotivationFacts taken from the

Natural Resources Defense Council website http://www.nrdc.org/water/oceans/ttw/health-economic.aspSlide4

Remote Sensing of Coastal Waters is extremely challenging.

Current

Ocean Color (OC) sensors include MODIS-Aqua, and the recently launched VIIRS.

Traditionally, OC sensors have relied on robust in-orbit radiometric calibration and validation procedures based on the MOBY buoy.The final adjustment made to the sensor’s TOA measurements, based on surface measurements or climatology model, is known as a

vicarious calibration procedure. Introduction & MotivationSlide5

There are two basic kinds of vicarious calibration.

The first one is usually referred to as the (system) vicarious calibration procedure.

In that procedure, calibration coefficients are obtained by forcing satellite-derived water-leaving radiances to agree with in-situ ones.

The second procedure, which is referred to as a radiometric vicarious calibration, consists of simulating the TOA signal that the sensor should measure under certain conditions, and to compare it to the measured signal.Introduction & MotivationSlide6

Datasets

AERONET-OC

Aerosol optical thickness (

τaot)

Single Scattering Albedo (SSA)Scattering phase

functionsWater Absorption and

Scattering coefficients (derived using a Quasi Analytical Algorithm)National Weather ServiceAtmospheric pressureWind Speed NASA Ozone Monitoring Instrument (OMI)Molecular absorption in the atmosphereNASA MODIS-AquaTop of Atmosphere Radiance Lt

(λ)NASA VIIRSTop of Atmosphere Radiance Lt(λ)Slide7

Methodology

Simulated Top of Atmosphere (TOA) measurements are directly comparable to satellite observations.

This decouples the atmospheric correction procedure from the matchup

– a major source of uncertainty.

Satellite

Lt(λ)Slide8

AERONET-OC sites

WaveCIS

LISCO

Time series of

nLw

(551nm), in mW/cm2/μm/sr

LISCO the particulate backscattering coefficient at 551 nm ranges from 0.01 to 0.03 m–1, the total absorption coefficient at 443 nm varies from 0.38 to 1.2 m–1; the absorption due to CDOM at 443 nm is typically close to 0.4 m–1 and can be as high as 1 m–1.

WaveCIS particulate backscattering coefficient at 551 nm is usually around 0.01 m–1. seasonal average of the total absorption of water body is equal to 0.31 m–1 at 442 nm, of which ~0.15 m-1 is attributed to CDOM.Three-year (2011–2013) average Angstrom exponent γ (443, 870) of LISCO is 1.76, whereas it is 1.23 for WaveCIS. This implies that the aerosols over WaveCIS are dominated by coarse particles whereas the LISCO site has notable contributions from fine aerosol particles. Slide9

Matchup comparisons between the simulated and VIIRS L

t

(λ)

WaveCIS

LISCO

Excellent correlations with the overall R values close to 1 are observed for both sites. Spectral variation ranges of simulated and VIIRS

Lt (λ) are the same. Regression lines for the comparisons are very close to 1:1 diagonals: simulated Lt (λ) data are spectrally and magnitude wise consistent with those of measured (i.e. VIIRS).Slide10

Matchup comparisons between the simulated and VIIRS Lt(λ) (Blue & Green parts of the spectrum)

Excellent correlations with the overall R values close to 1 are observed

at every wavelengths.

Variation ranges of simulated and VIIRS Lt are the same.

Regression lines for the comparisons are very close to 1:1 diagonals.These observations underscore that the simulated dataset is suitable for making assessments of the radiometric accuracy and stability

of the Satellite Ocean Color sensors in blue and green wavelengths. Slide11

Different story emerges for Red and NIR wavelengths.

Regression

lines for the comparisons significantly deviate from 1:1 diagonals.

Simulated data underestimate ~10% & ~30% respectively at 671 and 862 nm wavelengths.Excellent correlations are also observed at both wavelengths.This observed discrepancy between the simulated and VIIRS data will be further scrutinized in next few slides.

Matchup comparisons between the simulated and VIIRS L

t

(λ) at each wavelength (Red & NIR parts of the spectrum)Slide12

Matchup comparisons between the simulated and MODIS Lt (λ

) at WaveCIS

Unlike VIIRS, the uncertainties between MODIS and simulated Lt

are higher at every wavelength.Only

modest correlation is achieved for the comparisons at 551, 667 & 869 nm (R values are 0.85, 0.78 & 0.75 respectively). This can be largely explained by the MODIS’s lower 1 km nadir nominal

resolutionSlide13

Derivation of the radiometric vicarious calibration gain factors

simulated

satellite

The

g

c

values derived for both VIIRS MODIS for blue and green wavelengths are within typical vicarious adjustment range.Such large deviations also exist for MODIS in NIR channels.Slide14

Sensor

SeaWiFS

MODIS

MODIS

VIIRS

VIIRS

SiteAAOT*AAOT*WaveCISWaveCIS

LISCO671(667) nm channels0.905460.91540.96930.8917

0.9123

745 (748) nm channels

0.851

0.875

0.8444

0.854

0.868

862 (869) nm channels

0.83

0.839

0.834

0.706

0.700

In the vicarious calibration study by

Melin

and Zibordi

*

for MODIS and

SeaWiFS

sensors based on the data from the AAOT AERONET-OC site but with a different methodology, similar trend is observed in Red and NIR

.

Although

correlations between the simulated and satellite TOA L

t

at the red and NIR channels are high (R ≥ 0.93 for those channels), validities of the resulting

g

c

values are inconclusive at the moment, further separate study should be granted to resolve the issues.

*

F.

Mélin

and G. Zibordi, "

Vicarious calibration of satellite ocean color sensors at two coastal sites

," Appl. Opt.

49

, 798-810 (2010).

Similar Results by a Third PartySlide15

Summary

Coastal locations of AERONET-OC site make this particularly suited for improving coastal satellite retrievals.

Cross-site uncertainty is well below or around the 0.5% in blue and green part of the

spectrum. Including more AERONET sites in the gain derivation process can help reduce the overall uncertainty.The derivations are intended only as capability demonstration and should not be regarded as the final results.

It can be expected that in an ideal case, as long as the sensor calibration improves, both the MOBY based system vicarious approach and this RT based approach should converge providing high quality atmospheric and oceanic data in open ocean and coastal areas with the current or slightly adjusted atmospheric correction.

S. Hlaing, A.

Gilerson, R. Foster, M. Wang, R. Arnone, S. Ahmed, “A Radiometric Approach for Calibration of Current and Future Ocean Color Satellite Sensors ,” Optics Express. Currently in press.For More Information:Slide16

Thank you!Slide17

AppendixSlide18

The VIIRS and MODIS TOA L

t

(λ) used for comparisons with the simulation results are all extracted from a small region

(3×3 pixel box) centered at the site locations. Average value of the Lt

(λ) of 3×3 pixel box, except the center one, is evaluated against simulated TOA L

t (λ). The exclusion of the central pixel is intended to minimize the potential uncertainty resulting from the platform effects due to the high albedo of the platform structure

.We also exclude the satellite Lt (λ) data with high spatial variability from the analysis, using the relative standard deviation (coefficient of variation), calculated as σrel = σ/µ where σ and µ are the standard deviation and mean, respectively. σ

rel is set to 0.2. Level 2 quality flag conditions are acquired through the standard NASA processing scheme: land, cloud, stray light, bad navigation quality, both high and moderate glint, and high sensor viewing and/or solar zenith angles. Data points with the sensor–sun relative azimuth angle less than 40° (i.e., TOA radiance measurements made close to the direct solar path) are also excluded from the analysis.

In

addition, at least 50% of the pixels in the region of interest must satisfy all quality flag conditions in order to qualify for the match-up comparisons with the simulated TOA Lt (λ) and to be used in the derivation of radiometric vicarious gain

factors.

Satellite Data Filtering and Processing ProceduresSlide19

Statistical Filtering Procedure

A statistical

match-up comparison filtering

procedure is further applied.

relative percentage difference of the ith match-upx

i and yi stand for the ith

individual satellite and simulated match-up TOA radiance data points, respectively. Then the initial average (μRPD) and standard deviation (σRPD) of the all resulting RPDi between the two data being compared are calculated. After that any match-ups with the RPDi values outside the μRPD ± ∆ σRPD range are excluded from further analysis. This procedure is applied just to ensure that the values of the statistical parameters thus obtained are not skewed by one or a very few extreme cases whose statistics are entirely out of range of the majority of cases.

∆ is set to 2 for all matchup comparison analysis and 1 for the radiometric vicarious gain derivation.Slide20

In-situ data

All

input AERONET-OC data used in this study are level 1.5 data.

AERONET-OC data to the RT simulations are selected from the measurements made within a ±2h time window of the satellite overpass time of the locations of the sites.

SeaPRISM’s center wavelengths (413, 442, 491, 551, 667 & 870 nm) are slightly different from those of VIIRS’s (410, 443, 486, 551, 671 & 862). Therefore aerosol optical thickness data (τ

aot) at exact VIIRS center wavelengths are obtained by interpolation using Angstrom exponent (γ) at corresponding wavelengths

.Satellite dataNASA VIIRS dataPseudo Level 1 VIIRS images of the LISCO and WaveCIS locations have been obtained for two years (January 2012 to December 2013) period from NASA OBPG ocean color website.Then, SeaDAS software version 7.0.2 package in order to generate the fully calibrated and geo-located level 2 data.IDPS VIIRS dataVIIRS SDR data of IDPS processing is obtained from NOAA

NESDIS. They are completely calibrated and geo-located at the SDR level & do not require additional processing.MODIS dataMODIS level 1 collection 6 images are acquired from the NASA Level 1 and Atmosphere Distribution System (LAADS). These data are also fully calibrated and geo-located.Note: Comparison

between the NASA and IDPS VIIRS L

t

data exhibits almost perfect correlation at every wavelength but

slightly time dependent

discrepancy

(1 – 3%) in

terms of magnitude.

For

consistency purpose, we used only the NASA VIIRS data for all analyses in this study.

In-situ & Satellite Data