/
The Global Carbon Cycle The Global Carbon Cycle

The Global Carbon Cycle - PowerPoint Presentation

phoebe-click
phoebe-click . @phoebe-click
Follow
396 views
Uploaded On 2016-10-27

The Global Carbon Cycle - PPT Presentation

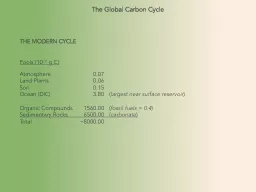
THE MODERN CYCLE Pools 10 19 g C Atmosphere 007 Land Plants 006 Soil 015 Ocean DIC 380 largest near surface reservoir Organic Compounds 156000 fossil fuels 04 ID: 481328

ocean source noaa www source ocean www noaa doi 1029 surface http heat change content gov cycle keeling science

Share:

Link:

Embed:

Download Presentation from below link

Download Presentation The PPT/PDF document "The Global Carbon Cycle" is the property of its rightful owner. Permission is granted to download and print the materials on this web site for personal, non-commercial use only, and to display it on your personal computer provided you do not modify the materials and that you retain all copyright notices contained in the materials. By downloading content from our website, you accept the terms of this agreement.


Presentation Transcript

Slide1

The Global Carbon Cycle

THE MODERN CYCLE

Pools (10

19

g C)

:

Atmosphere

0.07

Land Plants

0.06

Soil 0.15

Ocean (DIC)

3.80

(

largest near surface reservoir

)

Organic Compounds

1560.00

(

fossil fuels = 0.4

)

Sedimentary Rocks

6500.00 (

carbonate

)

Total

~

8000.00 Slide2
Slide3

Fluxes (10

15

g C)

: …prior to the anthropocene Atmospheric Pool Uptake ReleaseLand 120 45Soil 0 75Ocean 90 90Total 210 210Human perturbations:Fossil Fuel Combustion Land-Use Change

The Global Carbon CycleSlide4

Source: NOAA National Centers for Environmental Information http://www.ncdc.noaa.gov/Slide5

Charles Keeling (1928-2005)

Source:

www.esrl.noaa.govSlide6

Source: Graven et al. (2013) ScienceSlide7

Charles Keeling (1928-2005)

Ralph Keeling

Source:

Graven et al. (2013) ScienceSource: www.esrl.noaa.govSlide8
Slide9
Slide10
Slide11
Slide12
Slide13
Slide14

General map of surface ocean currentsSource:

http

://

www.seos-project.eu/modules/oceancurrents/oceancurrents-c03-p02.htmlSlide15

Source: http://www.grida.no/climate/vital/32.htm

Vertical movements of ocean waterSlide16

Synthesis figure showing both surface and deep water patterns of ocean circulationSource: http://

oceanmotion.org

/html/impact/

conveyor.htmSlide17

World ocean heat content and thermosteric sea level change (0–2000 m), 1955–2010

Geophysical Research Letters

Volume 39, Issue 10,

L10603, 17 MAY 2012 DOI: 10.1029/2012GL051106http://onlinelibrary.wiley.com/doi/10.1029/2012GL051106/full#grl29030-fig-0001w/Jane Lubchenko!24.0 +/- 1.9 x 10(22) J (+/-2S.E.)Slide18

World ocean heat content and thermosteric sea level change (0–2000 m), 1955–2010

Geophysical Research Letters

Volume 39, Issue 10,

L10603, 17 MAY 2012 DOI: 10.1029/2012GL051106http://onlinelibrary.wiley.com/doi/10.1029/2012GL051106/full#grl29030-fig-0001w/Jane Lubchenko!Fun Facts for the top 2000m Heat Content Increase: 24.0±1.9 x 10²² J (±2S.E.)0.39 W m-2 of ocean surface93% of the warming on EarthSlide19