PPT-Figure 1-Figure supplement 1a.
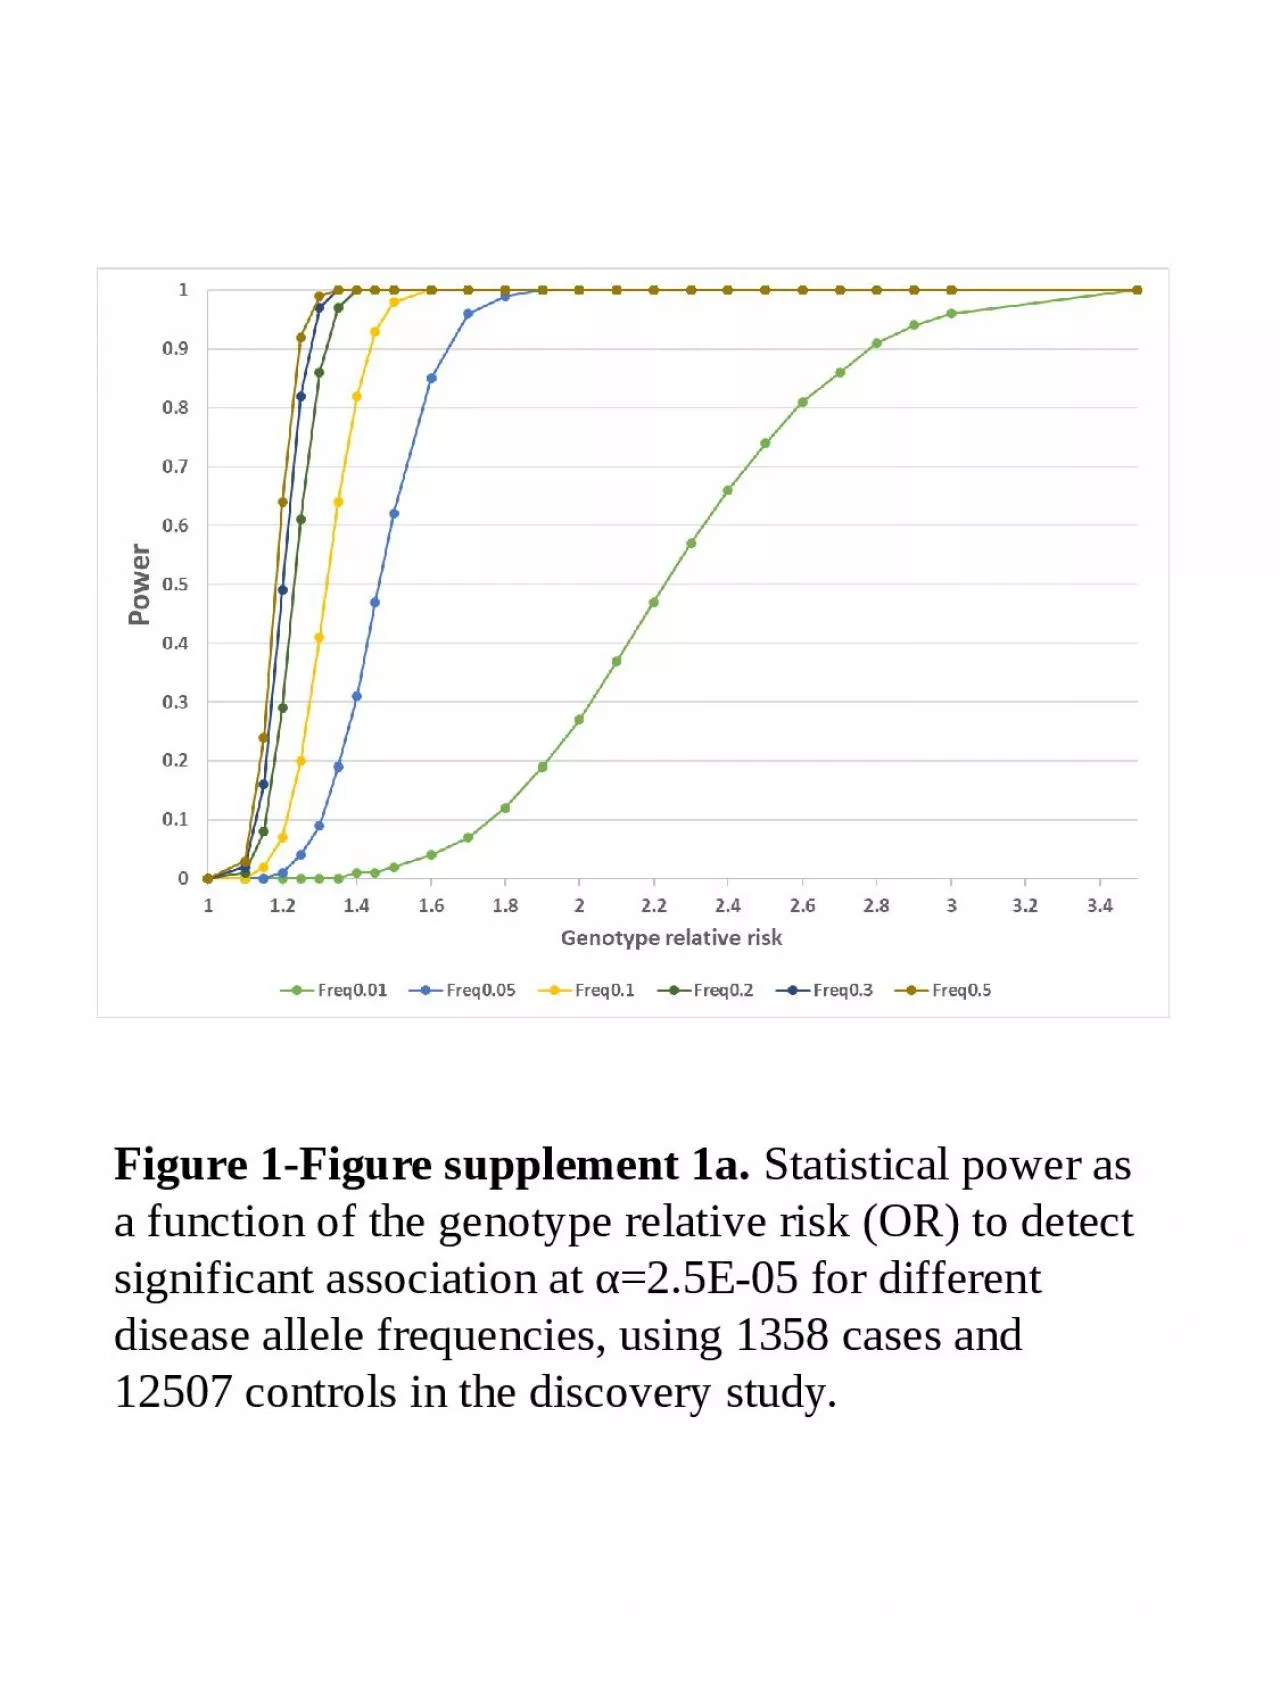
Statistical power as a function of the genotype relative risk OR to detect significant association at α 25E05 for different disease allele frequencies using 1358
Download Presentation
"Figure 1-Figure supplement 1a." is the property of its rightful owner. Permission is granted to download and print materials on this website for personal, non-commercial use only, provided you retain all copyright notices. By downloading content from our website, you accept the terms of this agreement.
Presentation Transcript
Transcript not available.