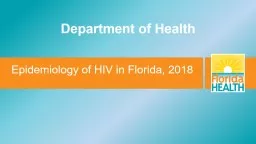
/
Epidemiology of HIV in Florida, 2018 Epidemiology of HIV in Florida, 2018

Epidemiology of HIV in Florida, 2018 - PowerPoint Presentation

popsmolecules
popsmolecules . @popsmolecules
Follow
344 views
Uploaded On 2020-06-16

Epidemiology of HIV in Florida, 2018 - PPT Presentation

Department of Health Epidemiology of HIV in Florida 2018 Florida Department of Health HIVAIDS Section Data as of 6302019 Technical Notes HIV diagnoses by year represent persons whose HIV was diagnosed in that year regardless of AIDS status at time of diagnosis ID: 779386

florida hiv data 2018 hiv florida 2018 data diagnoses persons diagnosis 2019 age msm living year plwh care idu

Share:

Link:

Embed:

Download Presentation from below link

Download The PPT/PDF document "Epidemiology of HIV in Florida, 2018" is the property of its rightful owner. Permission is granted to download and print the materials on this web site for personal, non-commercial use only, and to display it on your personal computer provided you do not modify the materials and that you retain all copyright notices contained in the materials. By downloading content from our website, you accept the terms of this agreement.


Presentation Transcript

Slide1

Epidemiology of HIV in Florida, 2018

Department of Health

Slide2

Epidemiology of HIV

in Florida, 2018

Florida Department of Health

HIV/AIDS Section

Data as of 6/30/2019

Slide3

Technical Notes

HIV diagnoses by year represent persons whose HIV was diagnosed in that year, regardless of AIDS status at time of diagnosis.

AIDS and HIV diagnoses by year are not mutually exclusive and cannot be added together.

HIV prevalence data represent persons who were living with an HIV diagnosis in the reporting area through the end of the calendar year (regardless of where they were diagnosed).

Resident deaths due to HIV represent persons who resided in Florida

and whose underlying cause of death was HIV, regardless if their HIV

status was reported in Florida or not.

Slide4

Technical Notes, Continued

Adult diagnoses represent ages 13 and older; pediatric diagnoses are those under the age of 13.

For data by year of diagnosis, the age is by age at diagnosis.

For prevalence data, the age is by current age at the end of the most recent calendar year, regardless of age at diagnosis.

Unless otherwise noted, Whites are non-Hispanic/Latino, Blacks are non-Hispanic/Latino, and Other (which may be omitted in some graphs due to small numbers) represents Asian, American Indian, or mixed races.

For diagnosis data by year, area and county data will exclude

Department of Corrections diagnoses. For prevalence data,

Department of Corrections will

not

be excluded from area and county data.

Slide5

Implement routine HIV and Sexually Transmitted Infections (STIs) screening in health care settings and priority testing in non-health care settings

Provide rapid access to treatment and ensure retention in care (Test and Treat)

Improve and promote access to antiretroviral pre-exposure prophylaxis (PrEP) and non-occupational post-exposure prophylaxis (nPEP)

Increase HIV awareness and community response through outreach, engagement, and messaging

Florida’s Plan to Eliminate HIV Transmission

and Reduce HIV-Related Deaths

Slide6

MSM:

Men who have sex with men

or male-to-male sexual contact (The term MSM indicates a behavior that allows for HIV transmission; it does not indicate how individuals self-identify in terms of sexuality or gender.)

IDU:

Injection drug use

MSM/IDU:

Men who have sex with men or male-to-male sexual contact and injection drug use

Transgender Sexual Contact:

Transgender men or women whose mode of exposure was sexual contactHeterosexual: Heterosexual contact with person who received an HIV diagnosis or had known HIV risk

Other Risk: Includes hemophilia, transfusion, perinatal and other pediatric risks, and other confirmed risks

Definitions of Mode of Exposure Categories

Slide7

HIV in the United States

Slide8

Rates of Diagnoses of HIV (All Ages),

by State of Residence, 2017, United States

1

Total U.S. Rate=11.8 N=38,281

1

US data: HIV Surveillance Report, 2017 (most recent available) Vol. 29, Table 26 http://www.cdc.gov/hiv/topics/surveillance/resources/reports/index.htm

Rate per 100,000 population

1

US data: HIV Surveillance Report, 2017 (most recent available) Vol. 29, Table 26 http://www.cdc.gov/hiv/topics/surveillance/resources/reports/index.htm

Slide9

Rank of HIV Diagnosis Rates (All Ages) by State

1

Diagnosed in 2018, United States

Rate per 100,000 population

1

US data: HIV Surveillance Report, 2018 Vol. 30, Table 26 http://www.cdc.gov/hiv/topics/surveillance/resources/reports/index.htm

Slide10

Rank of HIV Diagnosis Rates (All Ages) by Metropolitan Statistical Area (MSA)

1

Diagnosed in 2018, United States

Rate per 100,000 population

1

US data: HIV Surveillance Report, 2018 ,Vol. 30, Table 30 http://www.cdc.gov/hiv/topics/surveillance/resources/reports/index.htm

Slide11

Florida

1

and United States

2

(US)

HIV Incidence Rates, 2009–2018

1

Population rate data provided by Florida CHARTS as of 06/30/2019. 2US data: HIV Surveillance Report, 2018 (Vol. 30, Table 26) http://www.cdc.gov/hiv/topics/surveillance/resources/reports/index.htm

Slide12

1

Persons Living with HIV (PLWH), Total Population and PLWH are based on data as of 6/30/2019.

2

Strategic Long Term Goals and Additional Indicators are based on frozen numbers as of June 30th for each consecutive year.

12

2017

2018Trend

Total Population and Persons Living with an HIV Diagnosis (PLWH)1 in Florida

Population20,555,73320,957,7052.0% increasePLWH118,177

119,6611.3% increaseStrategic Long-Term Goals2Reduce the annual HIV diagnosis rate per 100,000

24.123.4

2.9% decreaseIncrease the percent of persons diagnosed with HIV linked to care in 30 days75.4%81.1%7.6% increaseIncrease the percent of PLWH retained in care68.3%68.9%0.9% increaseIncrease the percent of PLWH with a suppressed viral load61.5%

63.7%3.6% increaseReduce the annual number of babies born in Florida with perinatally acquired HIV to fewer than 59

811.1% decrease Additional Indicators2

Reduce annual AIDS diagnosis rate per 100,0009.99.2

7.1% decreaseReduce the annual number of HIV-related deaths749692

7.6% decrease

Slide13

1981

– First AIDS case report1985 – First HIV antibody test in Florida

1989

– Crack cocaine epidemic increases syphilis and AIDS diagnoses

1991

– First Ryan White Planning Group established1992 – The beginning of highly active antiretroviral therapy (HAART)1993 – Centers for Disease Control and Prevention (CDC) expands the case definition of AIDS1994 – Food and Drug Administration approves OraSure saliva HIV test1997 – Florida implements physician and laboratory reporting of HIV by name on July 12006 – HIV reporting laws expand in Florida

2007 – Expansion of electronic laboratory reporting (ELR)Key Events to Note in the HIV/AIDS Epidemic

Slide14

Diagnoses of HIV, 1978–2018, Florida

1992

Highly active antiretroviral therapy (HAART)

1997

Implementation of HIV reporting

Slide15

HIV Trends in Florida

Slide16

Diagnoses of HIV, 2009–2018, Florida

10 year % change (2009–2018) = 5% decrease

Slide17

Diagnoses of AIDS, 2009–2018, Florida

10 year % change (2009–2018) = 50% decrease

Slide18

Diagnoses

of HIV and AIDS,

2009–2018, Florida

1

Population rate data are provided by Florida CHARTS as of 06/30/2019.

Slide19

HIV Tests Conducted in Florida and Seropositivity

1

,

1986–2018

1

Seropositivity is defined as the percent of positive results over the number of tests conducted each year. HIV Counseling and Testing data as of 6/30/2019.

Slide20

Seropositivity

1

among Adult (Age 13+) Males by Age and Race/Ethnicity from HIV Tests Conducted in Florida 2018

1

Seropositivity is defined as the percent of positive results over the number of tests conducted each year. HIV Counseling and Testing data as of 6/30/2019.

Slide21

Seropositivity

1

among Adult (Age 13+) Females by Age and Race/Ethnicity from HIV Tests Conducted in Florida 2018

1

Seropositivity is defined as the percent of positive results over the number of tests conducted each year. HIV Counseling and Testing data as of 6/30/2019.

1

Seropositivity is defined as the percent of positive results over the number of tests conducted each year. HIV Counseling and Testing data as of 6/30/2019.

Slide22

Perinatally Acquired HIV Diagnoses,

Born in Florida, 1979–2018

Year of Birth

Number of Diagnoses

Percent

change from previous year

20146

20159

50%20168–11%20179

13%20188–11%

1992–1994 introduction of HAART1

1Hightly active antiretroviral therapy (HAART) is an HIV treatment that suppresses viral load and reduces HIV transmission.

Slide23

Perinatal HIV Exposures

State Total N=497

N=8

Pediatric HIV (not AIDS) (N=6)

Pediatric AIDS (N=2)

0

1–10

11–30

31–90

Perinatal HIV Exposures, Born in Florida, 2018

Slide24

Male to Female

Ratio

2009 = 2.8 to 1

2018 = 3.9 to 1

1

Data by

BirthSex

includes persons does NOT exclude transgender persons.

Slide25

Adult (Age 13+) HIV Diagnoses by Gender

2009–2018, Florida

Slide26

Other includes American Indian/Alaska Native, Asian/Pacific Islander, and multi-racial.

Slide27

HIV Diagnosis Rates

1

per 100,000 Population by

Race/Ethnicity, 2009–2018, Florida

1

Population data were provided by Florida CHARTS as of 6/30/2019.

Other includes American Indian/Alaska Native, Asian/Pacific Islander, and multi–racial.

1

Population data were provided by Florida CHARTS as of 6/30/2019.

Other includes American Indian/Alaska Native, Asian/Pacific Islander, and multi–racial.

Slide28

HIV Diagnoses Among Asians and American Indians,

by Race/Ethnicity, 1982–2018, Florida

Slide29

Adult (Age 13+) HIV Diagnoses Among Asians and

American Indians, 1982–2018, Florida

American Indian and Asian data include those with mixed racial/ethic background.

Slide30

Slide31

Adult (Age 13+) HIV Diagnoses,

by Mode of Exposure,

2009–2018,

Florida

Men who have sex with men (MSM), MSM/Injection Drug Use (IDU), and heterosexual data excludes transgender persons.

Men who have sex with men (MSM), MSM/Injection Drug Use (IDU), and heterosexual data excludes transgender persons.

Slide32

Adult (Age 13+) Male HIV Diagnoses,

by Mode of Exposure, 2009–2018, Florida

Men who have sex with men (MSM), MSM/Injection Drug Use (IDU), and heterosexual data excludes transgender persons.

Men who have sex with men (MSM), MSM/Injection Drug Use (IDU), and heterosexual data excludes transgender persons.

Slide33

Adult (Age 13+) Female HIV Diagnoses,

by Mode of Exposure, 2009–2018, Florida

Heterosexual data excludes transgender persons.

Slide34

Demographics of HIV Diagnoses in Florida

Slide35

HIV Diagnosis Rate

per 100,000 Population

State Rate=23.4

Rates of Diagnoses of HIV

1

by County of Residence

2

,

2018, Florida

1Population data were provided by Florida CHARTS as of 6/30/2019. 2County totals exclude diagnoses from Department of Corrections and Federal Correctional Institutions (N=97).

Slide36

HIV Diagnoses by County of Residence,

and Registered Testing Sites

1

, 2018, Florida

HIV Diagnoses

State Total N=4,906

Numbers on map are number of registered testing sites

State Total N=1,451

1

HIV Counseling and Testing data as of 06/30/2019.

1

HIV Counseling and Testing data as of 06/30/2019.

Slide37

1

Population data were provided by Florida CHARTS as of 6/30/2019.

Percentage of Adult (Age 13+) HIV and AIDS Diagnoses

and Population

1

, by Race/Ethnicity, 2018,

Florida

Florida Adult

Population Estimates

N=17,960,621

HIV N=4,892AIDS N=1,913

Slide38

Adult (Age 13+) HIV Diagnosis Rates

1

by Sex and Race/Ethnicity, 2018, Florida

Rate Ratios:

Males

Black to White: 5.2 to 1

Hispanic/Latino: to White, 3.3 to 1

Females

Black to White: 10.5 to 1 Hispanic/Latina to White: 2.4 to 11Population data were provided by Florida CHARTS as of 6/30/2019.

Slide39

Adult (Age 13+) AIDS Diagnosis Rates

1

by Sex and Race/Ethnicity, 2018, Florida

Rate Ratios:

Males

Black to White: 6.4 to 1

Hispanic/Latino to White: 2.4 to 1

Females

Black to White: 11.7 to 1 Hispanic/Latina to White: 1.8 to11Population data were provided by Florida CHARTS as of 6/30/2019.

Slide40

Adult (Age 13+) HIV Diagnoses,

by Sex and Age at Diagnosis, 2018, Florida

Slide41

Men who have sex with men (MSM), MSM/Injection Drug Use (IDU), and heterosexual data excludes transgender persons.

Other includes American Indian/Alaska Native, Asian/Pacific Islander, and multi-racial.

Slide42

Heterosexual data excludes transgender persons.

Other includes American Indian/Alaska Native, Asian/Pacific Islander, and multi-racial.

Slide43

HIV Diagnoses by Select Country/Dependent Area of Birth,

1

2018, Florida

1

Select countries of birth include top nine countries/U.S. dependent areas. Excludes “Other” and “Unknown” country of birth.

Slide44

HIV Diagnoses by Select Country/Dependent Area

1

of Birth

Outside the US, 2014–2018, Florida

1

Select countries of birth include top six countries/U.S. dependent areas outside the continental United States. Excludes “Other” and “Unknown” country of birth.

Slide45

HIV Co-Morbidity Data

Slide46

Adult (Age 13+) Early Syphilis

1

Diagnosis Rates

2

by Sex, 2014–2018, Florida

Male to Female Ratio

2014 = 9.2 to 1

2018 = 7.3 to 1

1

Early syphilis (Primary, secondary and early syphilis) data provided by the STD & Viral Hepatitis Section. 2Population data provided by Florida CHARTS as of 06/30/2019.

Slide47

Adult (Age 13+) Chlamydia and Gonorrhea

1

Diagnoses,

2014–2018, Florida

1

STD data provided by the STD & Viral Hepatitis Section.

Slide48

Adult (Age 13+) Early Syphilis

1

and HIV Diagnoses,

2014–2018, Florida

1

Early syphilis

(Primary, secondary and early syphilis)

data provided by the STD & Viral Hepatitis Section.

2

Co–infected persons are infected with both HIV and early syphilis at the same time. Early SyphilisHIVCo–infected

Slide49

Persons Living with an HIV Diagnosis with

a Co-occurring Diagnosis of an STD,

1

by

Type and Year of STD Report,

2 2014–2018, FloridaYear of STD ReportHIV/

Early Syphilis3HIV/Chlamydia

HIV/Gonorrhea20141,808

1,3811,315

20152,2171,5651,74120162,405

1,8332,01720172,4462,224

2,4072018

3,1002,5992,7801Sexually transmitted disease 2STARS, STD Section as of 07/10/2019 3Early syphilis (Primary, secondary and early non-primary non-secondary)

Slide50

HIV/HBV

1

Co-infected Adult (Age 13+) Diagnoses

by Sex and Mode of Exposure, 2018, Florida

MSM

IDU

MSM/IDUHeterosexual

Other Risk2UnknownN=239N=40

1

Source: Hepatitis B (HBV) data, which includes both acute & chronic cases reported in 2018 were generated from MERLIN as of 9/4/2019.2 Other Risk includes hemophilia, transfusion, perinatal & other pediatric risks and other confirmed risks.

Slide51

HIV/HCV

1

Co-infected Adult (Age 13+) Diagnoses

by Sex and Mode of Exposure, 2018, Florida

MSM

IDU

MSM/IDUHeterosexualOther Risk2Unknown

N=367N=112

1

Source: Hepatitis C (HCV) data, which includes both acute & chronic cases reported in 2018 were generated from MERLIN as of 9/4/2019.2 Other Risk includes hemophilia, transfusion, perinatal & other pediatric risks and other confirmed risks.

Slide52

AIDS Diagnoses with TB

by Year of TB Report,

1

Florida, 2014–2018

Year of TB Report

HIV/TB

2014

63201561

201666

201758201853

1Provided by TB Section. Data as of 05/24/2019.

Slide53

HIV Prevalence in Florida

Slide54

PLWH Rate

per 100,000 Population

State Rate=571

Rates

1

of Persons Living with an HIV Diagnosis (PLWH)

by County of Residence,

Year-End

2018, Florida

Numbers on map are number of PLWHState Total N=119,661

1

Population data were provided by Florida CHARTS as of 6/30/2019.

Slide55

One-In Statements for Adults (Age 13+)

Living with an HIV Diagnosis, Year-End 2018, Florida

One in 150 adults in Florida were living with HIV.

One in 292 Whites were living with HIV.

One in 49 Blacks were living with HIV.

One in 156 Hispanics/Latinos were living with HIV.

Slide56

Adults (Age 13+) Living with an HIV Diagnosis, Year-End 2018, Florida

Male(#)

(%)

Female(#)

(%)

Total(#)

(%)

Race/Ethnicity

White29,50633.8%

4,95115.3%34,45728.8%Black

32,45137.2%

21,54566.7%53,99645.2%Hispanic/Latino23,43326.9%5,13815.9%

28,57123.9%Other1,825

2.1%6532.0%2,478

2.1%Age

13–192980.3%

1930.6%491

0.4%20–297,907

9.1%2,0446.3%9,951

8.3%30–3914,12116.2%

5,29616.4%19,417

16.2%40–4917,546

20.1%8,181

25.3%25,72721.5%50+

47,34354.3%16,573

51.3%63,91653.5%

Mode of ExposureMSM

60,45069.3%0

N/A60,45050.6%IDU

5,1405.9%

3,82911.9%8,969

7.5%MSM/IDU4,3365.0%0

N/A4,3363.6%

Heterosexual contact16,18018.6%27,560

85.4%43,74036.6%

Transgender Sexual Contact3020.4%

110.0%346

0.3%Other risk8070.9%

8872.8%1,661

1.4%

TotalTotal

87,215100.0%32,287100.0%

119,502100.0%

56

Slide57

Transgender

1

Adults (Age 13+) Living with an HIV Diagnosis,

Year-End 2018, Florida

1

Limitations: Transgender data were not aggressively collected or recorded until 2013.

Female-to-Male(#)

(%)

Male-to-Female(#)(%)Race/EthnicityWhite

431%5717%Black4

31%168

50.%Hispanic/Latino539%10130%Other00%103%

Age13–1918%

21%20–298

62%6921%30–39

00%12638%

40–49215%

6820%50+2

15%7121%Mode of Exposure

Sexual Transmission1185%30290%

IDU215%

3410%Other risk

00%0

0%TotalTotal13

100%336100%57

Slide58

Following Ending the Epidemic: A Plan for America

Slide59

PLWH Rate per 100,000 Population

State Rate = 571

1

Population data provided by Florida CHARTS as of 6/30/2019

Persons Living with HIV

by County of Residence, Year-End 2018, Florida

1

PLWH Rate per 100,000 Population

County

Number of PLWH

Broward21,048Duval6,645Hillsborough 7,521Miami-Dade28,345

Orange9,513Palm Beach

8,574Pinellas4,900

Slide60

HIV Care in Florida

Slide61

HIV Care Continuum Definitions

Persons Living with an HIV Diagnosis (PLWH):

The number of persons known to be living with an HIV diagnosis at the end of 2018, from data as of 6/30/2019

In Care:

PLWH with at least one documented VL or CD4 lab, medical visit, or prescription from 1/1/2018 through 3/31/2019

Retained in Care:

PLWH with two or more documented VL or CD4 labs, medical visits, or prescriptions at least three months apart from 1/1/2018 through 6/30/2019

Suppressed Viral Load: PLWH with a suppressed VL (<200 copies/mL) on the last VL from 1/1/2018 through 3/31/2019

Slide62

119,661

89,925

76,242

Persons Living with an HIV Diagnosis (PLWH) in Florida

Along the HIV Care Continuum in 2018

Slide63

4,906

3,506

Persons Who Received an HIV Diagnosis in 2018

in Florida along the HIV Care Continuum

3,977

Slide64

Persons Living with an HIV Diagnosis (PLWH) Attributed to Injection Drug Use (IDU)

Compared to All PLWH in Florida Along the HIV Care Continuum in 2018

Slide65

Persons Living with an HIV Diagnosis (

PLWH)

Among Men who have Sex with Men (MSM)

1

Compared to All PLWH in Florida Along the HIV Care Continuum in 2018

1 Men who have sex with men (MSM) includes MSM/Injection Drug Use (IDU) and excludes transgender persons

.

Slide66

Women of Childbearing Age (WCBA) Living with HIV

C

ompared to All

PLWH

in Florida Along the HIV Care Continuum in 2018

Slide67

Adult (Age 13+) Transgender Women Living with an HIV Diagnosis

Compared to All PLWH in Florida Along the HIV Care Continuum in 2018

Slide68

Persons Living with an HIV Diagnosis in Florida by

Race

/Ethnicity, Along

the HIV Care Continuum in 2018

Slide69

Percentage of Persons Living with an HIV Diagnosis in

Florida Who Were Retained in Care in 2018

Statewide Data:

N=119,661

69% Retained in Care

Slide70

Percentage of Persons Living with an HIV Diagnosis in Florida Who Had a Suppressed Viral Load (VL) in 2018

Statewide Data:

N=119,661

64% Suppressed VL

(<200 copies/mL)

Slide71

Percentage of Persons Living with an HIV Diagnosis in

Florida Who Were Not in Care in 2018

Statewide Data:

N=119,661

25% Not In Care

(~30,000)

Slide72

Unmet Need of Care Services Among

Persons Living with an HIV Diagnosis

in Florida, Medical Monitoring Project, 2017

SSDI=Social Security Disability Insurance; SSI=Supplemental Security Income

Slide73

HIV-1 Antiretroviral Drug Resistance in HIV Diagnoses

with a Genotype Sequence, Florida, 2018

Source: eHARS and Stanford HIV Drug Resistance Database; PI=protease inhibitors; NRTI=nucleoside reverse transcriptase inhibitors; NNRTI=non-nucleoside reverse transcriptase inhibitors; IN=integrase inhibitors

Slide74

HIV-Related Deaths in Florida

Slide75

Resident Deaths

1

due to HIV, 2009–2018, Florida

10 year % change (2009–2018) = 44% decrease

1

Florida Department of Health, Division of Public Health Statistics and Performance Management, Bureau of Vital Statistics, Death Certificates (as of 6/30/2019).

Slide76

Rate

1

of Resident Deaths due to HIV, by Race/Ethnicity,

2009–2018, Florida

1

Florida Department of Health, Division of Public Health Statistics and Performance Management, Bureau of Vital Statistics, Death Certificates (as of 6/30/2019).

Slide77

Rate

1

of Resident Deaths

2

due to HIV,

by Sex and Race/Ethnicity, 2018, Florida

Rate Ratios:

Males Blacks to White: 4.9 to 1 Hispanic/Latino to White: 1 to 1 Females Blacks to White: 19.6 to 1 Hispanic/Latino to White: 1.6 to 1

1Florida Department of Health, Division of Public Health Statistics and Performance Management, Bureau of Vital Statistics, Death Certificates (as of 6/30/2019).

Slide78

Deaths due to HIV among Persons

Age 25 to 44, 2018, Florida

HIV is the 9

th

leading cause of death overall (down from 8

th

in 2017).HIV is the 9th leading cause among males (down from 8

th in 2017).HIV is the 9th leading cause among females (down from 7th in 2017).HIV is the 14th leading cause of death among Whites (down from 13

th in 2017).HIV is the 5th leading cause of death among Blacks (same since 2015).HIV is the 9

th leading cause of death among Hispanic/Latinos (same since 2015).1Florida Department of Health, Division of Public Health Statistics and Performance Management, Bureau of Vital Statistics, Death Certificates (as of 6/30/2019).

Slide79

Death Rates

1

for the Top Seven Leading Causes of Death

2

among Persons 25–44 Years of Age, 1988–2018, Florida1Population data were provided by Florida CHARTS as of 6/30/2019. 2Florida Department of Health, Division of Public Health Statistics and Performance Management, Bureau of Vital Statistics, Death Certificates (as of 6/30/2019).

Slide80

HIV Prevention

Slide81

Florida’s Top Priority Populations

1

for Primary HIV Prevention in 2018

1

MSM=MSM and MSM/IDU diagnoses and IDU=IDU and MSM/IDU diagnoses, therefore the data are not mutually exclusive.

Slide82

Florida’s Top Priority Populations

1

Prevention for PLWH in 2018

1

MSM=MSM and MSM/IDU diagnoses and IDU=IDU and MSM/IDU diagnoses, therefore the data are not mutually exclusive.

Slide83

HIV Testing

Pre–Exposure Prophylaxis (PrEP)

Antiretroviral Therapy (ART)

Florida HIV/AIDS Hotline

All adolescents and adults (ages 13–64) should be tested for HIV at least once during their lifetime. Persons at increased risk for HIV should be tested at least

annually

. Per Florida law, all pregnant women are to be tested for HIV and other sexually transmitted infections (STIs) at their initial prenatal care visit, again at 28–32 weeks, and at labor and delivery if HIV status is unknown.

www.knowyourhivstatus.comFor persons at increased risk for HIV, PrEP medication, taken once daily, can reduce the risk of acquiring HIV through sexual contact by over 90% and through injection drug use by 70% Condoms are still important during sex to prevent other STIs and unwanted pregnancy. STIs are increasing in Florida and can increase HIV risk. To find a PrEP provider, visit preplocator.org.

For Persons Living with HIV (PLWH), starting ART with a provider as soon as possible improves health outcomes by reducing the risk of disease progression and reducing viral load. PLWH who take ART as prescribed and get and keep an undetectable viral load have effectively no risk of transmitting HIV to their HIV-negative sexual partners. ART is recommended for all persons living with HIV, regardless of how long they’ve had the virus or how healthy they are. To find a care provider or to learn more about the resources available to PLWH, visit floridaaids.org.

1-800-FLA-AIDS (352-2437) English1-800-545-SIDA (545-7432) Spanish1-800-AIDS-101 (243-7101) Haitian Creole1-800-503-7118 Hearing/Speech Impaired211bigbend.org/flhivaidshotlineText ‘FLHIV’ or ‘flhiv’ to 898211For more information, contactDiseaseControl@flhealth.gov.83

Slide84

Some Useful Links

Slide85

Eunice Sawaya, MPA, CPM

Medical Health Care Program Analyst

Florida Department of Health

Phone: 850-901-9650

Email:

Eunice.Sawaya@flhealth.govHIV/AIDS surveillance data are frozen on June 30 for the previous calendar year.

These are the same data used for Florida CHARTS and all grant-related data.floridacharts.com/charts/CommunicableDiseases/default.aspxFlorida HIV/AIDS Surveillance Data Contacts

Emma Spencer, MPH, PhDSurveillance Program ManagerFlorida Department of HealthPhone: 850-245-4432Email: Emma.Spencer@flhealth.gov

To protect, promote, and improve the health of all people in Florida through integrated state, county, and community efforts.

Danielle Curatolo, MPHResearch AnalystFlorida Department of HealthPhone: 850-901-6983Email: Danielle.Curatolo@flhealth.govAshleigh TillerData Reports Coordinator

Florida Department of HealthPhone: 850-901-6984Email: Ashleigh.Tiller@flhealth.gov Lorene Maddox, MPHSurveillance Data Analysis Manager Florida Department of HealthPhone: 850-901-6968Email: Lorene.Maddox@flhealth.gov