/
Oxford EDS Computer Screen and Oxford EDS Software – AZTEC, Double Click Oxford EDS Computer Screen and Oxford EDS Software – AZTEC, Double Click

Oxford EDS Computer Screen and Oxford EDS Software – AZTEC, Double Click - PowerPoint Presentation

priscilla
priscilla . @priscilla
Follow
65 views
Uploaded On 2023-11-11

Oxford EDS Computer Screen and Oxford EDS Software – AZTEC, Double Click - PPT Presentation

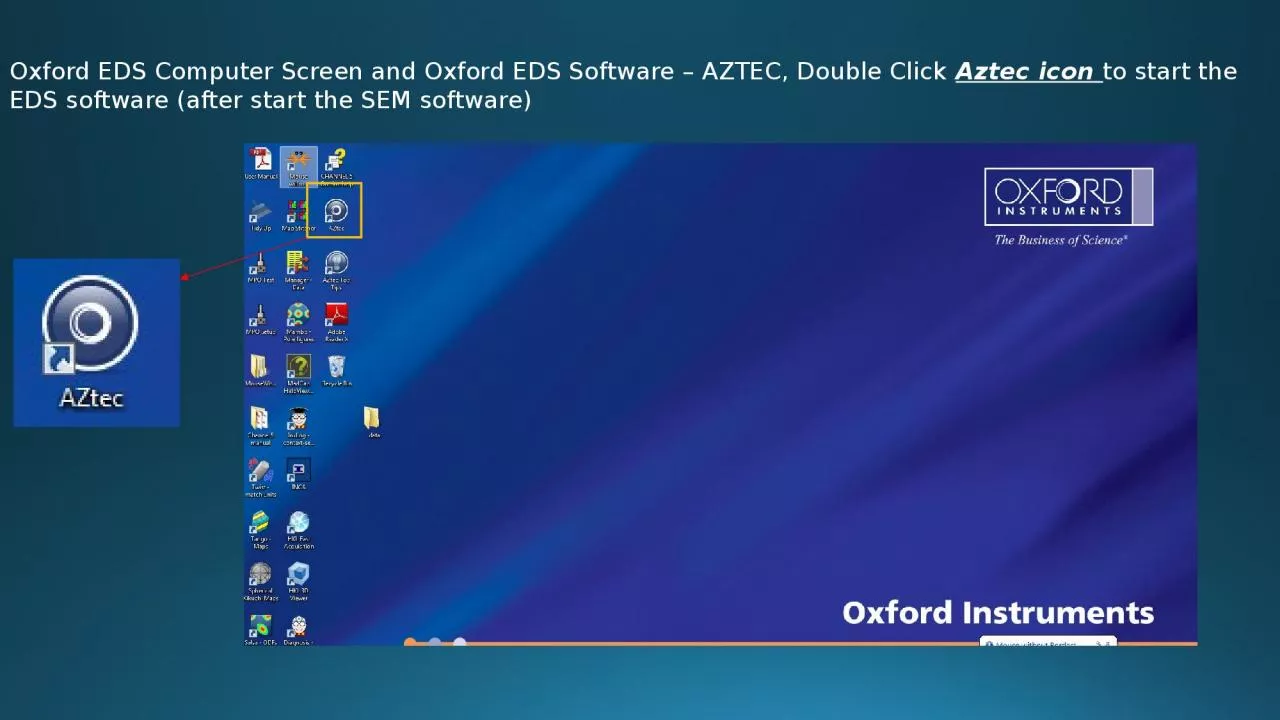
Aztec icon to start the EDS software after start the SEM software Open Or Set up New Project Default Project Name Project 1 you can change the name Put your data on the D directory Data Tree Project ID: 1031322

click image select eds image click eds select elements point element spectrum time amp software spectra save scan specimen

Share:

Link:

Embed:

Download Presentation from below link

Download Presentation The PPT/PDF document "Oxford EDS Computer Screen and Oxford ED..." is the property of its rightful owner. Permission is granted to download and print the materials on this web site for personal, non-commercial use only, and to display it on your personal computer provided you do not modify the materials and that you retain all copyright notices contained in the materials. By downloading content from our website, you accept the terms of this agreement.


Presentation Transcript

1. Oxford EDS Computer Screen and Oxford EDS Software – AZTEC, Double Click Aztec icon to start the EDS software (after start the SEM software)

2. Open Or Set up New Project

3. Default Project Name  Project 1 (you can change the name)

4. Put your data on the D directory

5.

6. Data Tree : Project  Specimen (like thin section name)  Site (like circle name of the thin sections)  Images and EDS Spectra

7. This is the starting window Navigation PanelSupport Panel

8. Analyzer : Provide you with a general spectrum of the whole image in the SEM window (no image taken, just EDS spectra). Point & ID : Allows EDS acquisition and image acquisition (used most of time).LineScan : Provide you with a linear elemental distribution within the image.Mapping : Provide you with a 2D elemental distribution (a full spectrum is stored from each pixel).Optimze: Do not use it.

9. Make sure the software is set to EDS-SEM instead of EBSD if using EDS.

10. Point&ID It allows to take image and show the area for EDS on the image.

11. Point & ID  Describe Spectrum  SummaryYou can write notes about the sample and the notes will be included in the saved reports (normally skip this part to save time). Make sure to include the information about a specimen coating (ex. Carbon). Spectral data from the sample coating will automatically be screened out by the software. Check Sample is coated and then put 40nm if you use the samples coated for microprobe.

12. Point & ID  Describe Spectrum  Specimen Geometry  “pre-tilted specimen holder” is not selected (when EBSD is used, this is selected by people. So you should not select it if not using EBSD). This is also a place to add new specimen (click New Specimen button).

13. Point & ID  Describe Spectrum  Pre-defined Elements –> Elements of particular interest can be added to the AutoID (Click Clear ALL first (to avoid confusion later)then select perform Auto ID During Acquisition).

14. Point & ID  Scan Image Tab : take SE or BSE image from hereClick Setting button.

15. Settings:Scan Size: 64 – 8912 (normally 1024 or 2048)Dwell Time: 5µs (fast), 10 µs (normal) (This is scan speed)Input Signal: SE (even for BSE)Number of Frame: normally 1 Uncheck Software Tilt CorrectionAuto Lock (don’t use most time, so do not touch it)

16. You can put more images under a single Site if you lock the image by clicking the padlock icon. If you don’t lock the image, the next image will overwrite the current image.

17. Click START button to obtain image.Note: This is continuously scan button. You can use it if you want to adjust the SE/BSE image, such asfocus , brightness and contrast adjustment … before taking the image. Click again to stop it.

18. You can Edit the image with these icons (normally not use them)

19. Point & ID  Click Acquire Spectra Tab: obtain EDS spectrum from here.

20. Check Settings:Energy Range : normally Auto or 20.Number of Channels: normally 2048.Process Time: Normally 4 (5 or 6 for elements close each other, 2 or 1 for mappping).Acquisition Mode and Time: Live Time and 20s (more for mirror elements).Select Pulse Up Correction .

21. On the bottom left side, Select Rate (not Mini View). Check the Dead Time on the detector, it should be between 30-70%. For quantitative analysis, it should be around 30-40%. If not in the range, change the Spot intensity in Hitachi SEM.

22. Use this menu (point, square, circle and any shape ) and click the location on the image. The EDS spectra will start and be saved automatically on each locations Click start to scan the entire area as displayed by the electron image (normally not use that) The status bar will show the progress of the scan

23. Image area with locations of the spectrumEDS spectrumMini CompositionsYou can change the spectrum name any time

24. You can show spectrum intensity or weight percent of the elements.

25. Here allows you to show only image, image plus spectra or only spectra

26. Point & ID  Click Confirm Elements (to verify and identify the elements from here):

27. Click Setting then select Marker (it is default, normally you skip this part)

28. Select the element: Double click the element or select the element and then click the include button (green)Remove the element: select the element and the click exclude button (red) You can change the energy range and peak height with mousePress Clear all and use the Auto-ID function to relabel the peaks. You can adjust the spectrum range, height…You can remove/add element label… (normally remove carbon label because it comes from coating)

29. Click ? (information)  double click the peak of the spectrum  confirm the element with the best match between actual and theoretical peak (brown color)

30. Point & ID  Click Calculate Composition Tab from here:Calculate Composition after element IDs are confirmed (in confirm element tab).

31. Click Settings : Processing option  all elements or Oxygen by stoichiometry (if oxides)Put number of oxygen ions (in formula) if you know mineral nameSelect Normalize results Element list  current spectrumQuant Standardization  FactoryThreshold quantitative results  enable  3 (~ 1 wt %)Select Automatic line selections for all elements unless you want to use different lines.You can change valence of elements hereAfter make changes, click Apply and Save  close  Requantify

32. Requantify

33. Click Edit Column to set up display of the calculate result

34. Export ResultMethodsReport Results Tab  Save As : save a .doc file for a site

35. 2) Report Results  Report Templates  Select a template  Save As : save a .doc or excel file (including note..image..spectra and quant data depending on the template). Normally choose “ Current Image-Notes-Multiple Colour Spectra and Quant”

36.

37. Close the software : File  Close AZtecAlthough the files are saved automatically when they are created, you should go to “File” and “Save Project” before moving your documents, shutting down the software, or turning off the beam to avoid losing data..